This article outlines how to create lists (templates) of possible profiling fields and analyse them using the Index Profiler to identify targets of interest and add them to dataset collections for use in further analysis.
This workflow assumes the following are present in the active project:
- A Primary Contact Table (Required) - this is the table upon which the target profiling/analysis will be performed
- A First Party, or Client Data Source (Required) - this is the table providing the prospecting target - i.e., the dataset of records we want to match to or compare with
- One or more Data Sources (Optional) - sometimes profiling data is not already present on the Primary Contact Table (PCT) and needs to be copied from one or more third-party datasources.
- Datasources and PCT linked as appropriate (Required)
(See Audience Creation - Data Preparation for more details on how to set up a project ready for target dataset selection)
Tools used:
Overview:
The following process identifies target datasets (or population groups) for further analysis. It does so by comparing a population of interest, such as Recent Purchasers, with other populations in order to pinpoint characteristics that align individuals with the population of interest. This is achieved using an index profile report, which highlights over- and under-represented attributes across populations.
To perform this process, the following are required:
- Profiling fields: Data attributes (e.g., demographics, behaviours) used to characterize populations.
- Population(s) of interest: Specific groups, such as Recent Purchasers, selected for comparison.
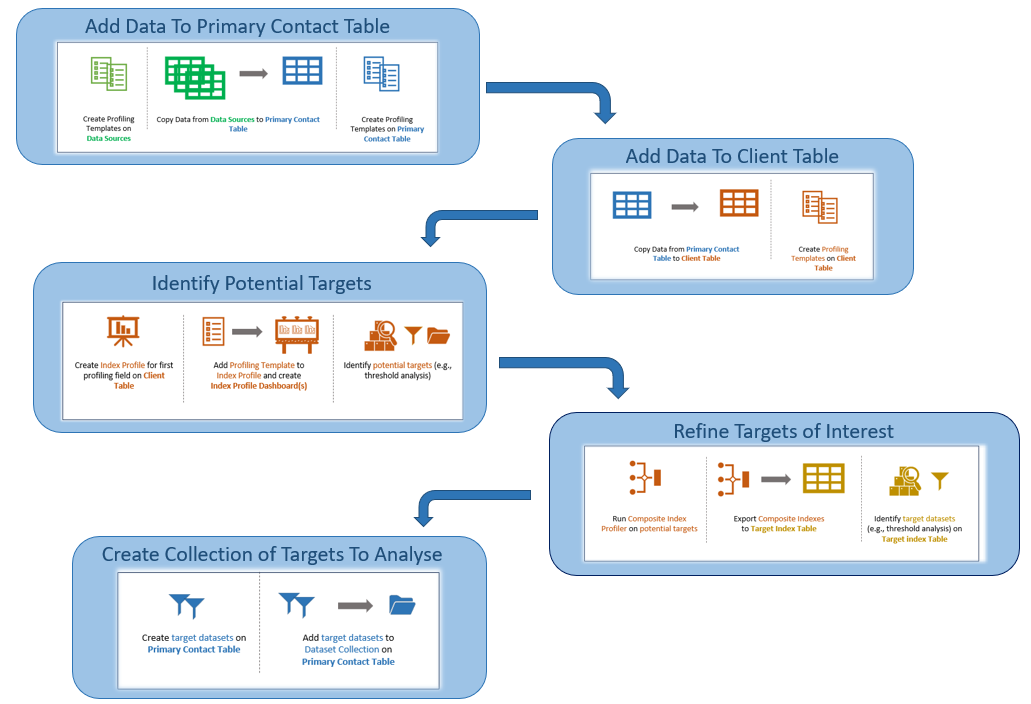
5 stages are outlined - some of which are optional as they may already have been completed as part of other workflows:
- Copy Attributes from Third-Party Data Sources to Primary Contact Table - Usually this has been done as part of the database build
- Copy Attributes from Primary Contact Table to Client Data Source - This may also have been done as part of the database build
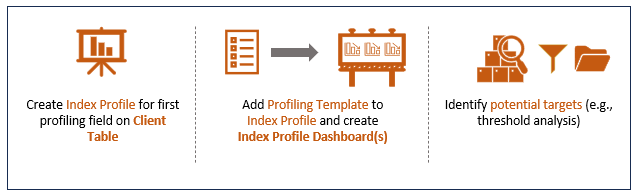
- Run Index Profile Iteration on Client Data Source to identify potential targets - This is the typical pre-processing mechanism for narrowing the list of potential targets, which may be large, to a list that is small enough to run through the Segment Analyser or other Analysis Process (e.g., Income Band, Age Band, Purchase Frequency...)
- Run Composite Index Profile on potential targets - This provides a further stage of pre-processing to identify specific value combinations across potential targets (e.g., Age > 70 AND Income < 25k AND Region = North West)
- Create Dataset Collection(s) of targets of interest - Based on the output of index profiling, a sub-set of profiling targets is grouped together ready for the next stage of the process.
At the end of this process, the following will be available:
- Primary Contact Table with prospecting data attached
- Client Table with profiling data attached
- Profiling templates
- Client Index Dashboards showing under and over-representation for different attributes
- Dataset Collection(s) of target datasets to use in Segment Analysis
1. Copy Attributes to Primary Contact Table
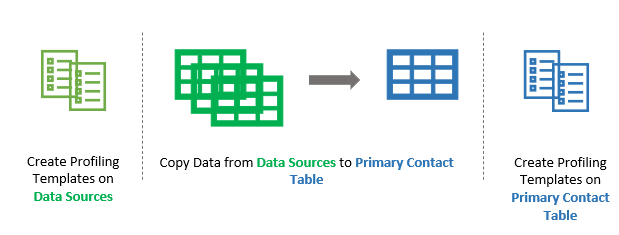
If the data that is going to be used for profiling is not native to the primary contact table (i.e., the table on which the target data analysis is going to be performed), it will need to be copied from other data sources. Assuming there are multiple profiling fields to be copied (where profiling fields might be demographics such as "age", "income", "gender", or other attributes such as "frequent shopper", "high value" etc), this can most easily be done using field templates. If working on audience creation, it is often useful to have templates of profiling fields on source tables, client tables and the primary contact table.
At the end of this step the following will be available:
- Primary Contact Table with:
- profiling fields
- profiling templates
Skip this step if data and profiling templates are already present on the Primary Contact Table
Step 1a - Copy Data From Data Sources to Primary Contact Table
Usually the primary profiling fields have been copied to the Primary Contact Table from third-party data sources as part of the database build, or as part of a Data Preparation Workflow. This can be verified by doing the following:
- Open Project Explorer
- Select and Expand the Primary Contact Table to view the field list (Note: if there are a very large number of fields on the Primary Contact Table, the Expand icon (>) may be unavailable, in which case, right-click the table and choose "View as list")
- Confirm that the required profiling fields are present on the primary contact table. If they are, go to step 1b.
- If the profiling fields are not on the Primary Contact Table, copy them from other datasources using one of the following:
- CopyUpFromTemplate (F-> P) - use this method if the Primary Contact Table is the ONE side of a ONE to MANY join with the Source Data Table. Note: When doing CopyUp, there are usually multiple potential records that could be selected to copy to the primary table. If it matters which record is selected, a filter may need to be used to ensure the correct records are selected.
- CopyDownFromTemplate (P -> F) - use this method if the Primary Contact Table is the MANY side of the ONE to MANY join with the Source Data Table.
- Before using CopyUpFromTemplate or CopyDownFromTemplate, a field template(s) will need to be created on the Source Data Table(s). Usually these will have been created as part of the database build or a Data Preparation Workflow. Example names for these templates might be; xxx-standard-profile or xxx-client-specific-profile
- CopyUpFromTemplate and CopyDownFromTemplate both assume that the primary contact table is joined to the source data table(s). To test whether tables are joined, do one of the following:
- Open Engineering | Joins and look for the two tables in the list of existing joins
- Drag the Primary Contact Table Object from the Project Explorer into the HotBar to create a dataset of all records in the PCT table. Then drag the Data Source Table Object from the Project Explorer, drop it on top of the PCT dataset object and choose AND. If a number appears, the tables are linked. If a {...} appears, the tables are not linked. (See HotBar for more details)
Step 1b - Create templates of potential targets on Primary Contact Table
Check to see if profiling templates have been created on the Primary Contact Table:
- Open Project Explorer | Templates
- Look for the profiling templates (e.g., xxx-standard-profile or xxx-client-specific-profile)
- If these templates exist:
- Right-Click and choose View Template.
- Confirm they contain all the fields that are going to be analysed for their suitability in profiling.
- If the field list is not complete/sufficient, go to item 5 to modify the templates.
- If the templates do not exist:
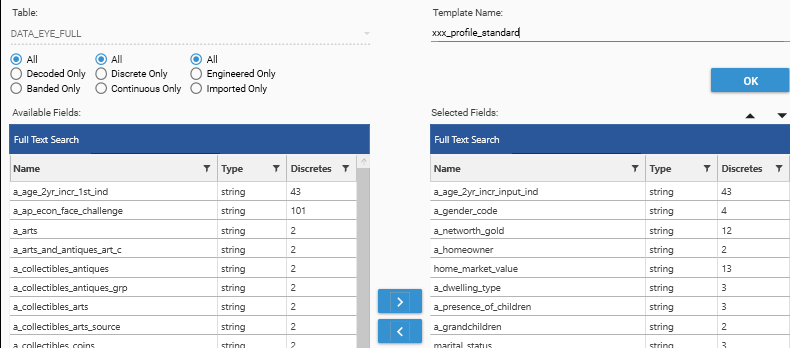
- Right click in the Templates tab and choose "Create Template" or select the "Create Template" icon.
- Select the Primary Contact Table in the table drop-down
- Use the field selector to move required fields from "Available Fields" to "Selected Fields"
- Save the template as pct-{template-name}
Sample JSON
The following are examples of JSON methods to AddTemplate and CopyUpFromTemplate:
{
  "method": "AddTemplate",
  "name": "pct_profile_standard",
  "overwrite": false,
  "fields": [
    "PCT.age_2yr_incr_input_ind",
    "PCT.income_banded",
   ...
  ],
  "project": "WORKFLOW_AudienceCreation"
}
{
"method": "CopyUpFromTemplate",
"targetTable": "PCT",
"template": "ds1_profile_standard",
"overwrite": false,
"description": "Copy standard profiling fields from DataSource1 to PCT",
"prefix": "",
"project": "WORKFLOW_AudienceCreation"
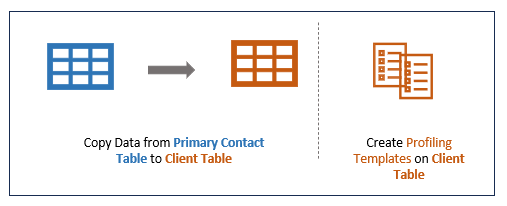
}2. Copy Attributes to First-Party/Client Data table
At the end of this step the following will be available:
- Client Table with:
- profiling fields
- profiling templates
Skip this step if data and profiling templates are already present on the Client Table
- Copying from the Primary Contact table and then to the client table, rather than directly from the data-source tables to the client table, ensures that the analysis that is done on the client table is a more accurate representation of the data in the primary contact table.
- The counts in the Indexing part of Target Dataset Selection (steps 3,4) will represent data that is in the Primary Contact Table AS WELL AS in the Client and Data Source Tables.
Step 2a - Copy From Primary Contact Table to Client Table
Usually the primary profiling fields have been copied to the Client Table from the primary contact table as part of the database build, or as part of a Data Preparation Workflow. This can be verified by doing the following:
- Open Project Explorer
- Select and Expand the Client Table to view the field list (Note: if there are a very large number of fields on the Client Table, the Expand icon (>) may be unavailable, in which case, right-click the table and choose "View as list")
- Confirm that the required profiling fields are present on the client table. If they are, go to step 1b.
- If the profiling fields are not on the Client Table, copy them from the Primary Contact Table using one of the following:
- CopyUpFromTemplate (F-> P) - use this method if the Client is the ONE side of a ONE to MANY join with the Primary Contact Table. (Note: When doing CopyUp, there are usually multiple potential records that could be selected to copy to the primary table. If it matters which record is selected, a filter may need to be used to ensure the correct records are selected.)
- CopyDownFromTemplate (P -> F) - use this method if the Client Table is the MANY side of the ONE to MANY join with the Primary Contact Table.
Step 2b - Create Profiling Templates on Client Table
Check to see if profiling templates have been created on the Client Table:
- Open Project Explorer | Templates
- Look for the profiling templates (e.g., client-standard-profile or client-client-specific-profile)
- If these templates exist:
- Right-Click and choose View Template.
- Confirm they contain all the fields that are going to be analysed for their suitability in profiling.
- If the field list is not complete/sufficient, go to item 5 to modify the templates.
- If the templates do not exist:
- Right click in the Templates tab and choose "Create Template" or select the "Create Template" icon.
- Select the Client Table in the table drop-down
- Use the field selector to move required fields from "Available Fields" to "Selected Fields"
- Save the template as client-{template-name}
{
  "method": "AddTemplate",
  "name": "client_profile_standard",
  "overwrite": false,
  "fields": [
    "CLIENT.age_2yr_incr_input_ind",
    "CLIENT.income_banded",
   ...
  ],
  "project": "WORKFLOW_AudienceCreation"
}
{
"method": "CopyUpFromTemplate",
"targetTable": "CLIENT",
"template": "pct_profile_standard",
"overwrite": false,
"description": "Copy standard profiling fields from PCT to CLIENT",
"prefix": "",
"project": "WORKFLOW_AudienceCreation"
}3. Run Index Profile Iteration on potential targets
The objective is to identify specific attributes that provide insight into the characteristics of a given population so that records matching those characteristics can be extracted from a larger prospect pool. This is done by calculating detailed indexes for target fields and their values and identifying the field/value combinations that over-index - i.e., that are over-represented in the population being examined.
Indexes are computed as the ratio of the target dataset’s proportion of a specific segment (e.g., "Recent Customers") to the base dataset’s proportion of the same segment. An index is expressed as a value relative to 1.0—values above 1.0 indicate over-representation, while values below 1.0 indicate under-representation.
- The population being studied is known as the "target dataset".
- The comparison population is known as the "base dataset".
- The attributes being examined are called the "dimensions", (or "profiling fields").
This section outlines how to create a sample Index Profile report for a single attribute, and then repeat the process for all attributes that are under consideration.
At the end of this step, the following will be available on the Client table:
- Dashboard(s) of Index Profiles for profiling attributes
- Field Template of potential target attributes
- Dataset Collection of potential simple attribute-value combinations
Step 3a - Base Dataset for Index Calculation
In order to calculate an Index Profile, a base population must be provided. This should be an accurate representation of the comparison population.
Assuming that Index Profiling is happening on a table of existing Client Customers, suitable base datasets might include:
- Entire Customer Database (default if no base dataset is specifically supplied)
- High-value responders
- Recent Purchasers
- ...etc
Often a scoring measure or a segmentation process will be used to select the base dataset - for example, an RFM (Recency-Frequency-Monetary) model.
(See Customer Segmentation - RFM for a worked example of calculating an rfm score)
In this instance, a base dataset of customers who have made a purchase in the last year is being used.
- Customers who have made a purchase in the last year represent an engaged behavioral group, typically characterized by ongoing activity, varying levels of loyalty, and potential for further engagement. Using this group as the base dataset focuses the analysis on attributes that differentiate the target dataset(s) from the broader population of active customers.
- For example, if the target dataset is "High-Value Responders" or "Recent Purchasers," the indexes will highlight attributes that distinguish these groups from the general active customer base, such as higher purchase frequency, specific product preferences, or demographic traits associated with increased spending or loyalty.
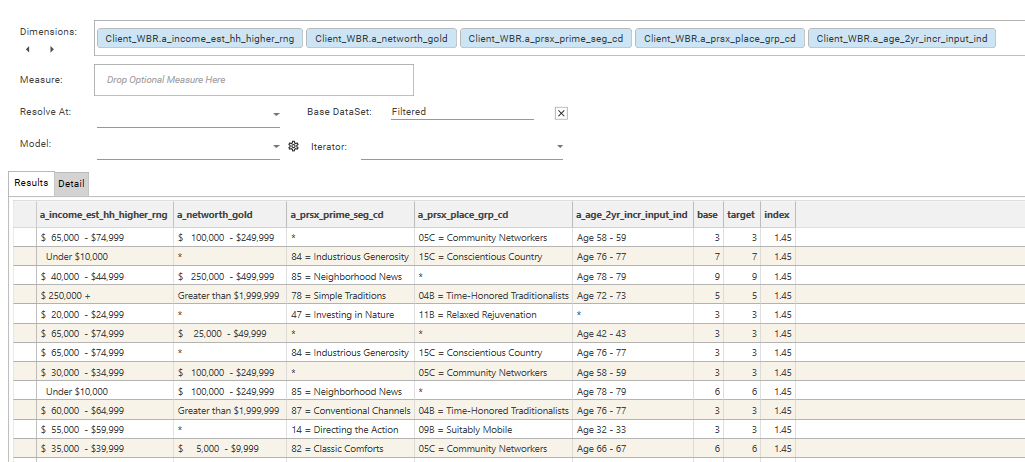
Step 3b - Sample Index Calculation
In order to do a rapid exploration of multiple attributes to see what is standing out - or "popping" - as a differentiator for the dataset of interest, a sample index calculation is set up, and then iterated for multiple dimensions. To set up the sample index calculation the following steps should be followed:
- Index Profile - Open the Index Profile report (Analytics | Index Profile)
- Dimension - Add a CLIENT table field (usually from the client-profile-standard template) as a dimension to the Index Profile
- Base Dataset - If the base Dataset is left blank, all records in the Client table will be used. Alternative base datasets could include:
- Recent Purchasers
- Records that are in both CLIENT and PRIMARY CONTACT TABLES
- Records that have an AMP+ individual or household key applied
- Target Dataset - A target dataset must be provided for an index calculation to give non-uniform results, otherwise there are no populations to compare. The target dataset is the group of interest that is going to be compared to the base population. To create a target dataset, drag data directly from Project Explorer or an Analysis report into the HotBar, or use Dataset Scratchto build up a query. Examples might be:
- Campaign Responders
- Recent Customers
- High Value/Loyal Customers
- Customer at risk of attrition
- To add the target dataset, drop the selected dataset onto the result grid.
- Tip! To see the details of the current target dataset, open the Info Panel.
- Once the calculation is complete, sort by Descending Index, either by:
- clicking the Index Column header,
- or by selecting "Descending Value"
- Turn on/off chart display as desired
- Turn ON Heat Map
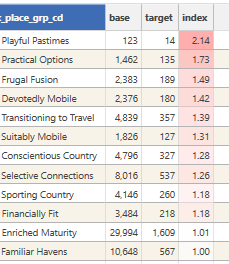
This output shows that 'Promising' customers, when compared to 'Recent Purchasers,' are more likely to be categorized in segments such as 'Playful Pastimes,' 'Practical Options,' 'Frugal Fusion,' 'Transitioning to Travel,' and 'Devotedly Mobile,' as indicated by their index scores above 1.0. However, it is worth noting that some segments, such as 'Playful Pastimes' (with base count 123 and target count 14), have low counts in both datasets. This suggests there may not be sufficient data to draw reliable conclusions from their index scores.
Step 3c - Add Field Template and Create Dashboard
Assuming that the sample Index Profile is now in the desired format, there are now 2 options available for automation:
- Iterate Dimensions using Field Templates and Dashboard
- Iterate Target Populations using Dataset Collections and Dashboard
- Iterate Target Populations using the "iterator" function
The following outlines iterating with dimensions:
A dashboard can be created that will repeat the indexing process for all attributes in a field template.
- Drop a Field Template (e.g., client-standard-profile) onto the result grid of the Index Profile Report created in the previous step
- Select 2 or 3 column dashboard from the context popup
- Wait for the dashboard to be created.
- Note: Index Mass-profiling will process up to 24 attributes when a field template is added to an existing report.
- Repeat steps 1-2 until all profiling attributes have been analysed
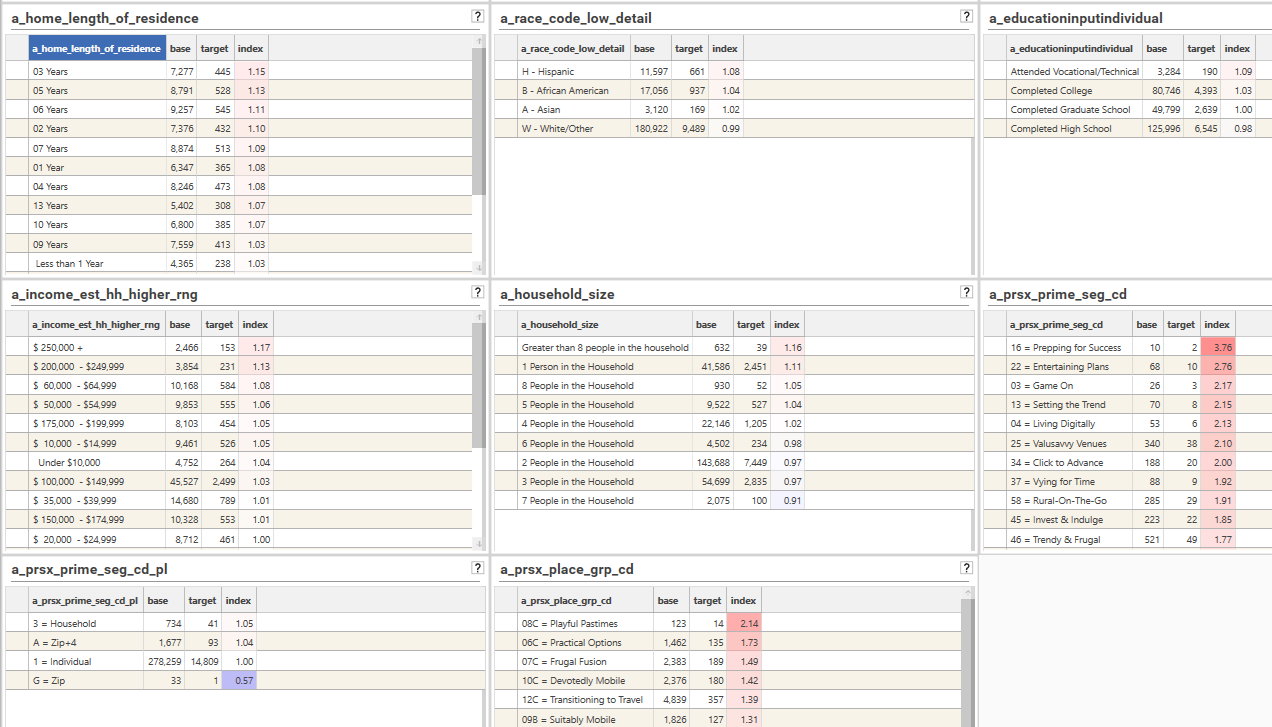
The following shows a typical Index Profile Dashboard:
Step 3d - Threshold Analysis - Inspect dashboard and identify potential targets
Once a dashboard has been created, the next step is to identify the attribute/value combinations that stand out as being potentially good predictors of the desired population - in this example, potentially "promising" customers. Typically the end goal is to identify somewhere between 3 - 10 attributes, or 5 - 30 datasets (or segments) that will be used later in segment analysis.
At this stage we are looking for attributes that have meaningful over (or possibly under)-indexing. However, as indicated above, index scores can be heavily skewed if either the target or base counts are very small, and so this needs to be taken into account.
The following are possible mechanisms for this kind of analysis:
- Manual Selection - Manually inspect the Multi-Index Dashboard and make a note of fields that look like they will be worth exploring further using the composite index feature of the Index Profile Report (this feature allows for intersections of attribute values to be assessed.)
- Thresholds - Apply a secondary Process (or Model) to the Sample Index Report that filters on index, base and/or target thresholds. This will generate a Multi-Index dashboard that automatically removes rows that are below the specified threshold for counts and index ratios.
- Helper Function - Use the "CreateCollectionFromProcess" option (or scripting method) as well as a secondary process to automatically select fields or field-values that meet specified threshold criteria for base, target and index and add them to a dataset collection.
Manual Selection
Visually inspect the available Multi-Index Dashboards to identify fields/attributes that are over-indexing in a statistically significant way in one or more attributes.
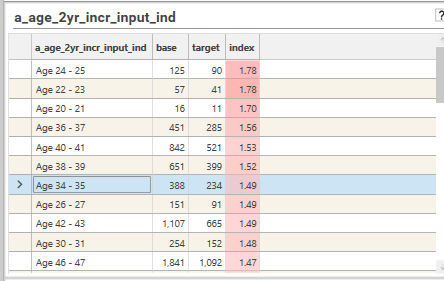
For example, in the image below it can be seen that Age 24-25 has a large over-index at 1.78. However, this is from a very small number of base and target records, and so likely is not significant. However, age 42-43, with an index of 1.49, having > 1000 records in the base population, and > 500 in the target, is a more likely indication of a genuine trend in the data. We also see a similar over-index for age range 46-47, and so now it begins to look as if age greater than 40 could be a reasonable indicator of belonging to the "Promising" segmentation. This could indicate that older individuals are more likely to fall into the "Promising" category (e.g., higher engagement or value)
A Dataset Collection of field/values of interest can be created:
- Select Project Explorer | Dataset | Dataset Collection tab
- Right-click and choose Create Dataset
- Drag segments of interest from the dashboard and add them to the collection, modifying names as needed.
- Save the collection (as "client-targets-of-interest")
A Field Template of attributes of potential interest can be created:
- Select Project Explorer | Templates tab
- Open the field template that was used to create the Multi-Index dashboard
- Rename template to "client-potential-interest"
- Open the Multi-Index dashboard and visually inspect.
- Remove from the field template any fields that do not need to be studied further
- Save template
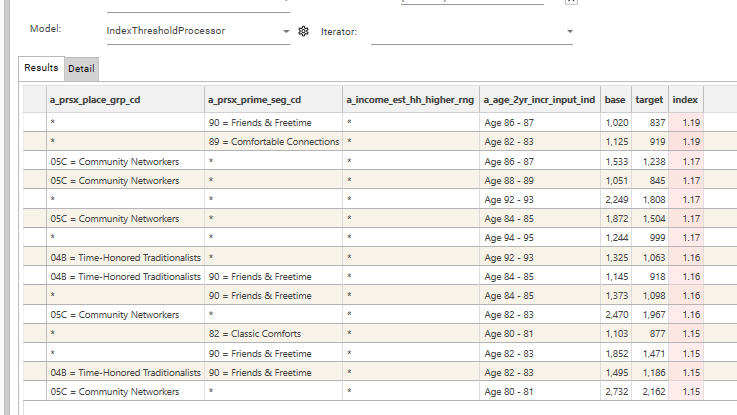
Thresholds
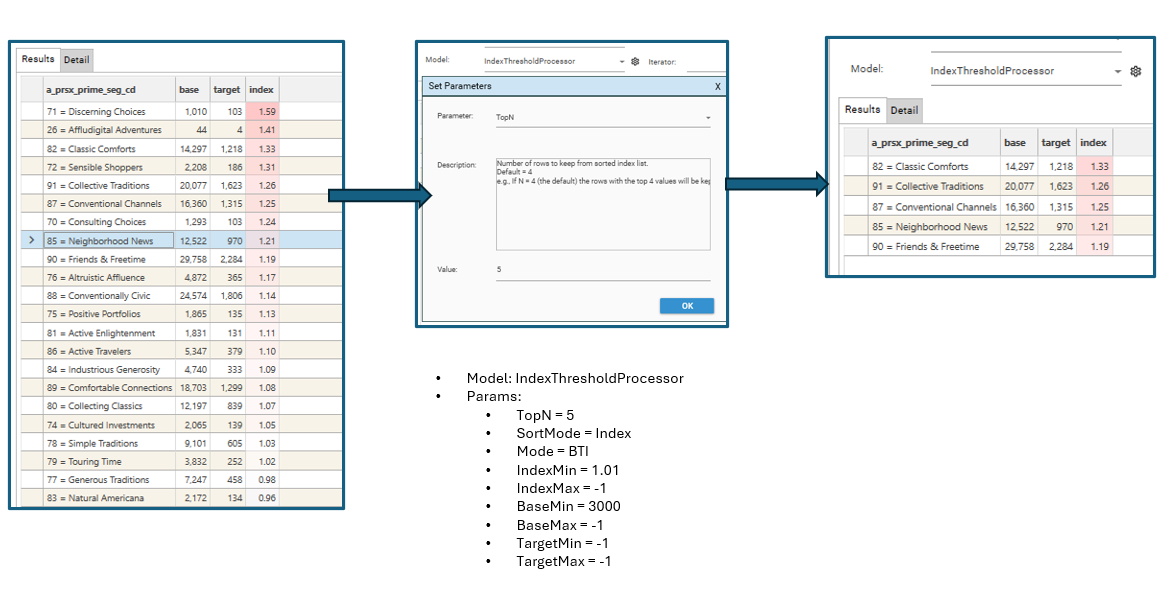
By default an "IndexThresholdProcessor" secondaryProcess is available for use with the Index Profile report. This runs after each individual profile, and filters the results according to threshold criteria. For example, it can be set to do the following:
- drop all rows where the Index < 1.0, and the Base Count is < 1000
- sort by Index Descending
- Keep top 5 values
To set up such a process, select the "IndexThresholdProcessor" model in the model drop-down in the Index Profile report and set up the required parameters:
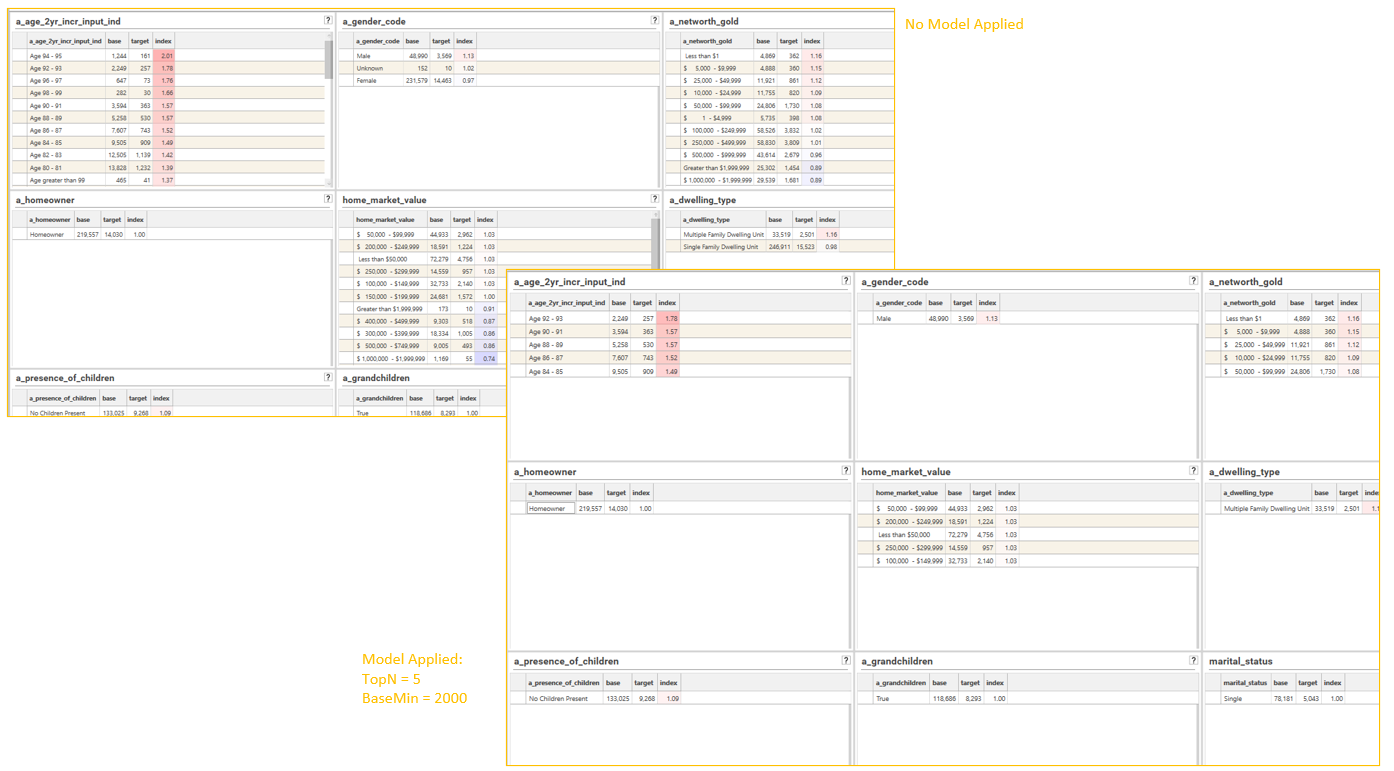
Once the sample index profile has been set up, drop the Field Template containing the list of profiling fields onto the report and select "3 Column Dashboard" in order to generate the filtered multi-index dashboard:
Alternatively, add an IProfile method to script and add the secondaryProcess{} object to the method:
"secondaryProcess": {
    "snippet": "IndexThresholdProcessor",
    "language": "python",
   "parameters": [
      {
        "name": "TopN",
        "value": "10",
        "description": "Number of rows to keep from sorted index list.\r\nDefault = 4\r\ne.g., If N = 4 (the default) the rows with the top 4 values will be kept.   (Note - data sorted by column specfied in SortMode)"
      },
      {
        "name": "SortMode",
        "value": "Index",
        "description": "Can be Base, Target or Index.  Default = Index"
      },
      {
        "name": "Mode",
        "value": "BTI",
        "description": "Specifies which thresholds (if any) to apply\r\nB = Base\r\nT = Target\r\nI = Index\r\nALL = Base, target and Index\r\nAny combination of BTI is allowed.\r\nDefault = BTI"
      },
      {
        "name": "IndexMin",
        "value": "-1",
        "description": "Optional. Minimum Index threshold if filtering index values (see Mode for details).\r\nDefault = -1 (no threshold)"
      },
      {
        "name": "IndexMax",
        "value": "-1",
        "description": "Optional. Maximum Index threshold if filtering index values (see Mode for details).\r\nDefault = -1 (no threshold)"
      },
      {
        "name": "BaseMin",
        "value": "5000",
        "description": "Optional. Minimum Base threshold if filtering Base values (see Mode for details).\r\nDefault = -1 (no threshold)"
      },
      {
        "name": "BaseMax",
        "value": "-1",
        "description": "Optional. Maximum Index threshold if filtering Base values (see Mode for details).\r\nDefault = -1 (no threshold)"
      },
      {
        "name": "TargetMin",
        "value": "-1",
        "description": "Optional. Minimum Target threshold if filtering target values (see Mode for details).\r\nDefault = -1 (no threshold)"
      },
      {
        "name": "TargetMax",
        "value": "-1",
        "description": "Optional. Minimum Target threshold if filtering target values (see Mode for details).\r\nDefault = -1 (no threshold)"
      }
    ]
}Automated Collections
It is also possible to repeat the index profile for multiple fields and extract the rows that meet the threshold criteria into a dataset collection by using the CreateCollectionFromProcess method. This process does the following:
- Creates an index profile object
- Applies a secondary Process to process results
- Selects a field from the foreach iteration list
- Calculates report and adds output to a dataset collection
- Repeats steps 3-4 for each field in the foreach iteration list.
{
  "method": "CreateCollectionFromProcess",
  "name": "client-potential-interest-targets",
  "process": {
    "method": "IProfile",
    "includeEmptyIndexTargetRows": false,
    "displayPrecision": 2,
    "sortMode": 4,
    "sortColumn": 2,
    "field": "<<FLD>>"
  },
  "foreach": {
    "variable": "<<FLD>>",
    "in": {
      "template": "client_profile_standard"
    }
  },
  "secondaryProcess": {
    "snippet": "IndexThresholdProcessor",
    "language": "python",
    "parameters": [
      {
        "name": "TopN",
        "value": "5",
        "description": "Number of rows to keep from sorted index list.\r\nDefault = 4\r\ne.g., If N = 4 (the default) the rows with the top 4 values will be kept.   (Note - data sorted by column specfied in SortMode)"
      },
      {
        "name": "SortMode",
        "value": "",
        "description": "Can be Base, Target or Index.  Default = Index"
      },
      {
        "name": "Mode",
        "value": "",
        "description": "Specifies which thresholds (if any) to apply\r\nB = Base\r\nT = Target\r\nI = Index\r\nALL = Base, target and Index\r\nAny combination of BTI is allowed.\r\nDefault = BTI"
      },
      {
        "name": "IndexMin",
        "value": "",
        "description": "Optional. Minimum Index threshold if filtering index values (see Mode for details).\r\nDefault = -1 (no threshold)"
      },
      {
        "name": "IndexMax",
        "value": "",
        "description": "Optional. Maximum Index threshold if filtering index values (see Mode for details).\r\nDefault = -1 (no threshold)"
      },
      {
        "name": "BaseMin",
        "value": "2000",
        "description": "Optional. Minimum Base threshold if filtering Base values (see Mode for details).\r\nDefault = -1 (no threshold)"
      },
      {
        "name": "BaseMax",
        "value": "",
        "description": "Optional. Maximum Index threshold if filtering Base values (see Mode for details).\r\nDefault = -1 (no threshold)"
      },
      {
        "name": "TargetMin",
        "value": "500",
        "description": "Optional. Minimum Target threshold if filtering target values (see Mode for details).\r\nDefault = -1 (no threshold)"
      },
      {
        "name": "TargetMax",
        "value": "",
        "description": "Optional. Minimum Target threshold if filtering target values (see Mode for details).\r\nDefault = -1 (no threshold)"
      }
    ]
  },
  "dataSet": {
    "logic": "or",
    "name": "Index Profile Base Filter_1",
    "strict": true,
    "set": [
      {
        "logic": "and",
        "stype": "FIELD",
        "entity": {
          "type": "field",
          "name": "Client_XXX.Index Profile Base Filter",
          "table": "Client_XXX",
          "valueFilter": []
        },
        "op": "=",
        "values": [
          "1"
        ]
      }
    ]
  },
  "project": "WOKFLOW_AudienceCreation"
}
When a dataset collection is created using CreateCollectionFromProcess, the criteria used to create the collection are available from the "View Model" option:
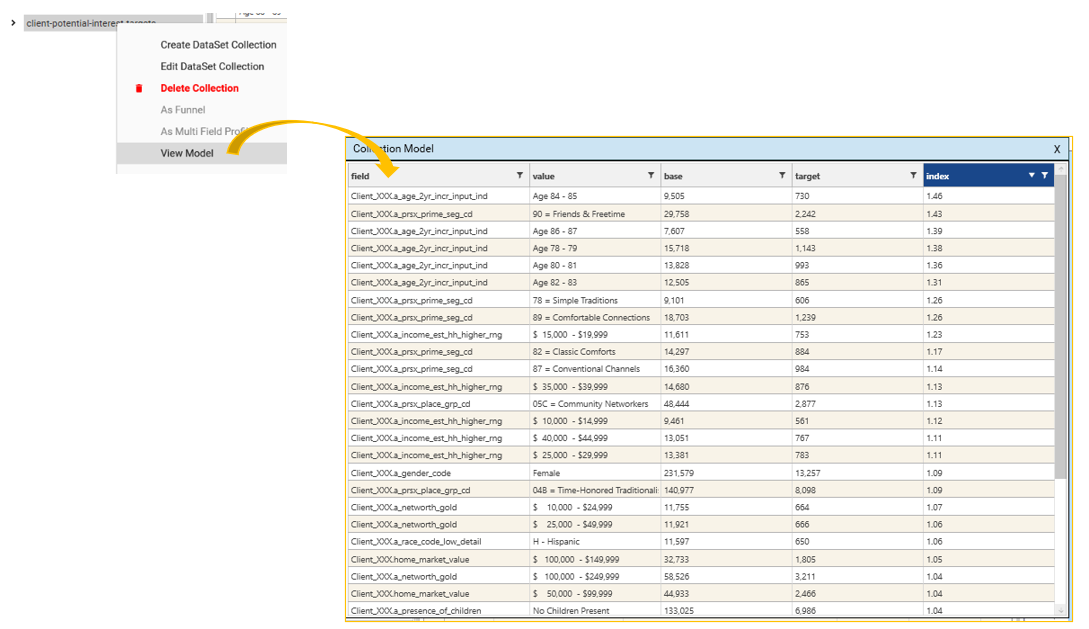
- ExportModelIntoTable - will create a datajet table
- ExportModelToExcel - will create an excel workbook
- SaveModel - will make the model available in the Data Table Viewer
Step 3e - Repeat for different Target Datasets
Depending on the output from the previous stages, Steps 4a - 4d can be repeated multiple times with different target filters.
The following is the JSON for a basic Index profile with Secondary Process Attached
{
  "method": "IProfile",
  "project": "WOKFLOW_AudienceCreation",
  "sortMode": 4,
  "sortColumn": 2,
  "field": "Client_XXX.a_prsx_place_grp_cd",
  "secondaryProcess": {
    "snippet": "IndexThresholdProcessor"
  },
  "dataSet": {
    "logic": "or",
    "name": "SubSet",
    "strict": true,
    "set": [
      {
        "logic": "or",
        "stype": "TABLE",
        "entity": "Client_XXX"
      },
      {
        "logic": "and",
        "stype": "FIELD",
        "entity": {
          "type": "field",
          "name": "Client_XXX.Index Profile Base Filter",
          "table": "Client_XXX",
          "valueFilter": []
        },
        "op": "=",
        "values": [
          "1"
        ]
      }
    ]
  }
}
{TODO: When Target Dashboard feature is available, update this section}
The process of evaluating different targets for use in the Multi Index Dashboard can be automated using dataset collections.
- Create a Dataset collection of targets - e.g., Customer Segments
- Open either <Base Index Profile> or <Threshold Index Profile>
- Select "Customer Segments" collection in the iterator drop-down
- Calculate report.
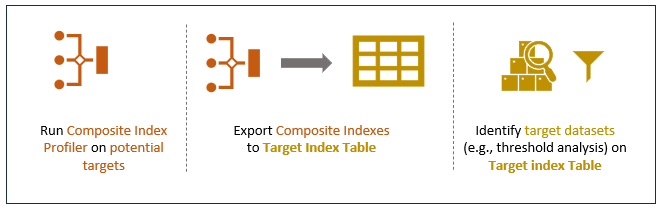
4. Run Composite Index Profile on targets of interest
Once the initial pre-processing of profiling attributes is complete, a composite index profile can be run to see if there are any promising combinations of attributes. While individual attributes might show some over-indexing, combining them into composite attributes can reveal powerful synergies. These combinations can result in segments that over-index significantly higher than any single attribute alone, pinpointing concentrated and potentially valuable pockets of a target population for more precise engagement strategies.
At the end of this step, the following will be available:
- Composite Index Profile Report
- Target Index Table
Step 4a. Create Composite Index Profile Report
- Open the Index Profile report
- Turn OFF auto-calc
- Add a dimension from the "client-potential-interest" field template created earlier (see step 3)
- Add a target filter by dropping a target dataset onto the result grid
- Sort by Index
- Add the remaining fields from the "client-potential-interest" field template. (NOTE - There is a limit on the number of fields that can be added which depends on the number of discrete values in each field and how the intersections of the fields compresses down)
- Calculate the report - this may take ~5 mins depending on the number of fields that have been added
- Save the report (e.g. "client-comp-potential-interest")
Step 4b. Apply thresholds and filters
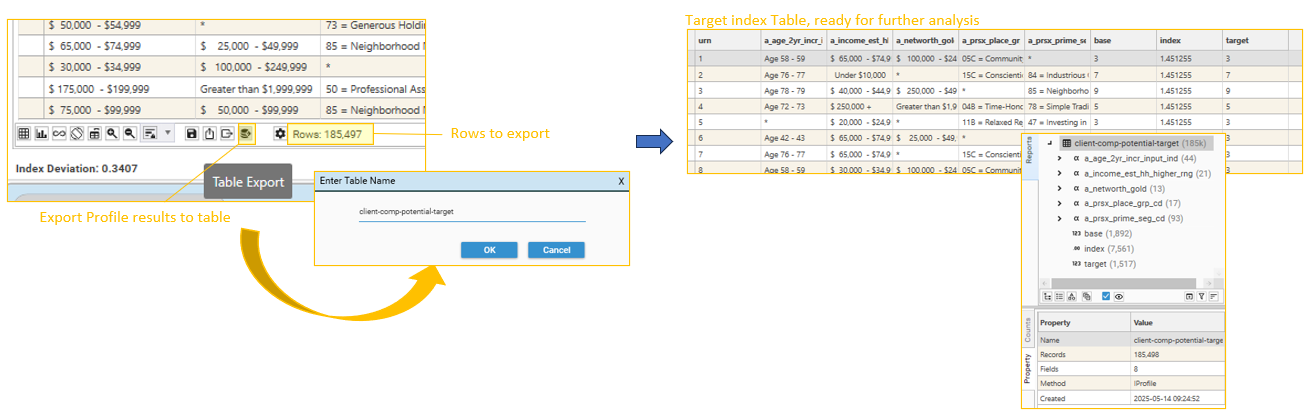
Export to Target Table
Exporting the results of the composite index profile allows fields to be engineered and queries to be constructed that help in the identification of useful field/attribute combinations. Use the Index Profile report's "Export To Table" option to create a target index table (e.g., "client-composite-potential"). This may take a minute or two, depending on the number of rows in the composite index result set.
Apply a secondary Process
Alternatively, use the IndexThresholdProcessor model to apply thresholds and sort modes to the result set.
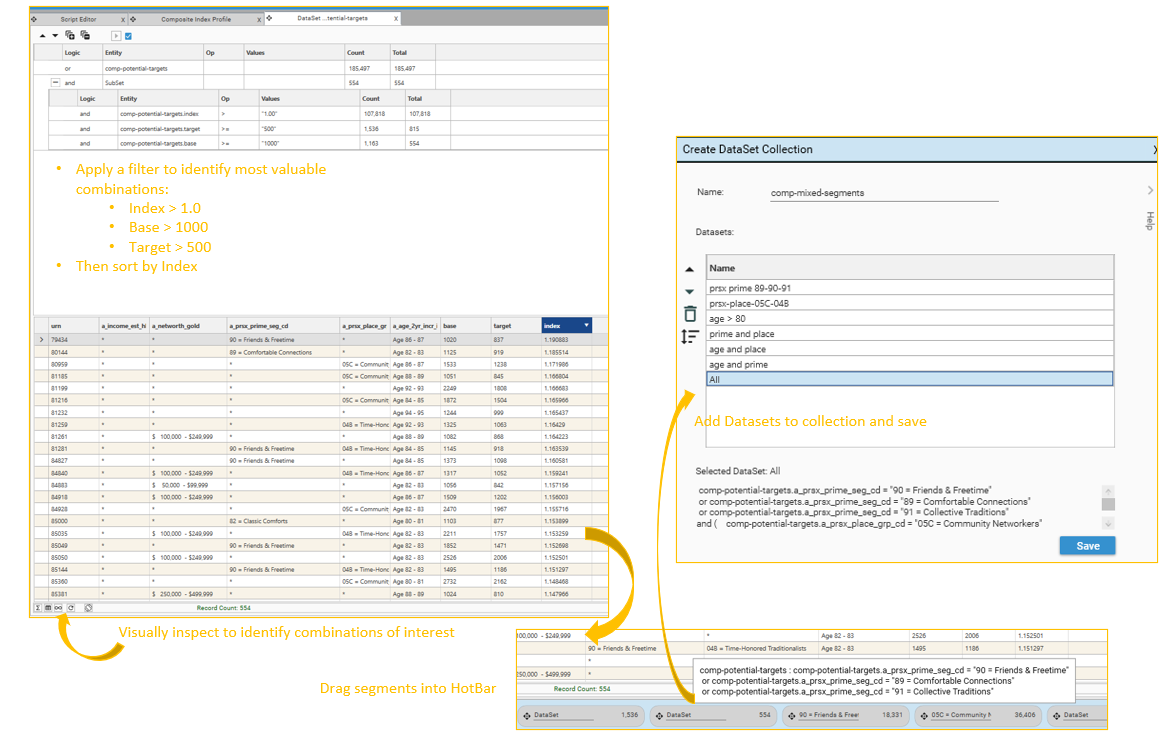
Step 4c - Create Dataset Collection(s) of selected composite targets
A Composite Index Profile will usually produce many rows that contain a very small number of base or target records - these combinations are unlikely to be useful for further analysis. Use queries and profiles to identify rows on the Target index Table (e.g., "client-comp-potential-target" that are worth pursuing.
Create Queries
- Create a query of Base > X, where X is the minimum number of records the base population should contain
- Create a query of Target > Y, where Y is the minimum number of records the target population should contain
- Create a query of Index > Z, where Z is the minimum index score that should be considered.
- Drop these queries onto a dataview of the table, and identify field/attribute combinations that look promising
- Expression Builder
- Engineering | Functions
- User Defined Fields
5 Create Target Dataset Collection on Primary Contact Table
Before basic segment analysis can be run on the Primary Contact Table, target datasets need to be defined on that table. This can be done:
- individually
- using dataset collections
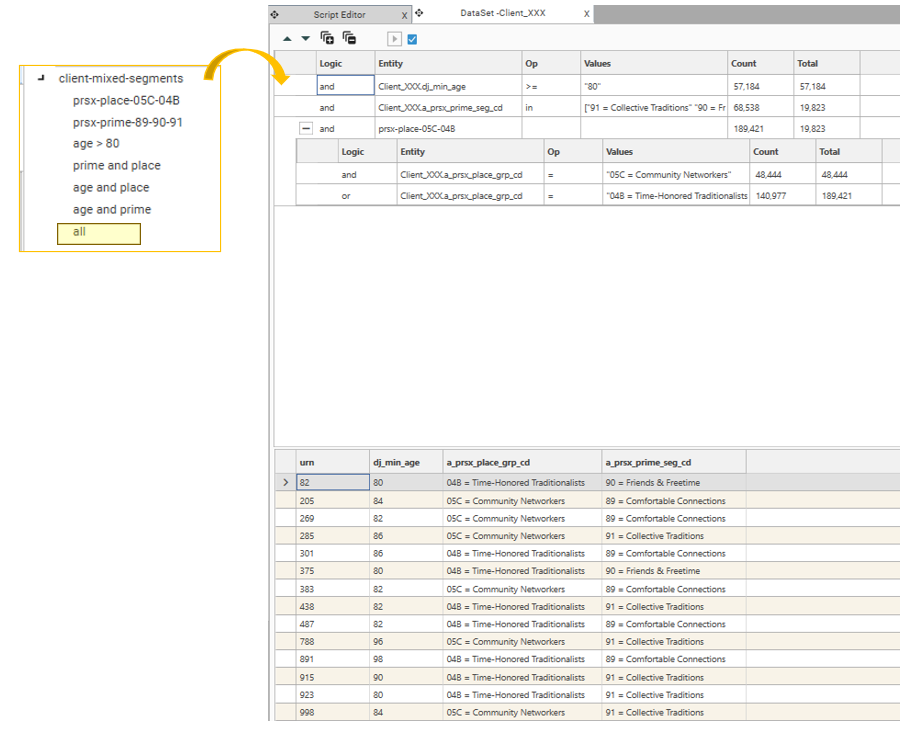
Step 5a - Inspect Source Data
Begin by inspecting the Client Table. Take the dataset collection of mixed field-value combinations identified on the composite index table, and copy it to the client table.
This can be done in script using the TranslateDatasetCollection method:
{
  "method": "TranslateDataSetCollection",
  "source": "client-5way-combined-datasets",
  "name": "eye-5way-combined-datasets",
  "fromTable": "Client_XXX",
  "toTable": "DATA_EYE_FULL",
  "overwrite": true,
  "project": "WORKFLOW_AudienceCreation"
}Confirm that the datasets in the collection are valid.
This stage of the workflow is now complete.
Possible Next Steps:
Basic Segment analysis