Overview
The Segment Correlation feature allows calculation of overlaps and indexes for segments and datasets on the campaign segmentation data, in order to identify characteristics of interest for further investigation and modeling.
This article explains how to setup the AnalyseSegments method in Script Editor.
The Data
The dataset comprise approximately 230 billion records (representing roughly 1 billion unique IDs distributed across ~1800 segments). These data are stored in the campaign segmentation system, which is specially designed to handle this volume. The data can be linked to other datasets via the Allant keying system.
The Purpose
The algorithm analyses a baseline dataset (optionally the BASE, if not, the UNIVERSE) and one or more target datasets (the TARGETS) across specified segments of interest. The analysis focuses on overlaps between these groups, specifically identifying IDs present in various combinations. Consider the following example:
- UNIVERSE: All Customers
- BASE: Website Visitors (last month)
- TARGETS:
- Target 1: Premium Travel Insurance Purchasers (last 3 months)
- Target 2: Opened Asian Travel Email
- SEGMENTS:
- Segment 1: Interested in Asia Travel
- Segment 2: Interested in Family Holidays
- Segment 3: Interested in RVs
Example Calculations and Insights:
- Segment 1 (Asia Travel) AND BASE (Website Visitors): = # of website visitors interested in Asia. Insight: How much Asian travel content to prioritize.
- Segment 1 (Asia Travel) AND TARGET 1 (Insurance Purchasers): = # of Asia-interested customers who bought insurance. Insight: How likely Asia travellers are to buy insurance.
- Segment 1 (Asia Travel) AND BASE (Website Visitors) AND TARGET 2 (Opened Asian Email): = # of Asia-interested visitors who opened the Asia email. Insight: Email campaign effectiveness for this segment.
- Segment 2 (Family Holidays) AND BASE (Website Visitors): = # of website visitors interested in family Holidays. Insight: How much family holiday content to prioritize.
- Segment 2 (Family Holidays) AND TARGET 1 (Insurance Purchasers): = # of family-holiday interested customers who bought insurance. Insight: Propensity of families to purchase travel insurance.
- Segment 3 (RVs) AND TARGET 2 (Opened Asian Email): = # of RV enthusiasts who opened the Asian travel email. Insight: May indicate Asian Travel email is not relevant for RV enthusiasts.
Index Calculation - New **
An Index is calculated for each segment of interest to compare its prevalence within a TARGET population relative to its prevalence within the BASE population.
Calculation:
Index = (Proportion of TARGET population in the segment) / (Proportion of BASE population in the segment)
Mathematically:
Index = (|Segment ∩ Target| / |Target|) / (|Segment ∩ Base| / |Base|) (Where |X| denotes the count of unique IDs in set X, and ∩ denotes the intersection)
Interpretation:
- An Index greater than 1 indicates the segment is more prevalent (over-represented) in the TARGET population compared to the BASE population.
- An Index less than 1 indicates the segment is less prevalent (under-represented) in the TARGET population compared to the BASE population.
- An Index equal to 1 indicates the segment has the same prevalence in both the TARGET and BASE populations.
Example:
Scenario: Customer Segmentation for Marketing (Travel)
- BASE: Website Visitors (last month)
- TARGET: Premium Travel Insurance Purchasers (last 3 months)
- Segment 1: Interested in Asia Travel
Over-Indexed
If Segment 1 (Asia Travel) has an index of 1.5, it means customers interested in Asian Travel are 50% more likely to purchase Premium Travel Insurance (TARGET) compared to their proportion among all Website Visitors (BASE). Insight: Indicates Asian Travelers are a very promising market for travel Insurance
Under-Indexed
If Segment 1 (Asia Travel) has an index of 0.7, it means customers interested in Asian Travel are 30% less likely to purchase Premium Travel Insurance (TARGET) compared to their proportion among all Website Visitors (BASE). Insight: Indicates that marketing spending on Asian Travel customers for travel insurance may be inefficient compared to targeting another market.
Function Overview
{TODO: Video clip}
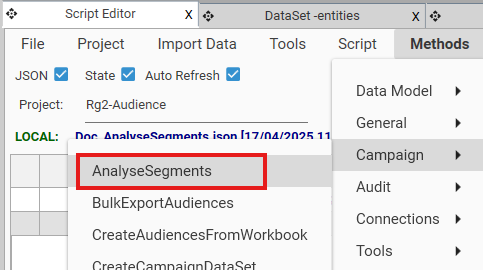
A blank AnalyseSegments method can be added to script from Script Editor | Methods | Campaign | AnalyseSegments:
{
  "method": "AnalyseSegments",
  "project": "",
  "dataSet": {},
  "targetDataSets": [],
  "workbook": "",
  "lowerLimit": 0,
  "upperLimit": 0,
  "table": "",
  "mode": "",
  "segments": []
}
Setup
Output Format
At least one of the following must be included:
- table - saves results to table of specified name. The generated table will be available in the Project Explorer.
- NOTE: Tables are not "hot" - selecting from a cell in this table will simply select the cell record.
- workbook - saves results to workbook of specified name. If no path is specified, the generated workbook will be available in the team output folder.
- saveAs - saves results to Data Table of specified name {TODO: Confirm this is allowed if outputting to table}. The generated data table will be available in the Data Table Viewer.
- NOTE: Data Tables are hot - selecting a cell will select the underlying records for that cell.
"workbook": "Doc_AS1.xlsx",
"table": "Doc_AS1",
"saveAs": "Doc_AS1",
Target Dataset(s)
At least one target dataset must be specified in order for the calculation to run. There are multiple ways to add target datasets:
- Single Dataset - Drag and drop a dataset onto the AnalyseSegments JSON window. Choose "Append to target dataSets". This can be repeated as many times as necessary.
- Dataset Collection- Create a dataset collection and drop the collection onto the AnalyseSegments JSON window. Select one of the following:
- Replace Target DataSets - replaces any existing target datasets with the dropped collection
- Append to Target DataSets - adds dataset collection to existing target dataset list
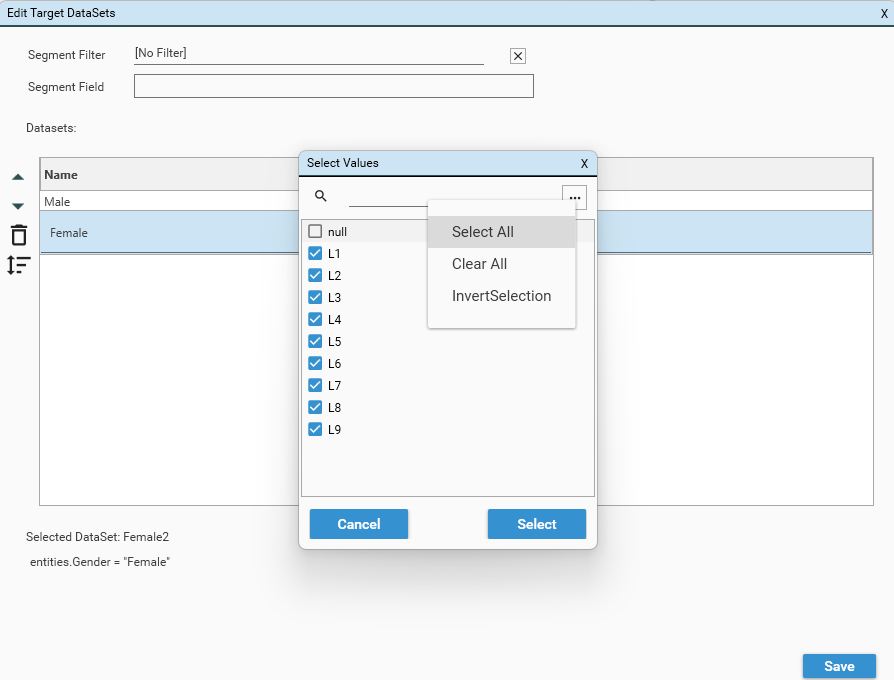
- Dataset Helper Wizard - Right click in the AnalyseSegments JSON window and choose "Manage Datasets"
- Drag and drop:
- individual datasets,
- fields,
- dataset collections
- Rename datasets
- Change dataset orders
- Delete Datasets
- Click Save to apply changes to the script.
- Drag and drop:
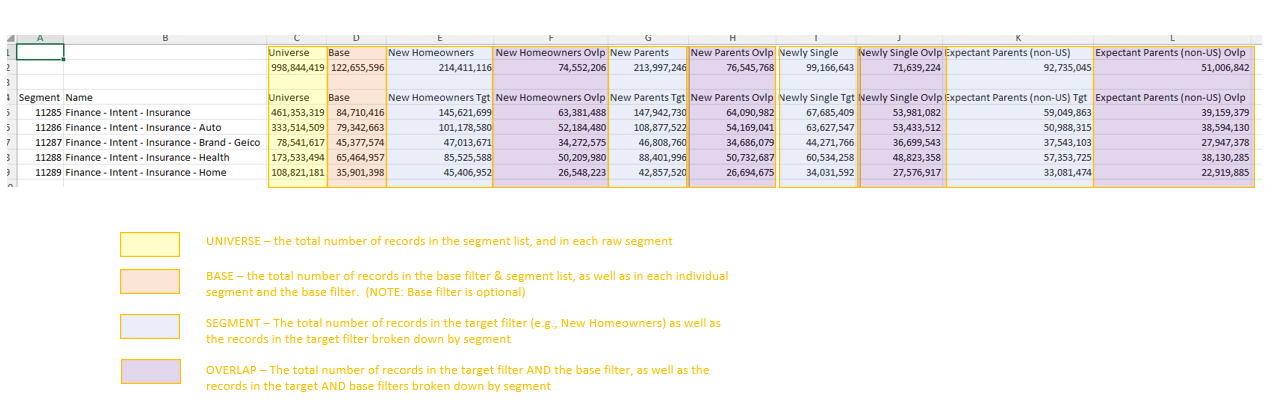
With at least one output format (table/saveAs/workbook) and at least one target dataset specified, the calculation is now ready to be executed. Depending on the output format, one of the following will be produced:
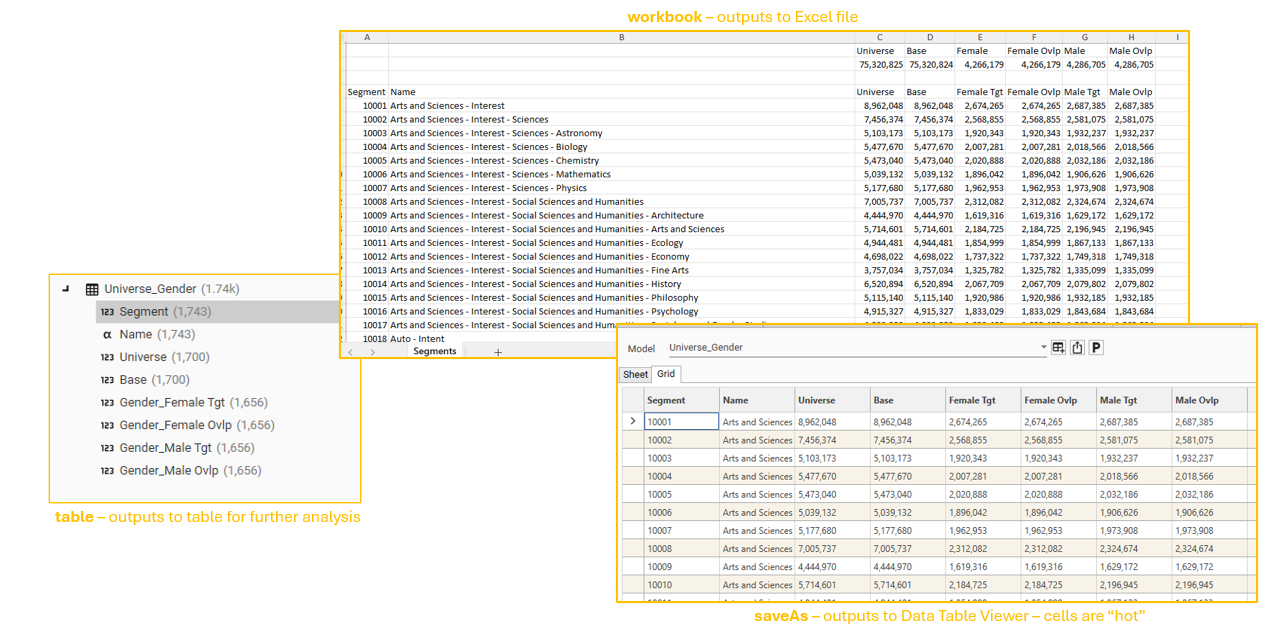
- All segments are included
- Base is equal to universe because no base dataset has been specified
- 2 columns are produced for each target dataset: Tgt and Ovlp
- Tgt - total number of records in the target dataset
- Ovlp - total number of records in the target dataset AND the base filter
Segments to Analyse
By default, when AnalyseSegments is run, all segments (e.g., segments 1 to 1800) are included. If required, the set of segments can be reduced using one of the following:
- segment[] - A list of segment IDs
- segmentFilter{} - A query that returns a list of segment IDs
Option 1: segment[] - lists of segment IDs can be generated in the following ways:
- Manual Editing
- Manually enter segment IDs into segment[] array by editing AnalyseSegments JSON method
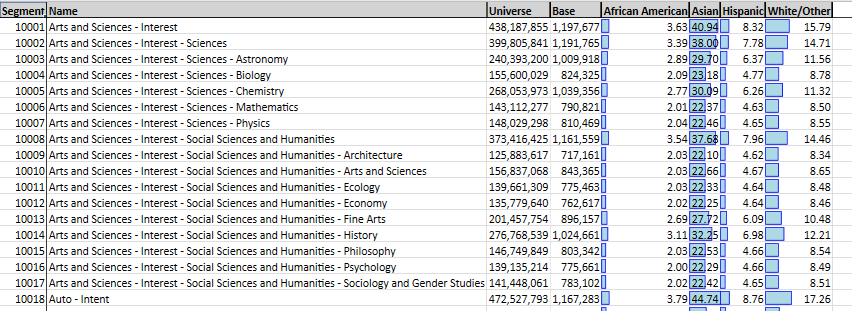
- Generate Segment List
- Open Campaign | Audiences
- Put Campaign report into selector mode
- Use Campaign | Audiences report to build a set of segments.
- Copy segment IDs to the clipboard using the "copy to clipboard" option
- Paste segment IDs into segment[] array
 "segments": [
    10117
  ],
"segments": [
11289,
11288,
11287,
11286,
11285
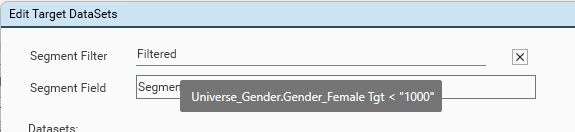
],Option 2: segmentFilter{} - queries that generate a list of segment IDs can be created from previous output from AnalyseSegments
- For example, in output table Universe_Gender (see above), select records where Gender_Female Tgt Count is less than 1000
- Drag field Gender_Female Tgt to the hotbar
- Select operator < and specify value 1000
- Right-click in AnalyseSegments JSON window and choose Manage datasets
- Drag the {Gender_Female Tgt < 1000} dataset onto the Segment Filter input
- Specify the name of the segment field in the source table (Universe_Gender) - usually "Table.Segment"
- Click save.
 "segmentFilter": {
    "field": "Universe.Segment",
    "dataSet": {
      "logic": "or",
      "name": "DataSet",
      "strict": true,
      "set": [
        {
          "logic": "and",
          "stype": "FIELD",
          "entity": {
            "type": "field",
            "name": "Universe_Gender.Gender_Female Tgt",
            "table": "Universe_Gender",
            "valueFilter": []
          },
          "op": "<",
          "values": [
            "1000"
          ]
        }
      ]
    }
}ambiguous field name
segmentFilter field not found
Example
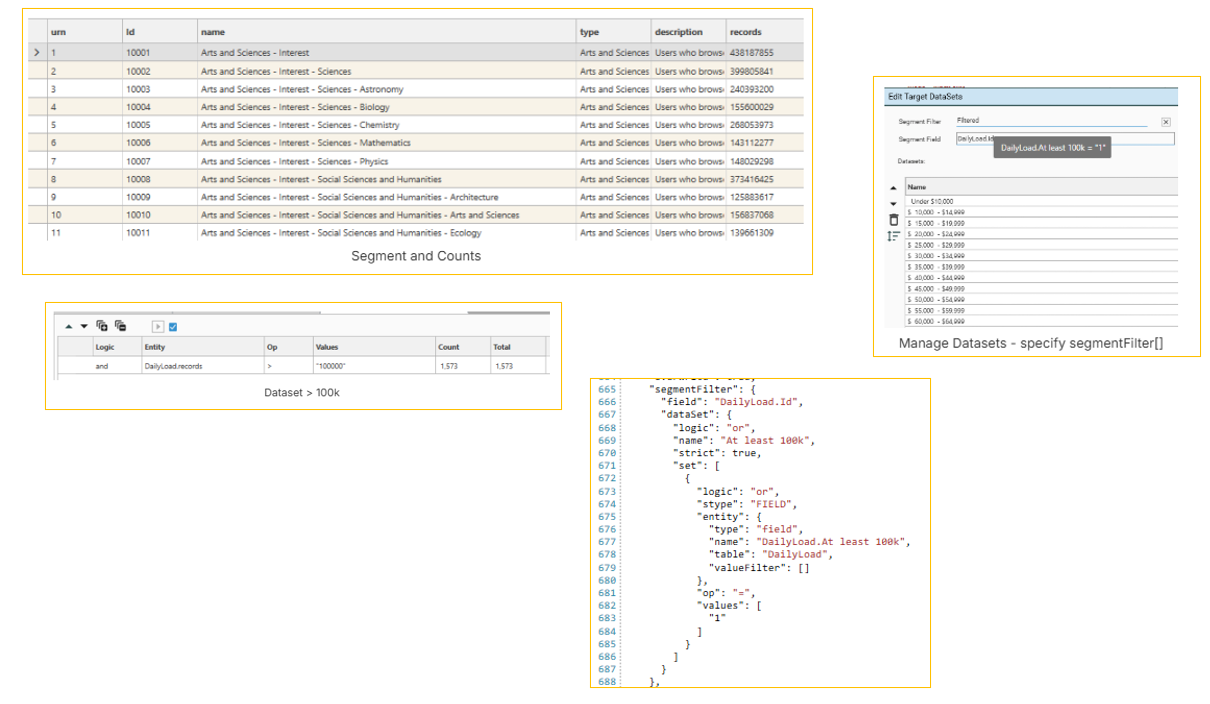
A common scenario is to remove segments which do not contain sufficient base counts to generate meaningful analysis. For example, segments 10216 - 10220, 10223, 10234 and 10226-10234 do not contain enough counts to make a target analysis possible.
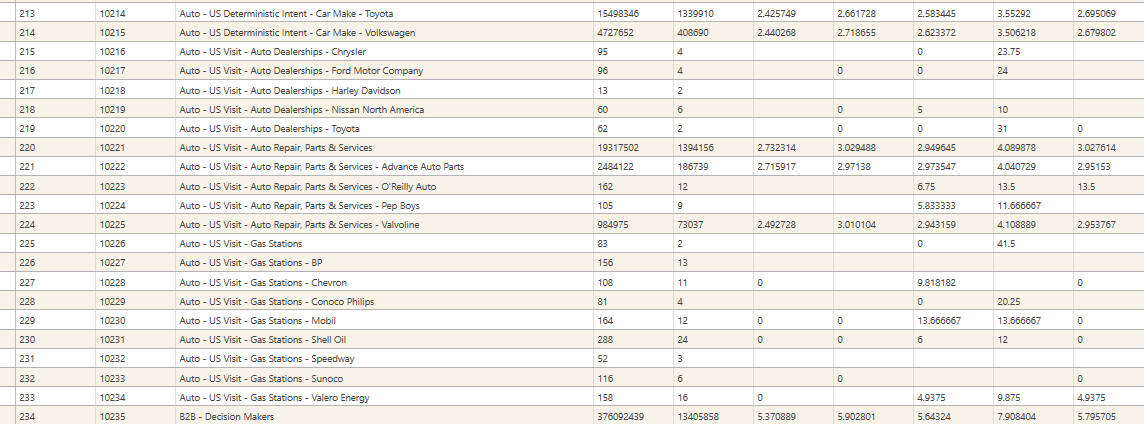
The following process & script makes sure only segments that have a minimum of 100,000 records are included.
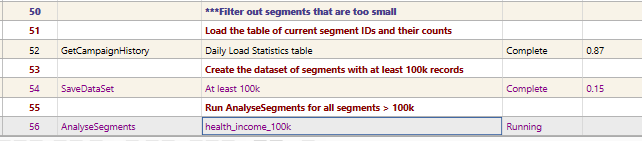
- GetCampaignHistory - load details of segments and their counts into a table
- SaveDataSet - create a dataset of segments with >100k records
- AnalyseSegments - specify {>100k} dataset as a segmentFilter[], and run
Base Dataset
The base dataset is optional. A typical base dataset might be "Campaign Responders" or "High Value Customers".
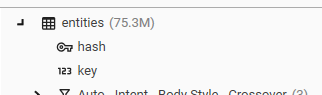
If no base dataset is specified, the calculation will be run against the full PRIMARY CONTACT TABLE. This is the UNIVERSE and is usually a table named "DATA_EYE_xxx" or "entities"
To specify a base dataset:
- Drag a single dataset from the HotBar or Project Explorer
- Drop onto the JSON window of the AnalyseSegments method.
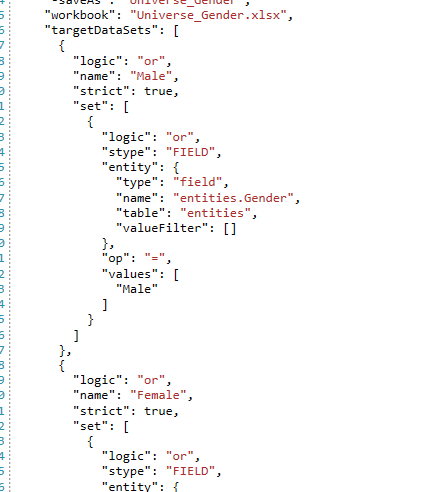
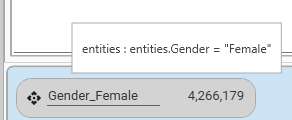
- A popup menu will appear - select "Replace dataSet".
- The dataset definition will be added to the "dataset" element.
This means only segment records identified as belonging to the "Female" category will be included in the calculation.
Editing the base dataset
- To remove the base dataset, right-click in the JSON window and choose "Remove Dataset"
- To replace the base dataset, drop a new dataset into the JSON window and choose "Replace dataSet"
  "dataSet": {
    "logic": "or",
    "name": "Gender_Female",
    "strict": true,
    "set": [
      {
        "logic": "and",
        "stype": "FIELD",
        "entity": {
          "type": "field",
          "name": "entities.Gender",
          "table": "entities",
          "valueFilter": []
        },
        "op": "=",
        "values": [
          "Female"
        ]
      }
    ]
  },
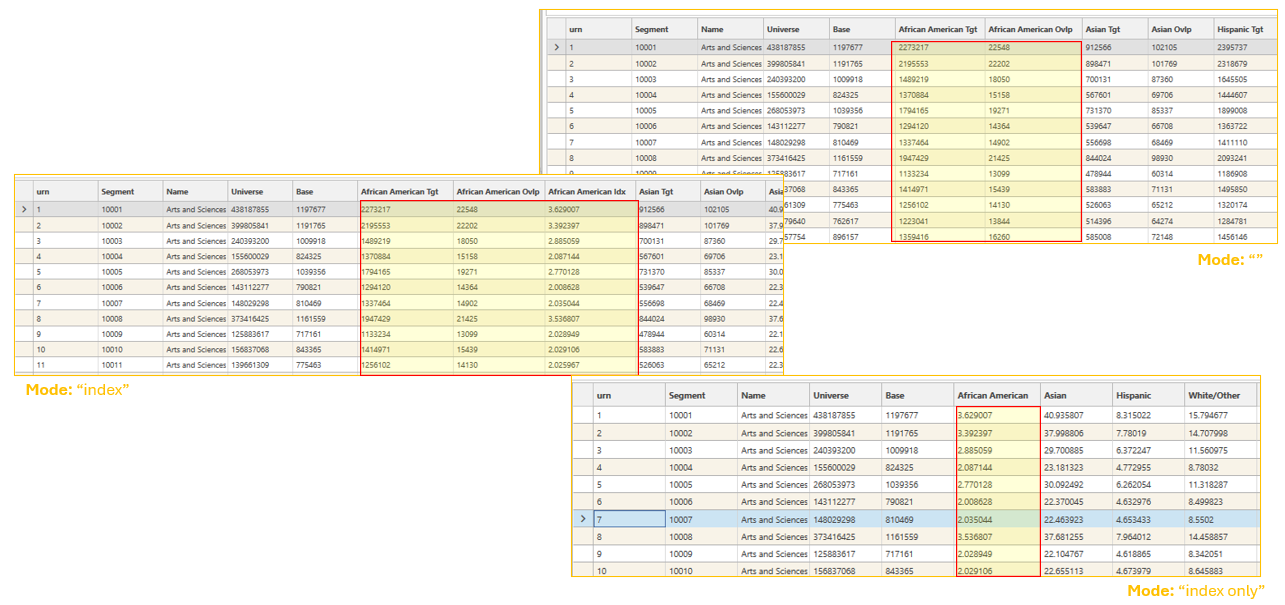
Execution Mode
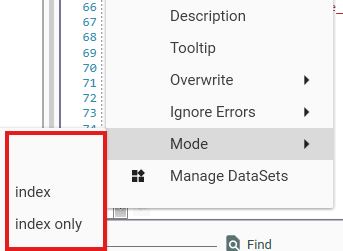
Execution mode determines what is output. 3 options are available:
- default ("", empty string, or missing): - Target Counts, Overlap Counts for each target dataset
- index ("index"): - Target Counts, Overlap Counts, Index for each target dataset
- index only ("index only"): - Index for each target dataset
To set the Execution mode, right-click in the AnalyseSegments JSON window and use the mode options:
Output
Results Filters
lowerlimit
An optional lower limit can be specified which will filter the results that are returned by AnalyseSegments.
If lowerlimit is present and non-zero (i.e., value N), segments with counts fewer than N in the base dataset will not be included in the Analysis output.
upperlimit
An optional upper limit can be specified which will filter the results that are returned by AnalyseSegments.
If upperlimit is present and non-zero (i.e., value N), segments with counts greater than N in the base dataset will not be included in the Analysis output.
{
  "method": "AnalyseSegments",
  "lowerLimit": 750000,
  "upperLimit": 1000000,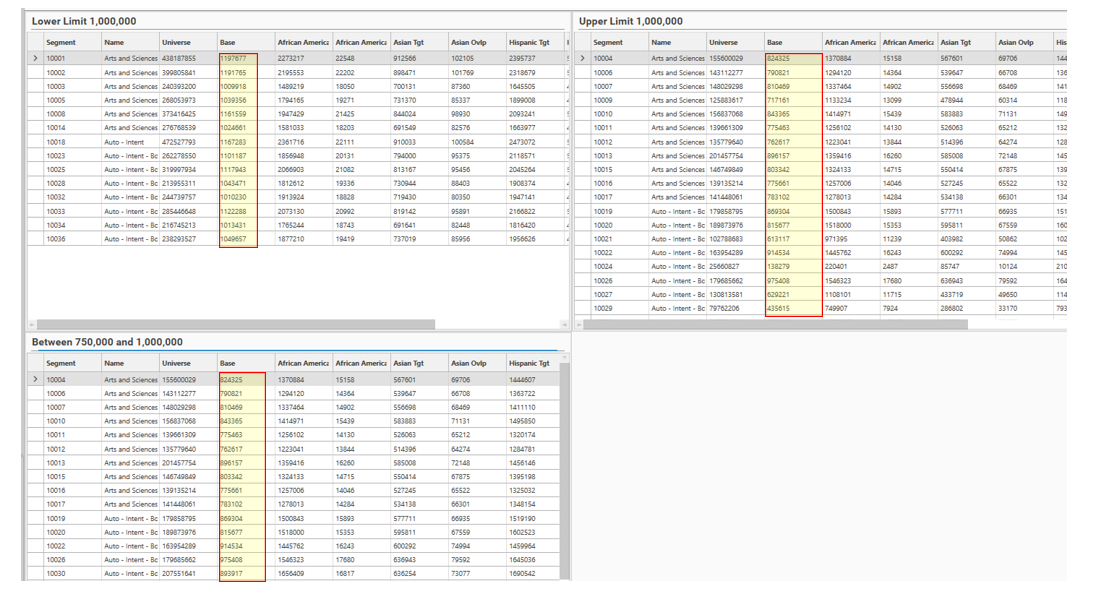
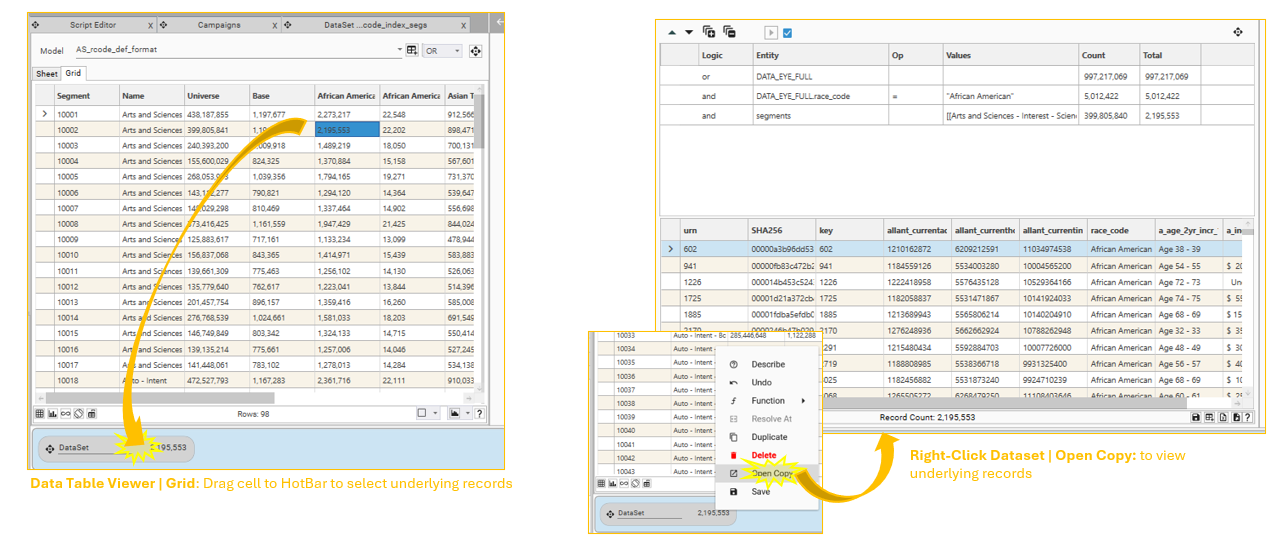
Data Table Viewer
Results can be output as Data Tables, which are then viewable in the Reporting | Data Table Viewer. (See Data Table Viewer for details)
To output results as data-tables, include the "saveAs" key:
{ "method": "AnalyseSegments", "workbook": "AS_rcode_def_format.xlsx", "lowerLimit": 0, "upperLimit": 0, "saveAs": "AS_rcode_def_format", "table": "AS_rcode_def_format", "mode": "", "description": "AS_rcode_def_format",Use the Data Table Viewer to select underlying records for a particular cell:
Results Formatting
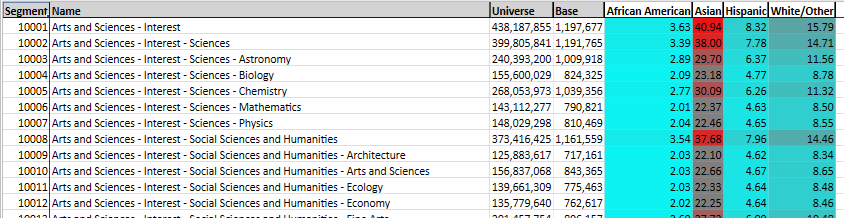
When outputting to data table viewer (i.e., when the "saveAs" key is specified), and using mode "index only" it is possible to apply formatting.
colorbar{}
colorscale{}
freezepane{}
"formatting": {
    "colorBars": {
      "border": "Blue",
      "fill": "LightBlue"
    },
    "freezePane": {
      "row": 1,
      "column": 1
    }
  },
 "formatting": {
    "colorScale": {
      "lowColor": "Cyan",
      "highColor": "Red"
    },
    "freezePane": {
      "row": 1,
      "column": 1
    }
  },
secondaryProcess
Apply a secondaryProcess to apply custom processing to the output of AnalyseSegments