Overview
Index Profiling is a method to detect segments with disproportionate target group concentrations compared to a base population. The Index score quantifies over- or under-representation of dimension values in the target dataset, where >1 indicates over-representation, <1 indicates under-representation, and 1 shows equal representation. These insights support targeted analysis and informed strategic decisions.
Open the index profile report in one of the following ways:
- Analytics | Index Profile
- Project Explorer | Field Select | Right-Click | Index Profile
What are Index Profiles?
Index profiles display the relative counts of a TARGET dataset (e.g., campaign responders) compared to a BASE dataset (e.g., all customers) for each unique value of a dimension, such as MALE/FEMALE for GENDER.
At its simplest, this involves comparing a base dataset (all customers) to a target dataset (campaign responders) using a customer table.
For example, if the BASE dataset has 51% MALE and 49% FEMALE, while the TARGET dataset has 40% MALE and 60% FEMALE, MALES are under-represented in the target (40% vs. 51%), and FEMALES are over-represented (60% vs. 49%).
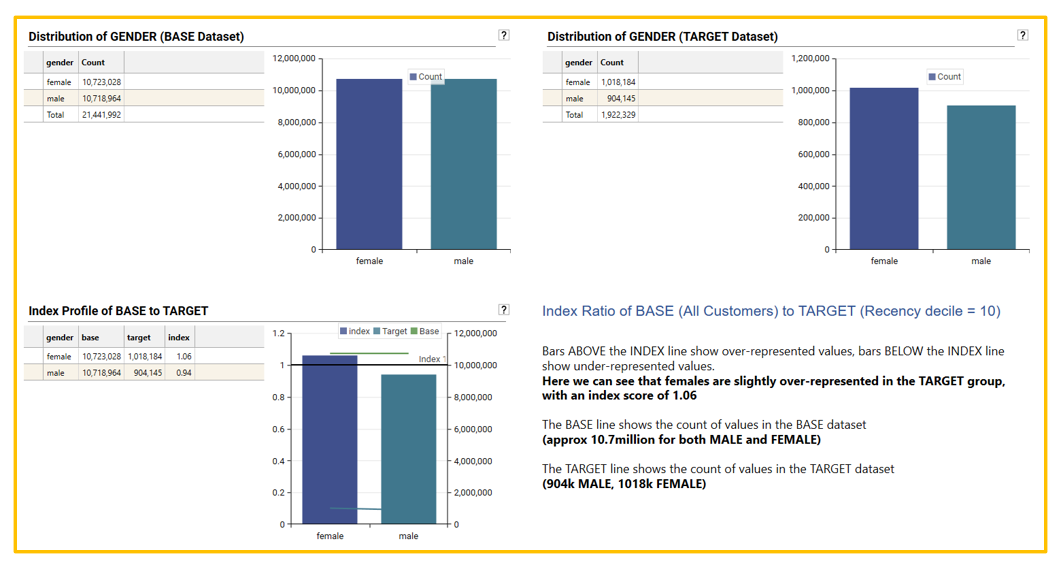
Another way of expressing this would be to say that customers in the TARGET dataset (e.g., campaign responders) are more likely to be FEMALE than MALE in the target group compared to the base group.
Index profile calculations:
This under or over representation is expressed as an index score, where
- An Index of 1 means the value has the same penetration in both BASE and TARGET datasets
- An Index of less than 1 means the value is UNDER REPRESENTED in the TARGET dataset
- An Index of greater than 1 means the value is OVER REPRESENTED in the TARGET dataset
When looking to see which values are over-represented in a target dataset, all values with an index greater than 1 are over-represented to some degree.
The further the index score is away from 1, the greater the under or over representation - i.e., the more pronounced is the relative difference in penetration between the target and base datasets for that value.
The Index profile calculation uses a ratio of ratios so that target and base datasets of differing size can be compared to each other.
- Index = {[Count of value in Target]/[Total records in Target]} / {[Count of value in Base]/[Total records in Base]}
- Index = {[Count of MALE in CAMP_RESPONDERS]/[Total records in CAMP_RESPONDERS} / {[Count of MALE in CUST_TABLE]/[Total records in CUST_TABLE]}
- Magnitude Matters: The further an index score deviates from 1, the stronger the indication of over or under-representation. However, a large deviation based on very small absolute numbers might not be as practically significant as a smaller deviation with substantial counts.
- Practical Significance: Even if an index score is statistically significant, consider its practical implications for your analysis or marketing efforts. A very high index in a tiny segment might not be actionable, whereas a moderately high index in a sizable segment could represent a significant opportunity.
- Context is Key: Always interpret index scores within the context of thedata and business objectives. Understand the dimensions being analyzed and why certain segments might naturally over or under-index.
In essence, while the index score provides a valuable measure of relative representation, it's crucial to consider the underlying counts and, for more rigorous analysis, explore statistical significance to ensure the observed patterns are reliable and actionable.
Report Layout
Input Overview
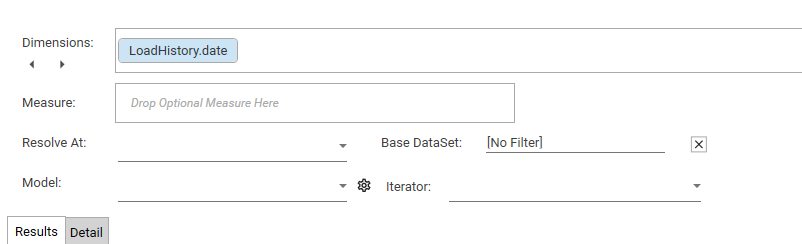
The following inputs can be specified:
- Dimension(s): Discrete fields for segmentation (from a single table).
- Measure (Optional): Numeric field for metrics beyond count.
- Resolve At (Optional): Table for record counting (default: dimension table).
- Base Dataset (Optional): Reference data for comparison (default: all in Resolve At).
- Model (Optional): Secondary process applied to index results.
- Iterator (Optional): Dataset collection applied sequentially as Target.
- Target Dataset (Optional): Dataset compared to Base (default: index = 1.0 if missing).
Output Overview
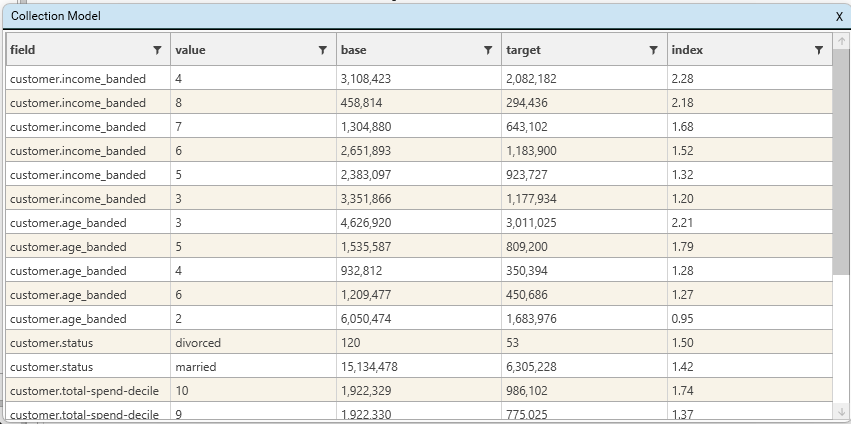
Grid:
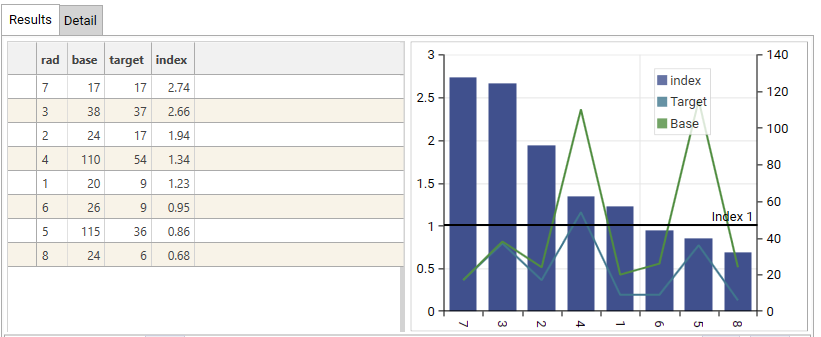
- Dimension (rad): This is the dimension column and details the segments being analysed.
- base: This column shows the count or total value of a specific metric within that segment for the Base dataset. For example, for segment '7', the base count/value is 17.
- target: This column shows the count or total value of the same metric within that segment for the Target dataset. For segment '7', the target count/value is also 17.
- index: This column displays the calculated Index score for each segment. It represents the relative concentration of the target data within that segment compared to the base. For segment '7', the index is 2.74.
Visualization (Bar and Line Chart):
- X-axis (Bottom): This axis represents the dimension - i.e., segments being analysed. The labels (7, 3, 2, 4, 1, 6, 5, 8) correspond to the 'rad' column in the data grid.
- Left Y-axis: This axis represents the Index score. The scale ranges from 0 to 3.
- Bars: The height of the blue bars visually represents the Index score for each segment, corresponding to the 'index' column in the data grid. Segments with bars above the black line at 'Index 1' are over-represented in the target, while those below are under-represented.
- Right Y-axis: This axis represents the count or total value of the metric for the Base and Target datasets. The scale ranges from 0 to 140.
- Green Line (Target): This line plots the Target count/value for each segment, corresponding to the 'target' column in the data grid. The values are read against the right Y-axis.
- Light Blue Line (Base): This line plots the Base count/value for each segment, corresponding to the 'base' column in the data grid. The values are read against the right Y-axis.
- Horizontal Black Line: This line is positioned at Index 1. It serves as a visual threshold:
- Bars above this line indicate segments where the target is over-represented.
- Bars below this line indicate segments where the target is under-represented.
Calculation Type : Dimension only
The only required input for an index profile is a dimension.
To add a dimension to the report, drag a discrete field from the Database Explorer and drop it onto the Dimensions box
- Dimension - [e.g., customer.occupation]
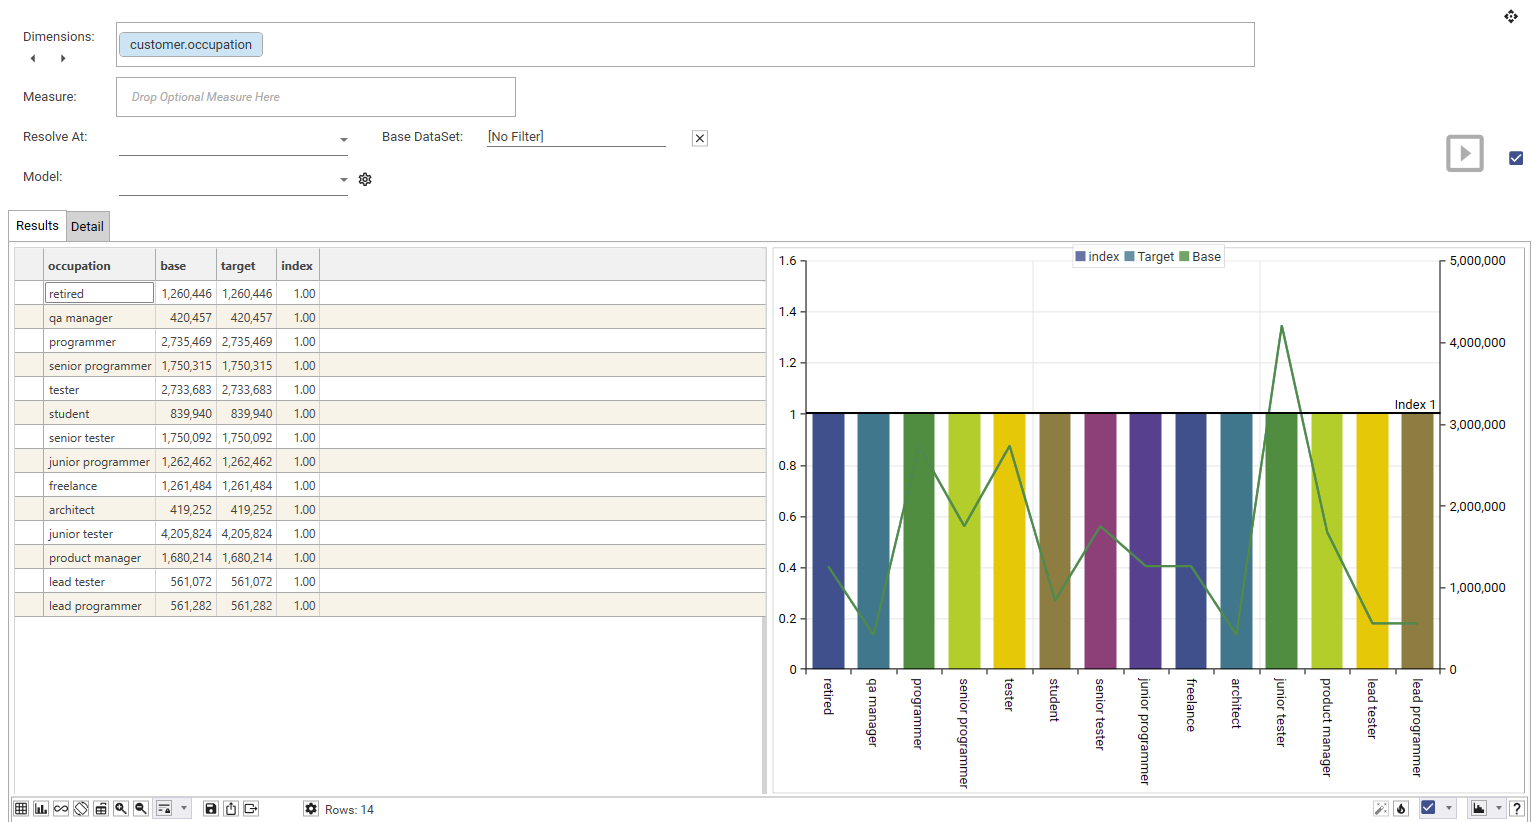
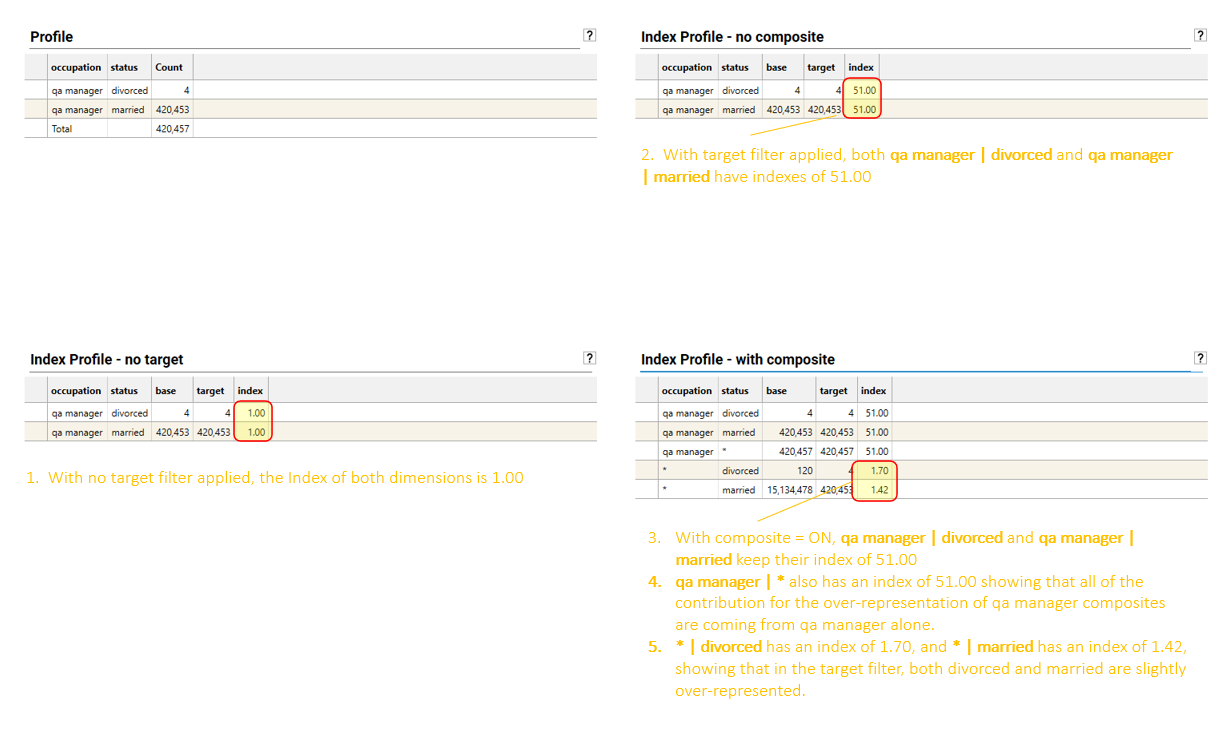
Providing just a dimension, and no target filter, will create an index profile where all values will have an index of 1.00 and base and target counts will be equal.
Calculation Type: Dimension and Base Filter
- Dimension - [e.g., customer.occupation]
- BASE Filter/Dataset - [e.g., customer.frequency > 6]
To add a base filter to the report, drag a dataset or field value from the Database Explorer and drop it onto the Base DataSet box
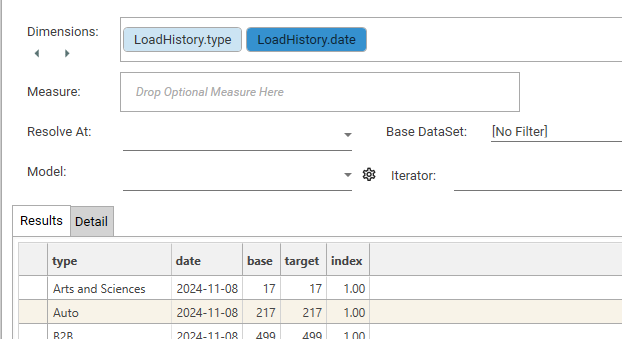
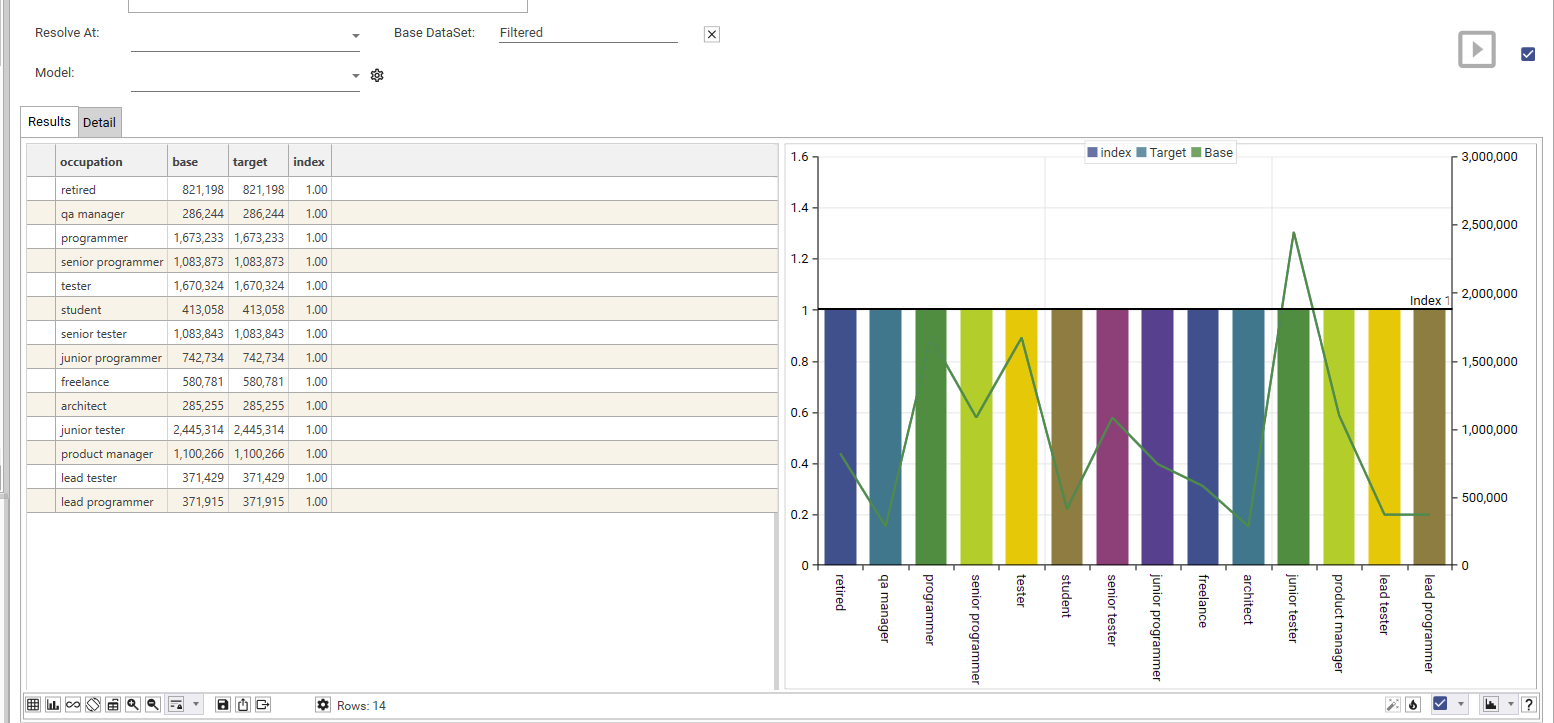
Note: If just a dimension and base filter are applied, the index will remain at 1.00 for all values, and target and base counts will be the same:
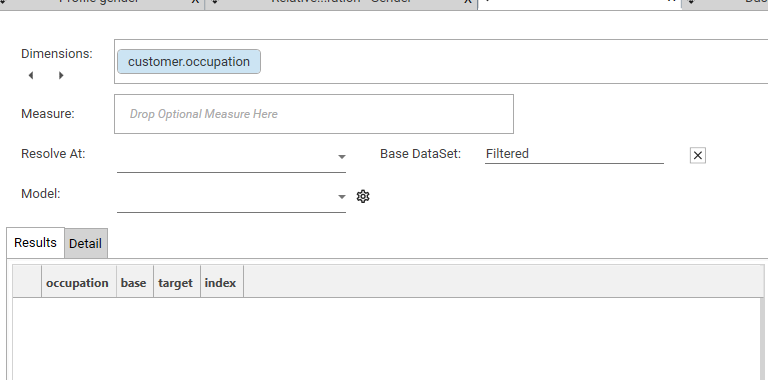
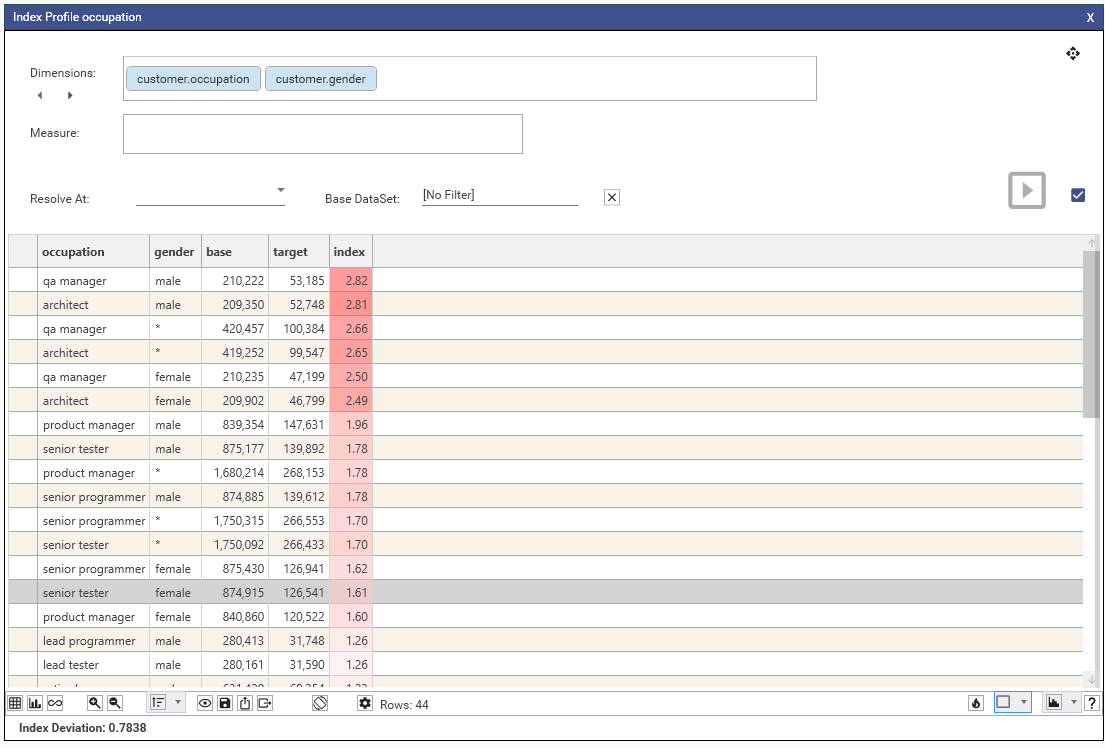
Calculation Type: Dimension and Target Filter
- Dimension - [e.g., customer.occupation]
- Target Filter/Dataset - [e.g., recency-decile = 10]
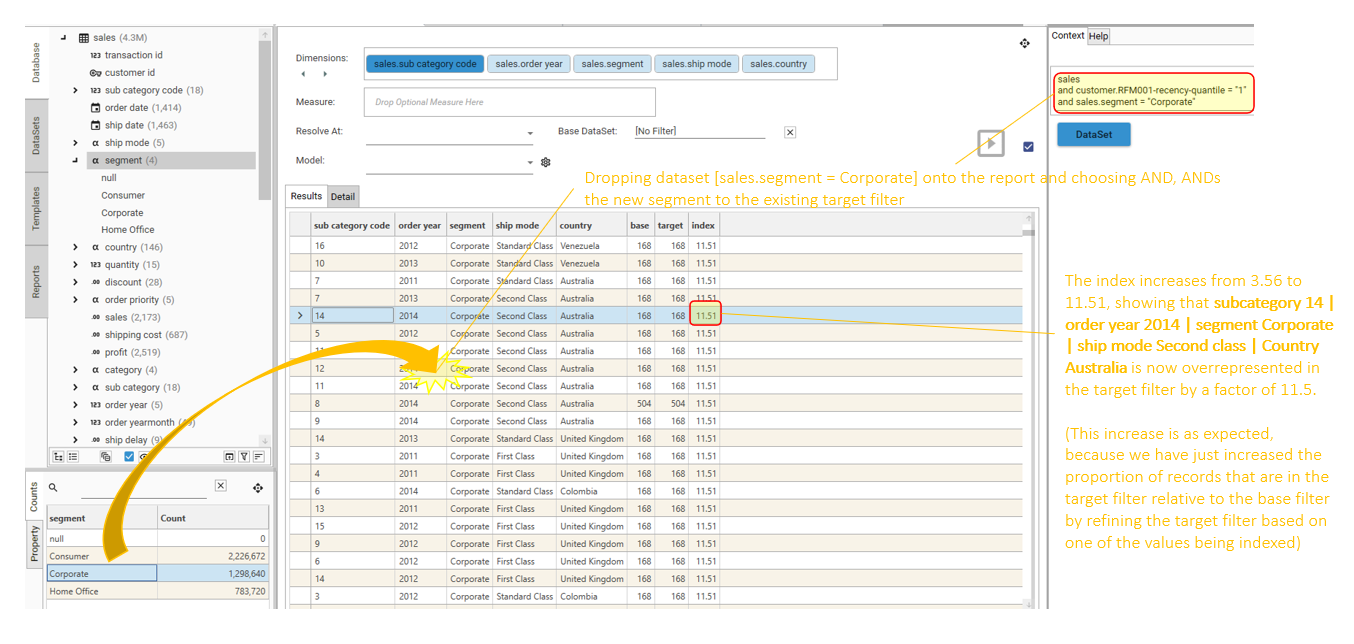
To add a target filter to the report, drag a dataset or field value from the Database Explorer and drop it onto the Result Grid and choose "And"
By providing a target filter, but no base filter, all records in the table will be used as the base.
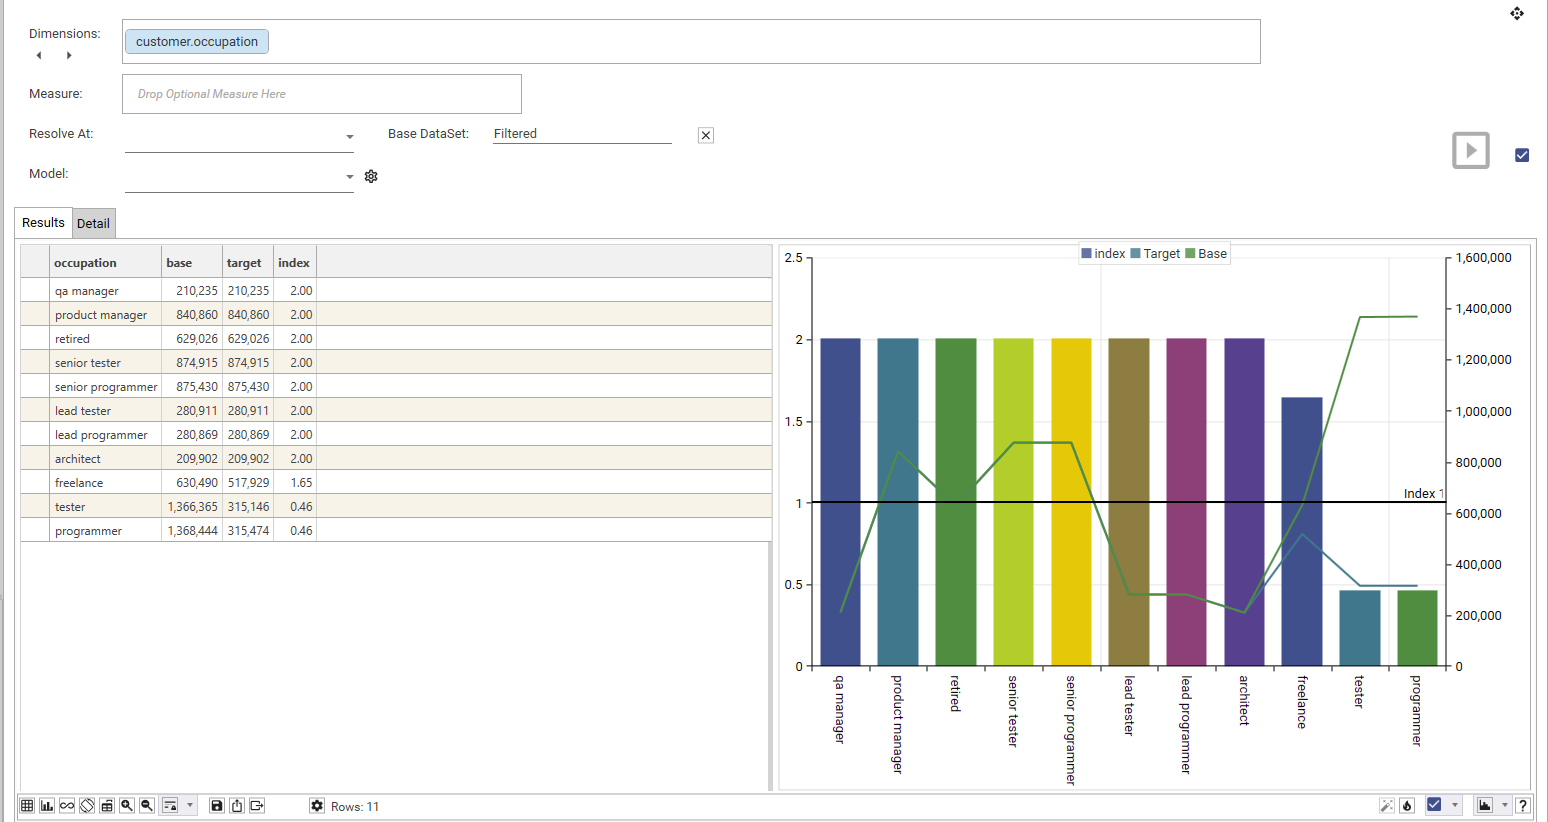
Here we can see the difference in count between base and target filter for occupation = freelance (1,261,484 vs 195,765, with a index of 1.73): 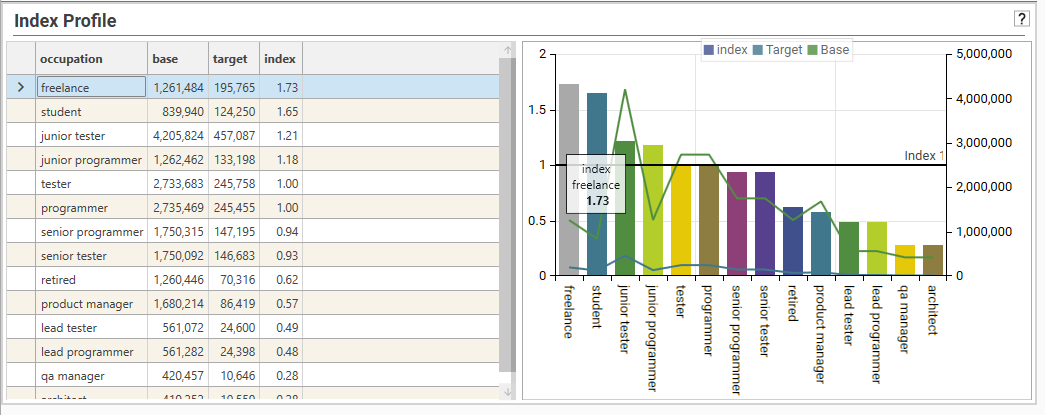
From the index profile shown, we can see that freelance, student, junior tester and junior programmer are over-represented in the target group (as they are above the index=1 line).
Retired, product manager, lead tester, lead programmer... etc are markedly under-represented and are some way below the index line.
By looking at the BASE line, we can see that junior testers make up the largest group in the base group, and architects are the smallest.
Junior testers are also the largest group in the target group, as well as being over-represented in the target compared to the base.
Calculation Type: Dimension, Base and Target
- Dimension - [e.g., customer.occupation]
- Base Filter/Dataset - [e.g., customer.gender = female]
- Target Filter/Dataset - [e.g., customer.age band > 3]
When a target and base filter have both been supplied, the base counts will reflect the distribution of dimension values in the base dataset, and the target counts will represent the distribution of dimension values in the target. The Target line show the distribution of counts in the target dataset (using right-hand axis) and the Base line shows the distribution of counts in the base dataset. The distance between the target and base line represents the difference in counts for a particular value.
Calculation Type: Multi-Dimensional Composites
More than one dimension can be added to create a multi-dimensional index:
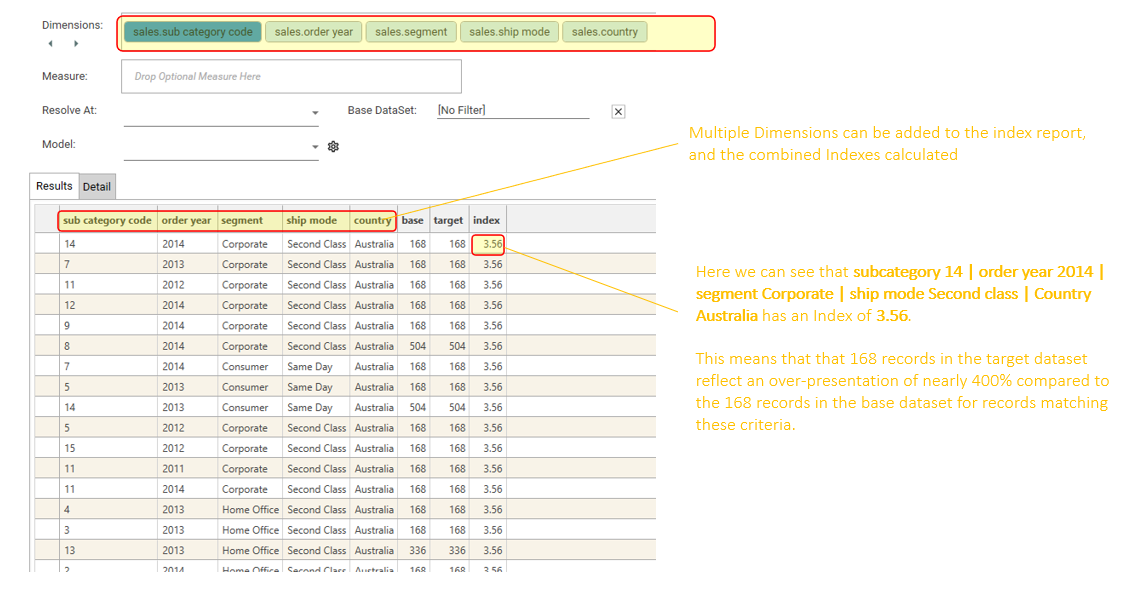
By default, the index in a multi-dimensional profile will be that of the combined dimension. In the example above, the combined dimension is 14 | 2014 | Corporate | Second Class | Australia
Select composite in the options menu to perform a full index across all combinations of the different dimensions:
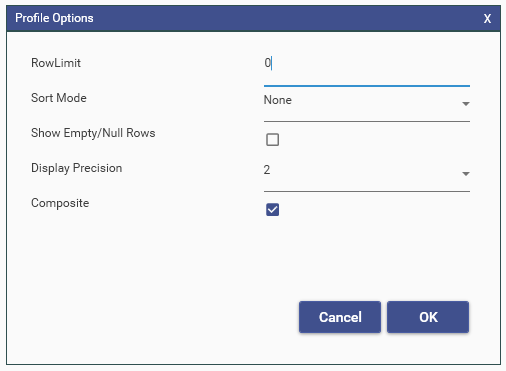
In a composite index, the calculation is performed for each dimension, and every combination of 2 or more dimensions at the same time.
Where a dimension has been ignored in a calculation a * will appear in the value cell.
This indicates that the dimension has made no contribution to the total index for that particular value.
- Composite Index result sets can be very large - several hundred thousands of rows. This result set can be difficult to work with inside the Index Profile report, and will contain many rows that have only 1 record in either target or base.
- A useful strategy is to:
- Calculate the composite index
- Export the result set to table
- Create a filter on the table to remove rows that have insufficient target or base count
- Alternatively, apply thresholds and filters using the IndexThresholdProcessor model (see Secondary Processing)
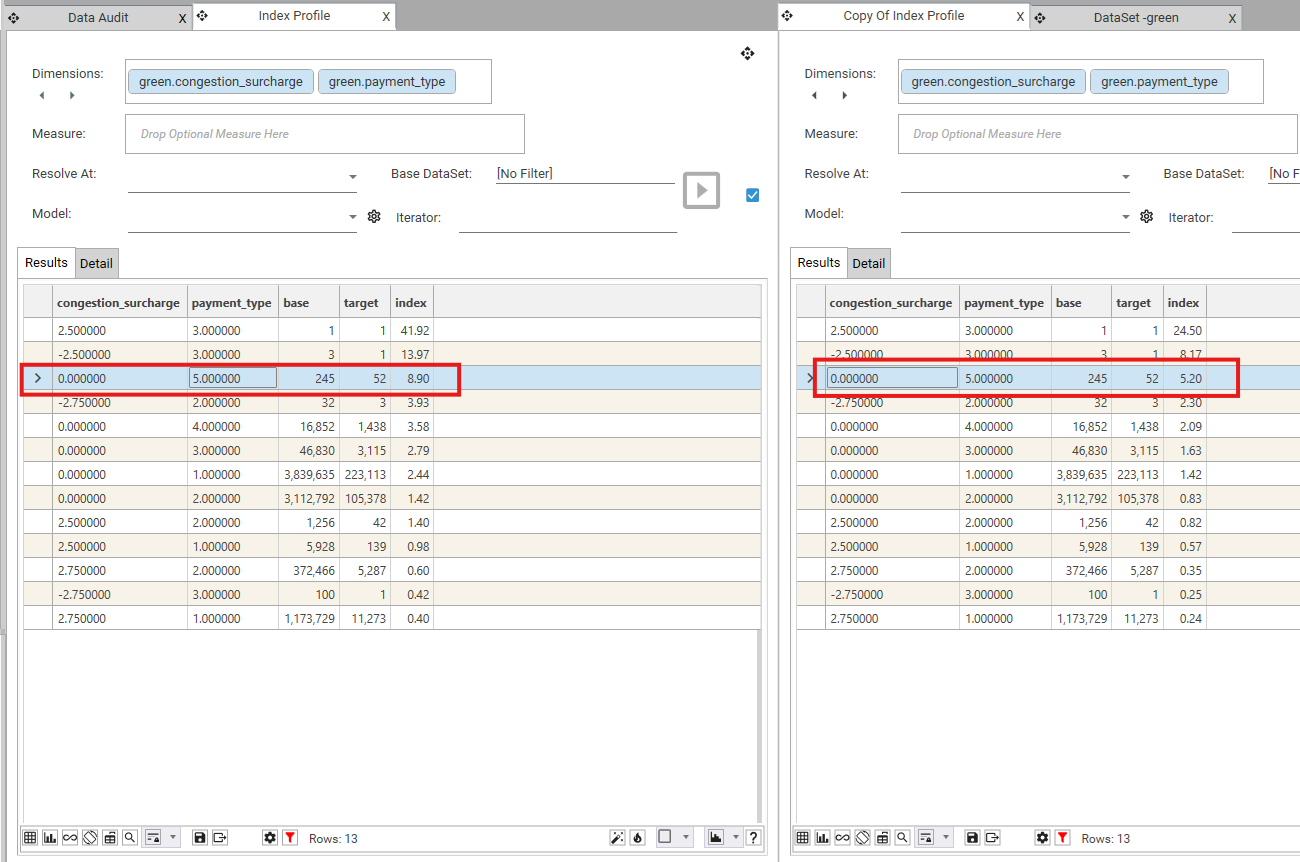
- Take 2 dimension fields: "congestion_surcharge" and "payment_type" from table "Green" which has 82,960,123 records.
- "congestion_surcharge = 0.0000" = 7,016,354
- "congestion_surcharge = NULL" = 74,387,601
- "payment_type = 5.0000" = 3,342
- "payment_type = NULL" = 1,849,587
- Apply a target filter of "ratecodeid=5.0000" which has 1,978,807 records.
Index = (Target Ratio) / (Base Ratio)
= (Target Row Count / Target Total Count)
(Base Row Count / Base Total Count)
= ("congestion_surcharge = 0.0000" and "payment_type = 5.0000") AND "ratecodeid=5.0000" / 1,978,807
("congestion_surcharge = 0.0000" and "payment_type = 5.0000") /82,960,123
= (52) / 1,978,807
(242) /82,960,123
= 8.90
Null Records can be excluded from the Index calculation by selecting "Exclude Nulls From Combined Totals" on the Profile Options dialog
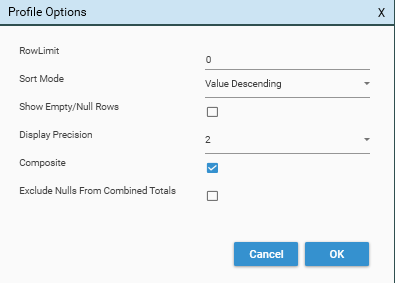
If null records are excluded, then:
- Base Total Count = Sum of all records in Base Column
- Target Total Count = "Target Filter" AND "Base Total Count"
= (52) / 349,843
(242) /8,569,869
= 5.20
Note that there is no difference in the displayed Base and Target Counts.
If comparing counts from a composite index profile to a single dimension profile, the "Exclude Nulls from Combined Totals" option must be selected: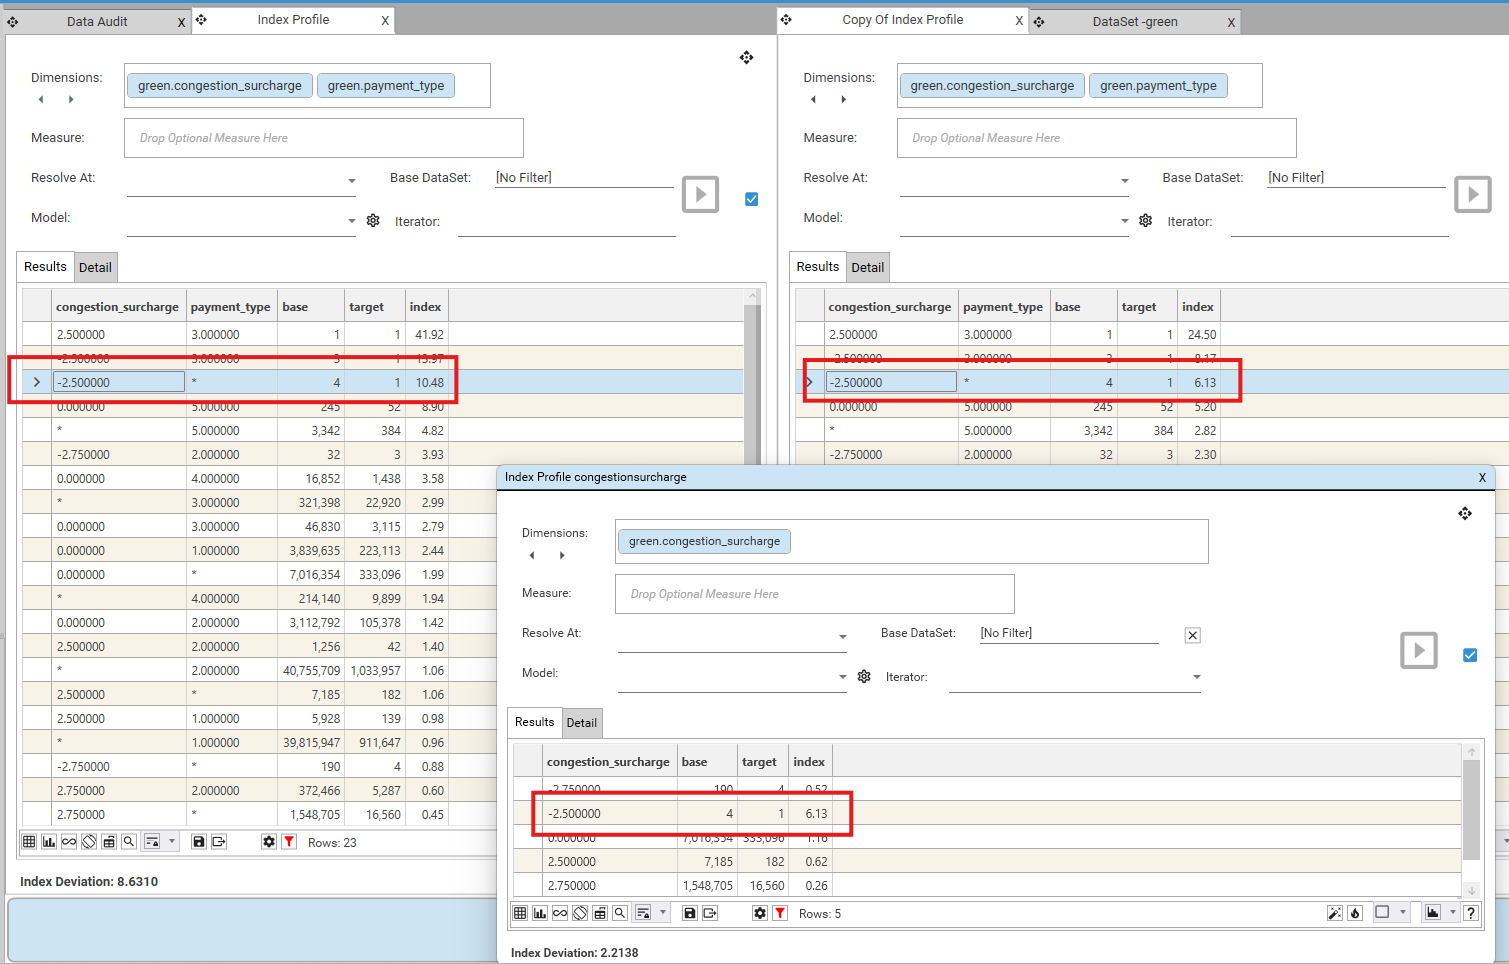
Calculation Type: Measures
By default, index profiles count records. Adding a Measure transforms this. Instead of counting, the index becomes the relative sum of the chosen numeric field within each segment (Dimension).
Think of it this way:
- Without a Measure: The index shows how the number of records in a segment compares to the base.
- With a Measure (e.g., Sales Profit): The index shows how the total profit in a segment compares to the base. An index above 1.00 means that segment contributes a proportionally larger share of the total profit than its share of the overall records.
To calculate a measure index, drag a numeric field from the Database Explorer and drop it into the Measure Box: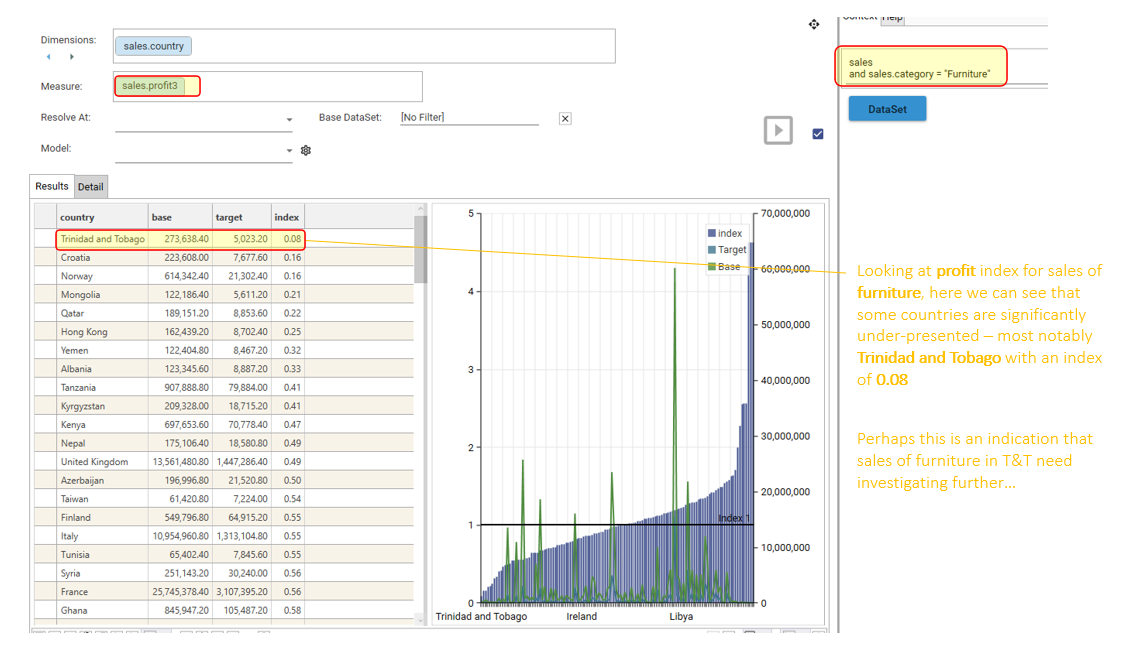
In the example (using "sales_profit" as the Measure):
- The index of 0.08 for "Trinidad and Tobago" indicates that while this country has a certain proportion of the overall records (compared to the base), it generates only 0.08 times the total sales profit relative to its size in the overall data.
- This highlights potentially low-value segments that might have a reasonable number of records but contribute significantly less to the chosen metric (sales profit in this case).
Key takeaway: Adding a measure shifts the focus from simple record counts to the proportional contribution of a specific numeric value within each segment, revealing insights about value concentration (both high and low contributors). An index significantly below 1.00 points to segments that underperform in the chosen measure relative to their representation in the overall data.
Interacting with and modifying results
The following modifications can be applied to Index Profile reports:
- sorting results by index, base or target
- selecting segments and dragging to HotBar
- applying secondary processing
- automating using dataset iterators (Dataset collections)
- automating using field templates (Field Templates)
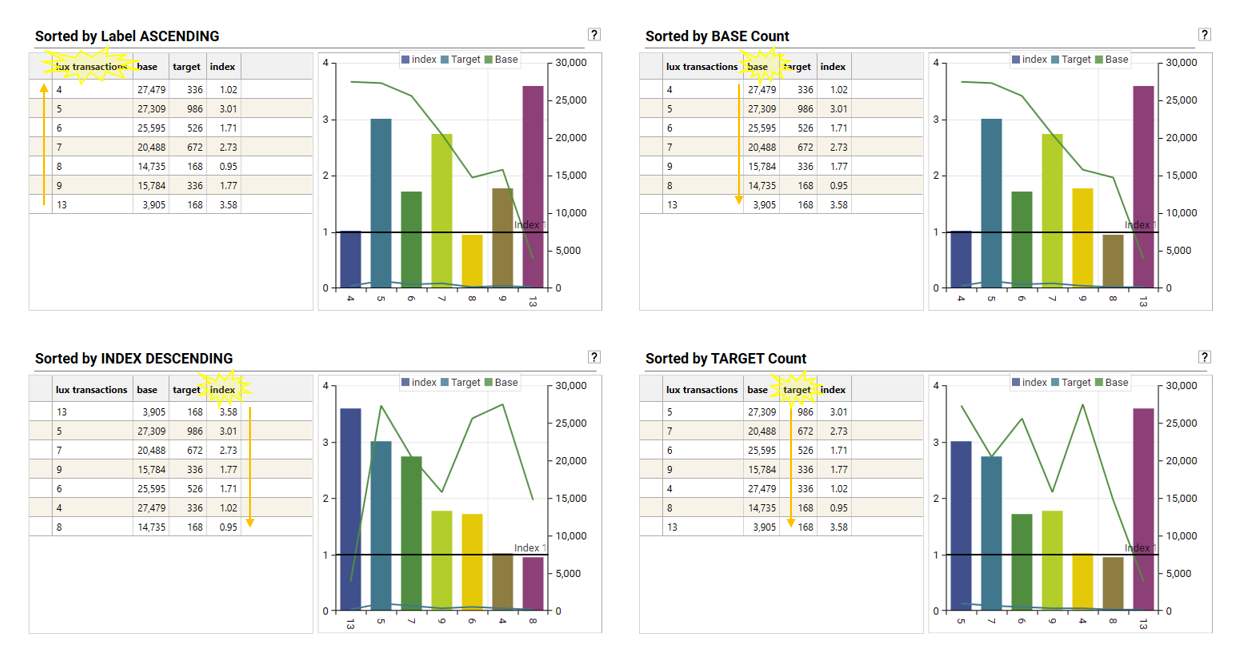
Basic Sorting
Sort the result grid by Index, base or target to more easily see values of interest:
- Sort by Index: This is often the most useful sort for quickly identifying over- and under-performing segments relative to the base population. Sorting in descending order will bring the highest indexing segments (strongest affinity for the target) to the top, while ascending order will show the most under-indexed segments.
- Sort by Base: Sorting by the base count or sum helps understand the absolute size or total measure value of each segment within the overall base population. This provides context for the index score – a high index in a very small base segment might have less overall impact than a moderately high index in a large base segment.
- Sort by Target: Sorting by the target count or sum shows the absolute size or total measure value of each segment within the target population. This helps identify segments that contribute the most to your target group, regardless of their index score.
Example:
- If looking for the most promising customer segments for a new product, sorting by Index (descending) would highlight the groups with the strongest existing affinity for your target demographic or behaviour.
- Conversely, if looking for the largest groups within your existing customer base, you might sort by Base (descending).
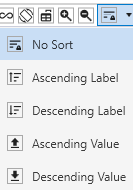
To perform basic sorting, do one of the following:
- Click a column header to rotate through Sort Ascending, Sort Descending, No Sort
- Open the sort selector and choose a sort mode
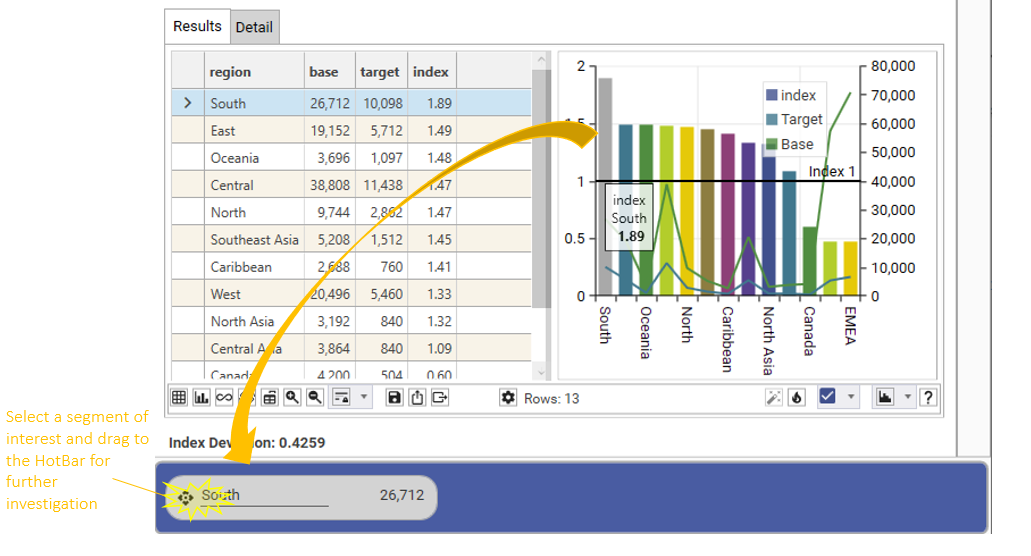
Selecting Segments
Select segments from the grid or chart and drag into the HotBar or directly into a dataset collection to work with them further:
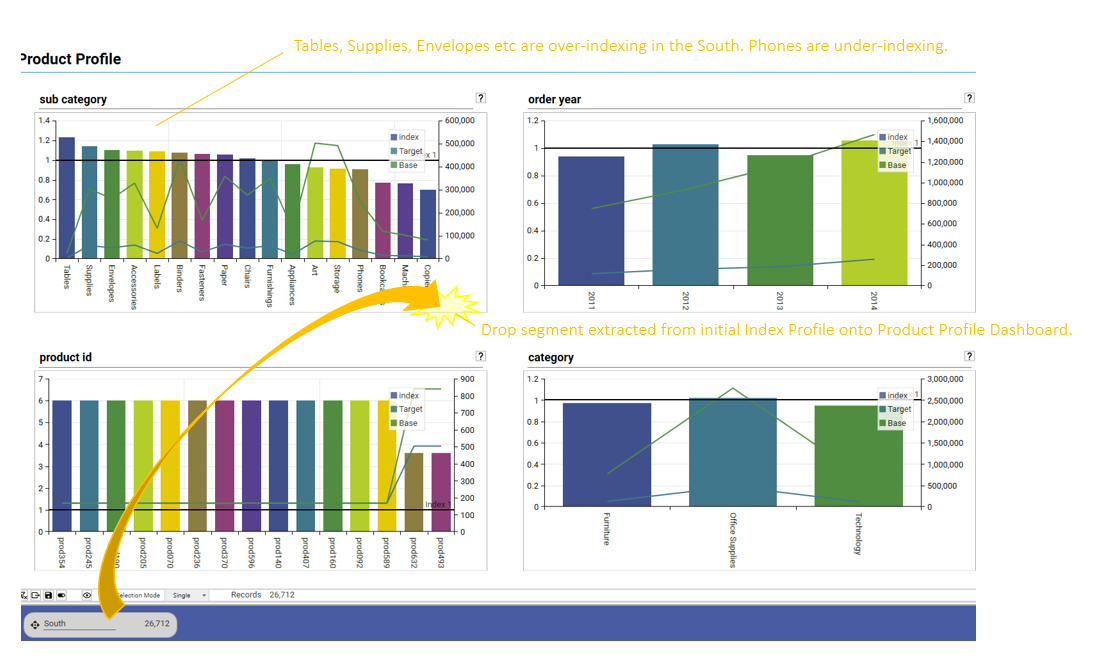
Drop extracted segments back onto an index profiling dashboard for further insight: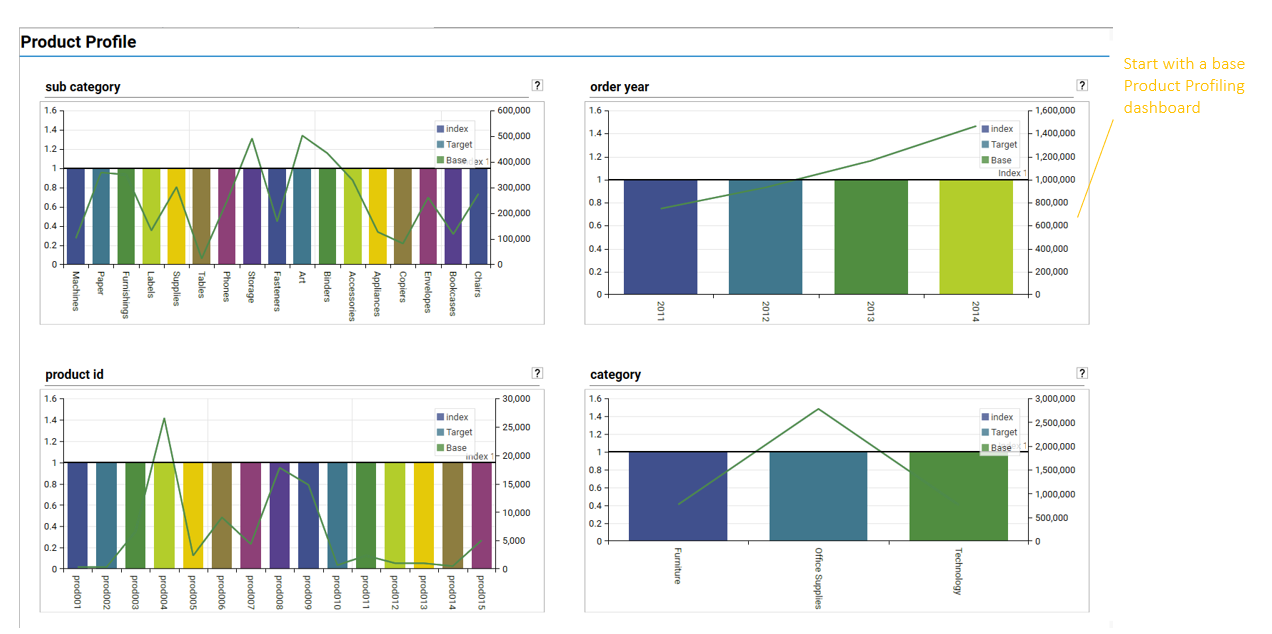
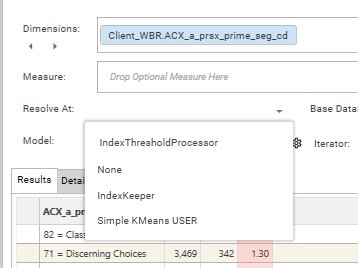
Applying models (secondary Processing)
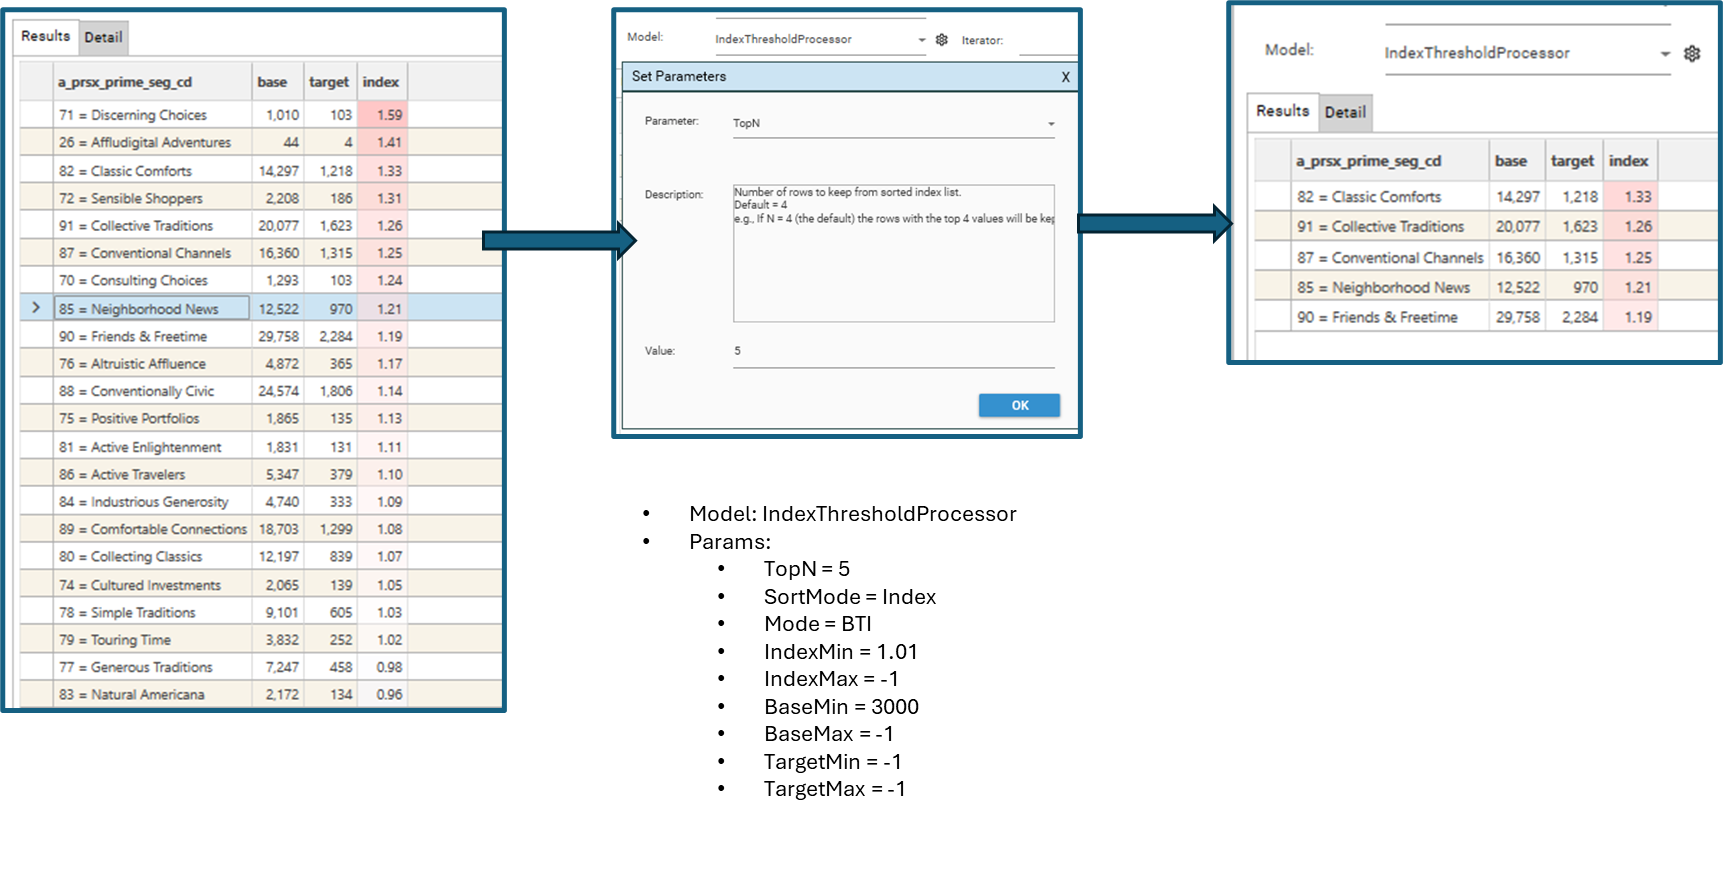
The Index Profile report integrates fully with the python Model Processor. This means that custom processing routines can be developed in the processor and automatically applied to the results that are output from the index report. These are known as secondary processes and can be accessed via the models drop-down:
If the desired model is not in the drop-down, do the following:
- Confirm that python is installed on the server (a good test for this is whether the "Test" button is enabled in the Python User Defined Field or Python Model Processor report.
- Confirm that the model has been shared (Engineering | Model Processor | Python | Library Tab | Select Model | Right-Click| Share) The model name will be displayed in bold.
- Re-open the index profile report
Once the model has been selected, it will be immediately applied to the current profile (unless auto-calc is off, in which case "Not Calculated" will be displayed.)
The list of models consists of:
- models shipped by default with the software (SYSTEM Library)
- custom models developed by users (USER Library)
Most models have a set of default parameters, meaning that results will be returned even without setting up parameters. However, it is possible to develop a model that won't run until parameters have been set.
To set parameters for a model, select the settings icon.
"secondaryProcess": {
   "snippet": "IndexThresholdProcessor",
   "language": "python",
   "parameters": [
      {
        "name": "TopN",
        "value": "10",
        "description": "Number of rows to keep from sorted index list."
      }
    ]
  }
Iterating and Automation
When performing exploratory data analysis (EDA) calculations may need to be repeated with small tweaks or modifications to input parameters. The Index Profile offers the following methods for iterating calculations:
- Target Dataset Iteration - using a DataSet Collection
- GRID MODE: Iterate target datasets. Output Index Scores for all datasets into a single grid
- DASHBOARD MODE: Iterate target datasets. Output Base, Target and Index values for each dataset into dashboard slots
- Coming Soon... (COLLECTION MODE: Iterate target datasets. Add selected rows as segments to a new Dataset Collection.)
- Dimension Iteration - using a field template
- DASHBOARD MODE: Iterate dimensions. Output Base, Target and Index values for each dimension into dashboard slots
- COLLECTION MODE: Iterate dimensions. Add selected rows as segments to a new Dataset Collection.
Target Dataset Iteration
GRID MODE: Automating with Target Dataset Collection
It is possible to repeat the Index Profile calculation for multiple target datasets. To do so:
- Create a dataset collection of target datasets.
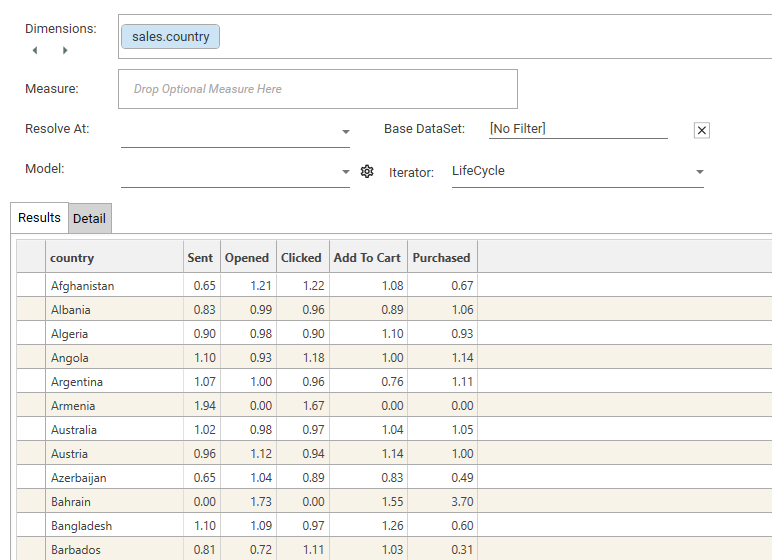
- Open the Index Profile Report OR Drag the new collection from the Project Explorer and drop onto the Iterator drop-down
- Add a dimension
- Add a base filter (optional)
- Apply a model (optional)
- Select the dataset collection in the Iterator drop-down.
DASHBOARD MODE: Automating with Target Dataset Collection
It is possible to repeat the Index Profile calculation for multiple datasets and output content to a dashboard. To do so:
- Create a dataset collection of target datasets
- Create an Index Profile using a suitable dimension (and optional base filter)
- Apply a sample target filter
- Ensure that the index profile looks as desired (e.g., sortMode, chart/grid view, heat map, include/exclude rows)
- Apply a model (optional)
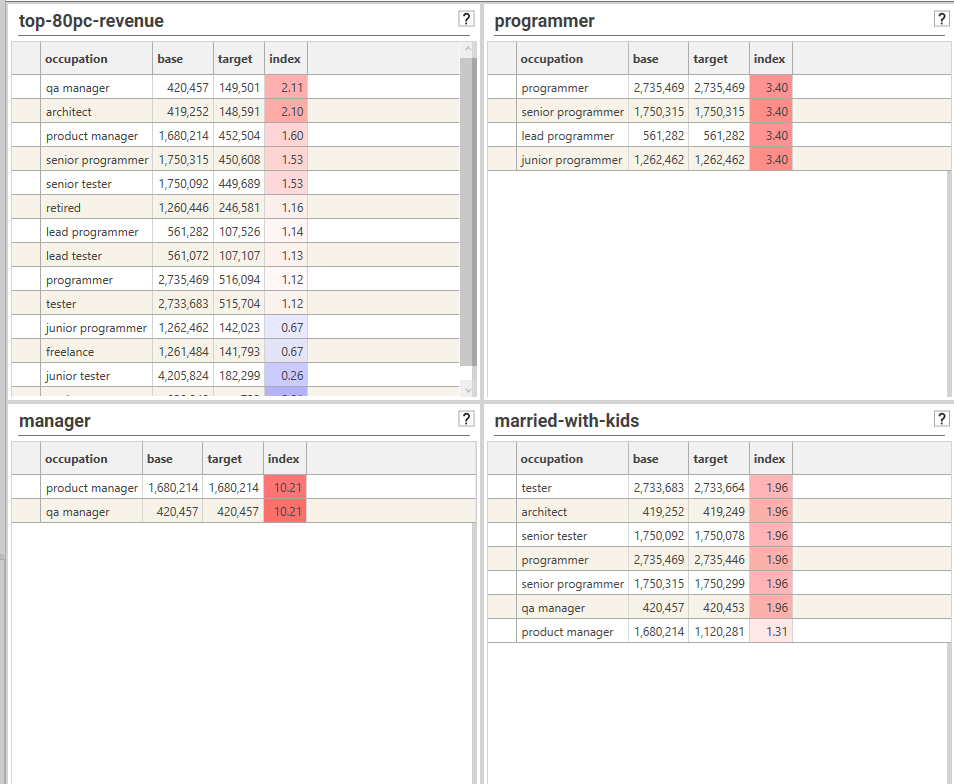
- Drop the target dataset collection onto the Index Profile results and choose either "2 Column" or "3 Column" dashboard.
- A dashboard will be created:
COLLECTION MODE: Automating with Target Dataset Collection
Coming soon...
Dimension Iteration
DASHBOARD MODE: Automating with Field Templates
It is possible to repeat the Index Profile calculation for multiple dimensions. To do so:
- Create a field template of the dimensions to be calculated
- Create an Index Profile using one of the fields in the template
- Ensure that the index profile looks as desired (e.g., sortMode, chart/grid view, heat map, include/exclude rows)
- Apply a model (optional)
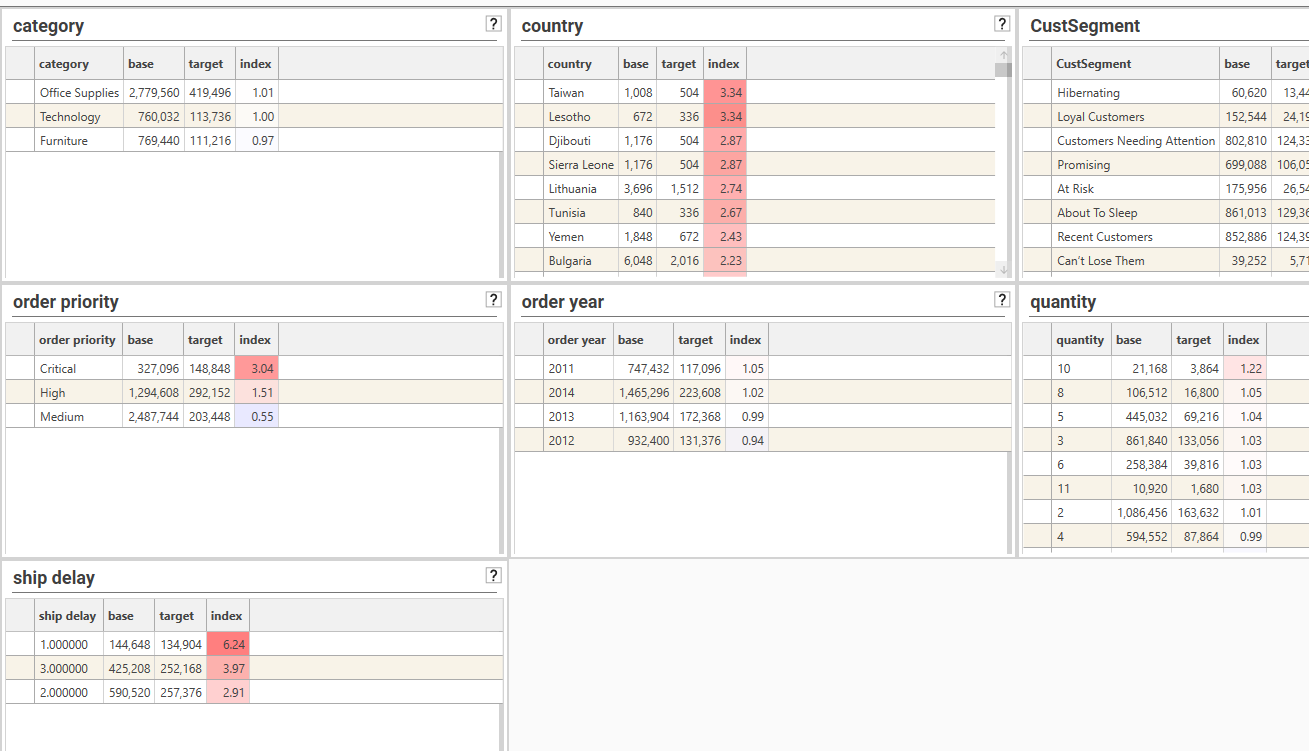
- Drop the field template onto the Index Profile results and choose either "2 Column" or "3 Column" dashboard.
- A dashboard will be created:
COLLECTION MODE: Automating with Field Templates
Add selected rows as segments to a new Dataset Collection by dropping a field template onto an index profile report. The current index profile will be iterated, changing the dimension each time, and each row in each calculation will be added to the same dataset collection.
NOTE: Control the rows that are included in the dataset collection by applying a model such as IndexThresholdProcessor. See CreateCollectionFromProcess for further details.
Display Options
Index profile has similar display options and micro-toolbar features as a standard profile
See Also
- IProfile
- CreateCollectionFromProcess
- BuildReport
- secondaryProcess
- forEach
- Dashboard
- Automation
- Iterating Calculations
- saveAs