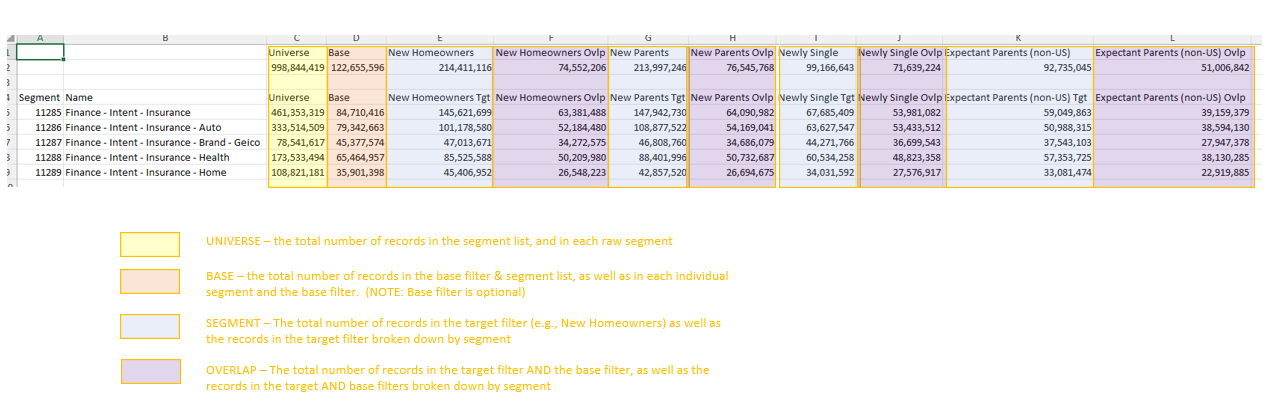
Creates a data grid of intersection counts for a base filter and set of target filters for segmentation data. Use this method to filter all campaign segmentation records by selected datasets.
Available output formats:
- Workbook - see "workbook"
- Table - see "table"
- Data Table - see "saveModelAs"
- Parquet - see "parquet"
- Multi-Field Statistics - see "multiFieldStats"
Python Integration:
- custom plots - see "plotter"
- model processing - see "secondaryProcess"
| Key | Value(s) | Description |
|---|---|---|
| method | "AnalyseSegments" | Creates a data grid of intersection counts for a base filter and set of target filters for segmentation data |
| workbook | "WorkBookName.xlsx" | Required. Output file. Must be *.xlsx. Data will be output to a worksheet named "segments" Default output location if no path specified is TEAM EXPORT FOLDER. |
| table | "tablename" | Optional. Target table for output results. If provided, a copy of the contents of workbook will be added to a new table. |
| targetDataSets [] | [ {Dataset1Definition}, {Dataset2Definition}, {Dataset3Definition} ] | Required. Target datasets to use when calculating overlaps. A minimum of 1 target dataset must be included. Target datasets can be added either by dragging and dropping a dataset collection onto the JSON window, or by dragging and dropping a dataset. NOTE: All target datasets must be on the primary contact table. (The Primary Contact Table is a DataJet table containing at minimum Hash-Keys and their matching Integer-Keys. It is created by loading the Master Hash-Key File generated by ProcessSegments. See Campaign Prototype: How to make a system campaign enabled for further details). To use data from other tables, first copy the required fields to the primary contact table using either CopyUp or CopyDown. NOTE: A maximum of 19 target datasets can be processed in each call to Analyse Segments. It may be possible to add more datasets, depending on the size of the segment data and the memory available to the DataJet Server. A machine with 64GB of RAM could handle 128 datasets. If large numbers of datasets need to be processed, it will reduce overall compute to add the maximum number of target datasets to the AnalyseSegments method as the bulk of the processing time occurs during the scan of the segment data. This happens once per call to AnalyseSegments, regardless of how many target datasets have been specified. To exceed 32 target datasets, set "ignoreMaxDataSets" to true. |
| dataSet {} | {DatasetDefinition} | Optional. Base Dataset. If provided, filters all segments to include only records in the primary contact table that are also in the base dataset. NOTE: The base dataset must be on the primary contact table. |
| segments [] | [NNNN, NNNN, NNNN] | Optional. If not present, all segments in the system will be analysed (i.e., all segments listed in the Audiences or Campaigns interface) Provide a list of segments IDs to include in the analysis: [ 10001, 10002, 10003 ] NOTE: A list of segment IDs can be obtained from the Campaign | Audiences report. Filter the grid to show the required segments, and then use the Copy/Paste functionality to transfer segment IDs into the AnalyseSegments API. NOTE: Only one of segments or segmentFilter can be used. |
| segmentFilter {} | {FilterDefinition} | Optional. Only includes segments that meet criteria. Required input:
NOTE: Only one of segments or segmentFilter can be used. |
| project | "ProjectName" | |
| description | "Description" | |
| lowerLimit | N | Optional. Integer. Default = 0. If non-zero, segments with rows fewer than N in the base dataset will not be included in the Analysis output. NOTE: This filters outputs only - to filter inputs (and reduce calculation time), use either segment or segmentFilter |
| ignoreMaxDataSets | true/false | Optional. Default = false If true, more than 19 target datasets can be specified. NOTE: It is possible AnalyseSegments will fail if the engine server does not have enough memory. |
| threads | N | Reserved for future use 0,2,4,6,8 |
| mode | "modeName" | Optional. String. Default = "" Supported modes:
See Index Example for details of Index calculation Ranking available from v7.09.02.01 |
| subMode | Optional. Only applies to mode of "ranking". Determines how the % value is calculated Default = target_total
| |
| categoryDelimiter | "delimter" | Optional. Valid for modes: "ranking", "target_nontarget" If provided, specifies the delimiter to use when splitting segment name field into category columns. e.g., "Level A Value - Level B Value - Level C Value" would use the delimiter "-" and create 3 category filters: Category 1, Category 2, and Category 3. Note: the prefix "Category" needs to be specified in the categoryName property. |
| categoryName | "CategoryStub" | Optional. Only Valid if categoryDelimiter is specified. Can be specified as a single value or a list If a single value, is treated as a category Stub - e.g.,
|
| saveModelAs | "modelName" | Optional. String. Default = "" If provided, the output from AnalyseSegments will be saved as a "hot model" and will be accessible from the Data Model Viewer. An optional path can be included if required in which case a JSON data table model will be written to file. Note: Set "overwrite": true to overwrite an existing model of the same name. See "Deep Dive - Data Table Model Format" for further details of model format. Available from v7.03.28.01 |
| formatting{} | {FormattingDefinition} | Optional. Works only on mode="index only". Displays colorscale or colorBars in Data Table Viewer |Sheet Available from v7.03.28.01 |
| parquet | "parquetFilename" | Optional. Name of parquet file to output to. |
| plotter{} | "plotter": { "filename": "filename.py", "chart": }, | Optional. Outputs the image generated by the python script in "filename".
|
| secondaryProcess{} | "secondaryProcess": { "snippet": "KMeans Param", "language": "python", "parameters": [ { "name": "Clusters", "value": "5", "description": "Number Of Clusters" } ] } | Optional. Sends a Standard Data Table Model to the python Model Processor and runs the specified snippet. (See Model Processing - Quick Reference for details of how to configure a snippet.) Only snippets which have been pushed into the snippet library are accessible via secondaryProcess. Tip! Use Secondary Processing to apply results filters to AnalyseSegments output - for example, selecting the top N segments by Index value for each target. |
| multiFieldStats | "MFSReportName" | Optional. Name of muti-field statistics report to create from target dataset outputs. NOTE: Only supported in "index only" mode. |
Sample Output:
JSON right-click
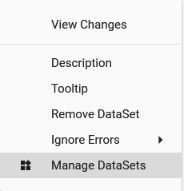
- Remove DataSet: deletes base dataset
- Manage DataSets: Displays Dataset Collection Builder for target datasets
- Mode:
AnalyseSegments will take approx. 30 mins to run on 1800 segments against 1 billion primary contacts. (This is against approx 230 billion foreign records). Against an individual segment runtime will be under 10 seconds.
Blank method
{
  "method": "AnalyseSegments",
  "workbook": "",
  "DataSet": {},
  "segments": [],
  "targetDataSets": {},
  "description": "latest API",
  "project": "eyeota-audience"
  "lowerLimit": 0
}
Sample Method
{
  "method": "AnalyseSegments",
  "workbook": "%DATAPATH%REGRESS_AnalyseSegments_small.xlsx",
  "lowerLimit": 0,
  "segments": [
    10117
  ],
  "dataSet": {
    "logic": "or",
    "name": "Cadillac_1",
    "strict": true,
    "set": [
      {
        "logic": "and",
        "stype": "FIELD",
        "entity": {
          "type": "field",
          "name": "DATA_EYE_FULL.Cadillac",
          "table": "DATA_EYE_FULL",
          "valueFilter": []
        },
        "op": "=",
        "values": [
          "1"
        ]
      }
    ]
  },
  "targetDataSets": [
    {
      "logic": "or",
      "name": "New Homeowners",
      "strict": true,
      "set": [
        {
          "logic": "or",
          "stype": "FIELD",
          "entity": {
            "type": "field",
            "name": "DATA_EYE_FULL.Demo - Life Events - New Homeowners",
            "table": "DATA_EYE_FULL",
            "valueFilter": []
          },
          "op": "=",
          "values": [
            "1"
          ]
        }
      ],
      "NodeType": "DataSet"
    },
    {
      "logic": "or",
      "name": "New Parents",
      "strict": true,
      "set": [
        {
          "logic": "or",
          "stype": "FIELD",
          "entity": {
            "type": "field",
            "name": "DATA_EYE_FULL.Demo - Life Events - New Parents",
            "table": "DATA_EYE_FULL",
            "valueFilter": []
          },
          "op": "=",
          "values": [
            "1"
          ]
        }
      ],
      "NodeType": "DataSet"
    },
    {
      "logic": "or",
      "name": "Newly Single",
      "strict": true,
      "set": [
        {
          "logic": "or",
          "stype": "FIELD",
          "entity": {
            "type": "field",
            "name": "DATA_EYE_FULL.Demo - Life Events - Newly Single",
            "table": "DATA_EYE_FULL",
            "valueFilter": []
          },
          "op": "=",
          "values": [
            "1"
          ]
        }
      ],
      "NodeType": "DataSet"
    },
    {
      "logic": "or",
      "name": "Expectant Parents (non-US)",
      "strict": true,
      "set": [
        {
          "logic": "or",
          "stype": "FIELD",
          "entity": {
            "type": "field",
            "name": "DATA_EYE_FULL.Demo - Life Events - Expectant Parents (non-US)",
            "table": "DATA_EYE_FULL",
            "valueFilter": []
          },
          "op": "=",
          "values": [
            "1"
          ]
        }
      ],
      "NodeType": "DataSet"
    }
  ],
  "description": "One Segment - 10117",
  "project": "eyeota-pivot"
}
Mode: target_nontarget
{
  "method": "AnalyseSegments",
  "saveAs": "as-target-nontarget",
  "workbook": "e:/wb.xlsx",
  "mode": "target_nontarget",
  "subMode": "",
  "threads": 2,
  "lowerLimit": 1000,
  "overwrite": true,
  "categoryDelimiter": "-",
  "categoryName": "Cat",
  "segmentFilter": {
    "field": "DailyLoad.Id",
    "dataSet": {
      "logic": "or",
      "name": "SubSet",
      "strict": true,
      "set": [
        {
          "logic": "or",
          "stype": "FIELD",
          "entity": {
            "type": "field",
            "name": "DailyLoad.type",
            "table": "DailyLoad",
            "valueFilter": []
          },
          "op": "=",
          "values": [
            "Auto"
          ]
        }
      ]
    }
  },
  "targetDataSets": [
    {
      "logic": "or",
      "name": "MY_TARGET",
      "strict": true,
      "set": [
        {
          "logic": "or",
          "stype": "SEGMENTS",
          "segments": {
            "ids": [
              [
                "11405"
              ]
            ]
          }
        }
      ]
    },
    {
      "logic": "or",
      "name": "MY_NON_TARGET1",
      "strict": true,
      "set": [
        {
          "logic": "or",
          "stype": "SEGMENTS",
          "segments": {
            "ids": [
              [
                "11411"
              ]
            ]
          }
        }
      ]
    },
    {
      "logic": "or",
      "name": "MY_NON_TARGET2",
      "strict": true,
      "set": [
        {
          "logic": "or",
          "stype": "SEGMENTS",
          "segments": {
            "ids": [
              [
                "10054"
              ]
            ]
          }
        }
      ]
    }
  ],
  "description": "target_nontarget",
  "project": "Rg2-Audience"
}
Index Example
This type of calculation is common in audience analysis. The Index represents how concentrated the Target group is within the Base group compared to how concentrated the Target group is within the overall Universe.
An index greater than 1 means the value being analysed is over-represented in the target group compared to the base - i.e., that value is more likely to be found in the target that in the comparison population.
 mode: Index
 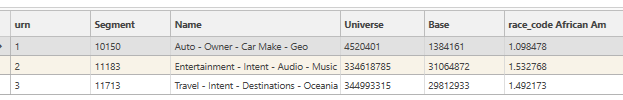 mode: index only
Formula:
Index = (Percentage of Base that is Target) / (Percentage of Universe that is Target)
Percentage of Base that is Target:
This tells us what proportion of the Base group also falls into the Target group.
Calculation: Target Overlap / Base
14015 / 1384161 ≈ 0.01012526 (or about 1.01%)
Percentage of Universe that is Target:
This tells us the overall prevalence of the Target group in the entire population.
Calculation: Target / Universe
41667 / 4520401 ≈ 0.00921765 (or about 0.92%)
Calculating Index:
Calculation: Percentage of Base that is Target / Percentage of Universe that is Target
Index = 0.01012526 / 0.00921765
Index ≈ 1.0984778
Summary:
The Index calculation is:
Index = (Target Overlap / Base) / (Target / Universe)
Index = (14015 / 1384161) / (41667 / 4520401)
Index ≈ 0.01012526 / 0.00921765
Index ≈ 1.098478
As an index greater than 1 (like this one) means the Target audience is more likely to be found within the Base group than within the Universe as a whole, in this case, it is about 1.1 times (or 9.8%) more likely.
See Also:
Mode Examples
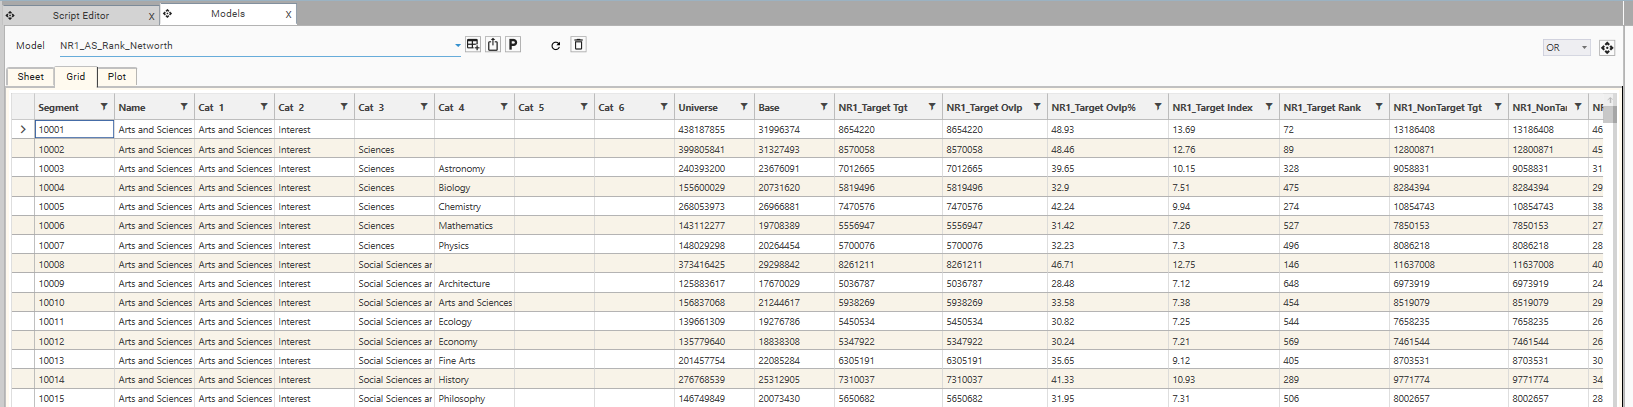
mode = ranking, subMode = "" (target_total)
This mode calculates target counts, overlaps, percentage and indexes and then applies a rank based on Overlap %. This is useful for identifying which segments are most under or over-represented in the target group, as well as getting a sense of the relative size of the segment groups.
- output columns:
- Segment - Segment ID
- Name - Segment Name
- Cat 1...6 - Optional category breakdowns of Segment Name
- Universe - Total Records in Segment
- Base - Total Records in Segment AND Base Filter (Universe AND Base)
- [DS1] Tgt - Records in Segment AND [DS1]
- [DS1] Ovlp - Records in Segment AND Base AND [DS1] (Note - in this example, [DS1] = NR1_Target, which is a subset of Base, hence the numbers are the same)
- [DS1] Ovlp% - ([DS1] Target / [DS1] Target Total) * 100 (e.g., ( 8,654,220 / 17,686,446) * 100 = 48.93%
- [DS1] Index - (Percentage of Base that is Target) / (Percentage of Universe that is Target) (See AnalyseSegments for detailed calculation)
- [DS1] Rank - sorted by [DS1] Ovlp %
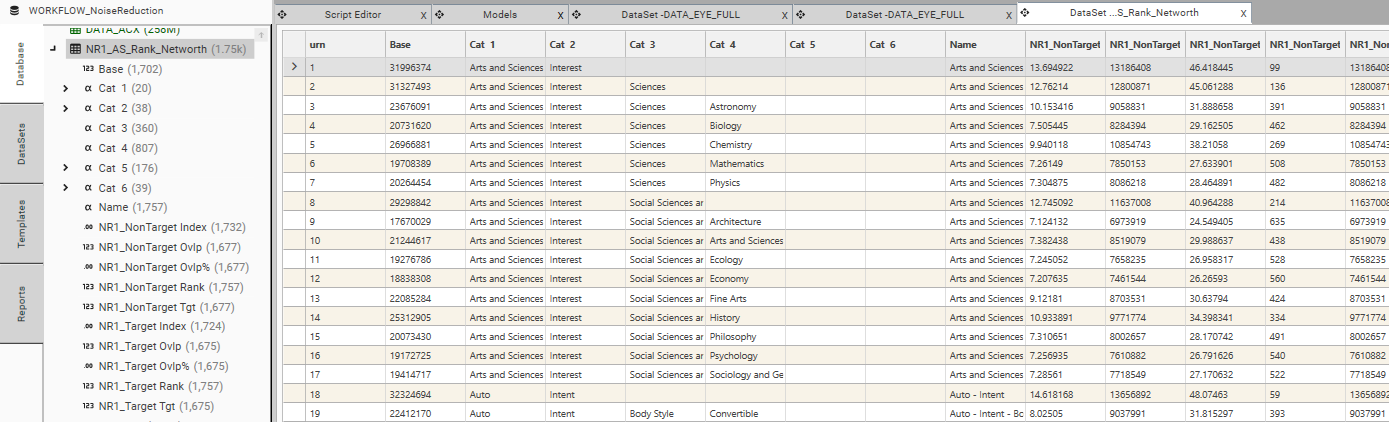
Data Table Viewer Output
Excel Output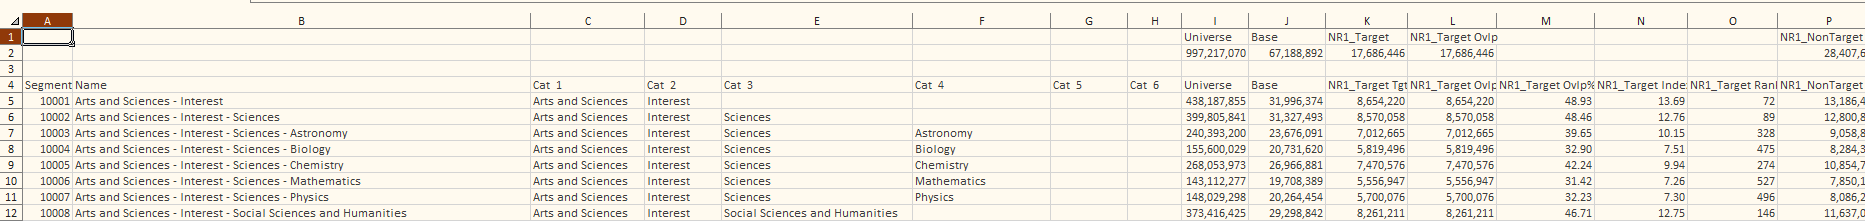
Table Output
JSON Method
{
"method": "AnalyseSegments",
"targetDataSets": [
{
"logic": "or",
"name": "NR1_Target",
"strict": true,
"set": [
{
"logic": "or",
"stype": "FIELD",
"entity": {
"type": "field",
"name": "DATA_EYE_FULL.NR1_Target",
"table": "DATA_EYE_FULL",
"valueFilter": []
},
"op": "=",
"values": [
"1"
]
}
]
},
{
"logic": "or",
"name": "NR1_NonTarget",
"strict": true,
"set": [
{
"logic": "or",
"stype": "FIELD",
"entity": {
"type": "field",
"name": "DATA_EYE_FULL.NR1_NonTarget",
"table": "DATA_EYE_FULL",
"valueFilter": []
},
"op": "=",
"values": [
"1"
]
}
]
}
],
"workbook": "NR1_AS_Rank_Networth.xlsx",
"saveModelAs": "NR1_AS_Rank_Networth",
"lowerLimit": 0,
"upperLimit": 0,
"table": "NR1_AS_Rank_Networth",
"mode": "ranking",
"categoryDelimiter": "-",
"categoryName": "Cat ",
"keepFiles": false,
"overwrite": true,
"dataSet": {
"logic": "or",
"name": "NR1_Base",
"strict": true,
"set": [
{
"logic": "or",
"stype": "FIELD",
"entity": {
"type": "field",
"name": "DATA_EYE_FULL.NR1_Base",
"table": "DATA_EYE_FULL",
"valueFilter": []
},
"op": "=",
"values": [
"1"
]
}
]
},
"project": "WORKFLOW_NoiseReduction"
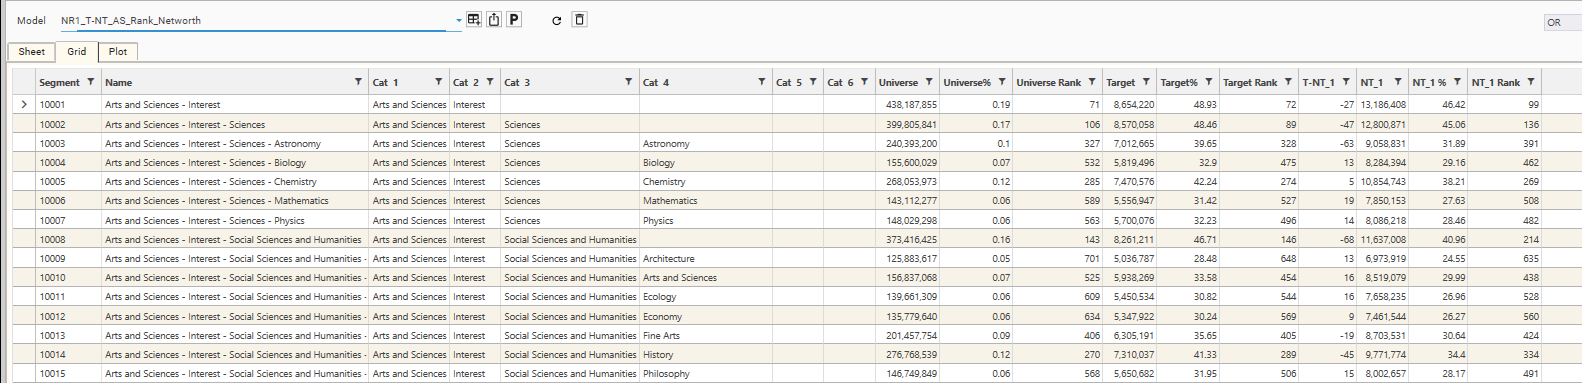
}mode = "target_nontarget", subMode = ""
- output columns:
- Segment - Segment ID
- Name - Segment Name
- Cat 1...6 - Optional category breakdowns of Segment Name
- Universe - Total Records in Segment
- Universe % - (Universe Count / Universe Total) * 100
- Universe Rank - Ordered by Universe %
- Target - Total Records in Segment AND Target Dataset (Note - target dataset is always the first dataset in the dataset list)
- Target % - (Target Count / Target Total) * 100
- Target Rank - Ordered by Target %
- T-NT_1 - (Target Rank - Non-Target Rank)
- NT_1 - Total Records in Segment AND NON Target Dataset (Note - first non target dataset is always the second dataset in the dataset list. subsequent datasets become NT_2, NT_3 etc)
- NT_1 % - (Non-Target 1 Count / Non-Target 1 Total)
- NT_1 Rank - Ordered by NT_1 %
Data Table Viewer Output
Trouble-shooting
| Issue | Cause | Resolution |
|---|---|---|
| error cannot find key | mismatch between active primary contact table key and campaign configuration file. | The primary contact table is the table that contains the dynamic integer key (generated as part of ProcessSegments). Usually this is something like Table.key The campaign configuration file is the json file that enables campaign functionality for the project. By default it is stored in the Admin | Remote Files | Campaign directory and has the name [projectname].campaign.json The key entry in this file should match the primary contact table key: |
| campaign Audiences report does not support drag and drop of segments | configuration issue with underlying segs folder? | |
| campaign report not available | configuration issue - project has not been correctly campaign enabled | Check that project campaign configuration file is present and correct |
| dataset does not belong to key table Nothing to output cannot export model to table | either dataSet or targetDataSets contains a dataset from a table that is not linked to the Primary Contact Table | Remove the dataset, or create a copy of the dataset on the Primary Contact Table. NOTE: it is usual to copy profiling fields from linked data sources to the PCT before using them in AnalyseSegments |
| dataset counts on Primary Contact Table do not match counts in Campaign Audiences report | Primary Contact Table and Campaign/Segs folder are out of synch. | datasets on the primary contact table are usually built using CreateAudiencesFromWorkbook.
|