NOTE
This article is part of the "Tutorial - Basic Sales Dashboard" series. It assumes the following:
The Daily Sales Dashboard and all underlying reporting metrics have been created.
Approach
Standardized reports provide filtering capability to users who do not have access to the full data catalog. This article shows how to turn an existing dashboard into an interactive standardized report and apply a pre-determined set of filters to the new report.
At the end of this step, you will know how to:
Create a Standardized Report from a Dashboard
Add Filters to a Standardized Report
Key Techniques
The following functional areas are introduced by this step:
Report Filters
Web Preview
Video Tutorial
{TODO: Video}
Create and Publish Standardized Report
What are Standardized Reports Used For?
Standardized reports are designed for business users or end users who don't have access to the full range of DataJet features - for example Project Explorer, Analytics, Modelling, Engineering etc. Standardized reports are often made available over the web.
What is the Difference Between a Dashboard and a Standardized Report?
Dashboards allow users to apply filters dynamically by selecting objects from the Project Explorer and dropping them onto the Dashboard. Any filter that is dropped is applied to all dynamic slots on the dashboard. Standardized reports don’t react to dropped filters (or datasets), but they allow the report designer to specify a pre-determined set of filters. These filters can be configured to act as required against each individual slot on the report. Standardized reports can be created directly from dashboards.
Open Dashboard
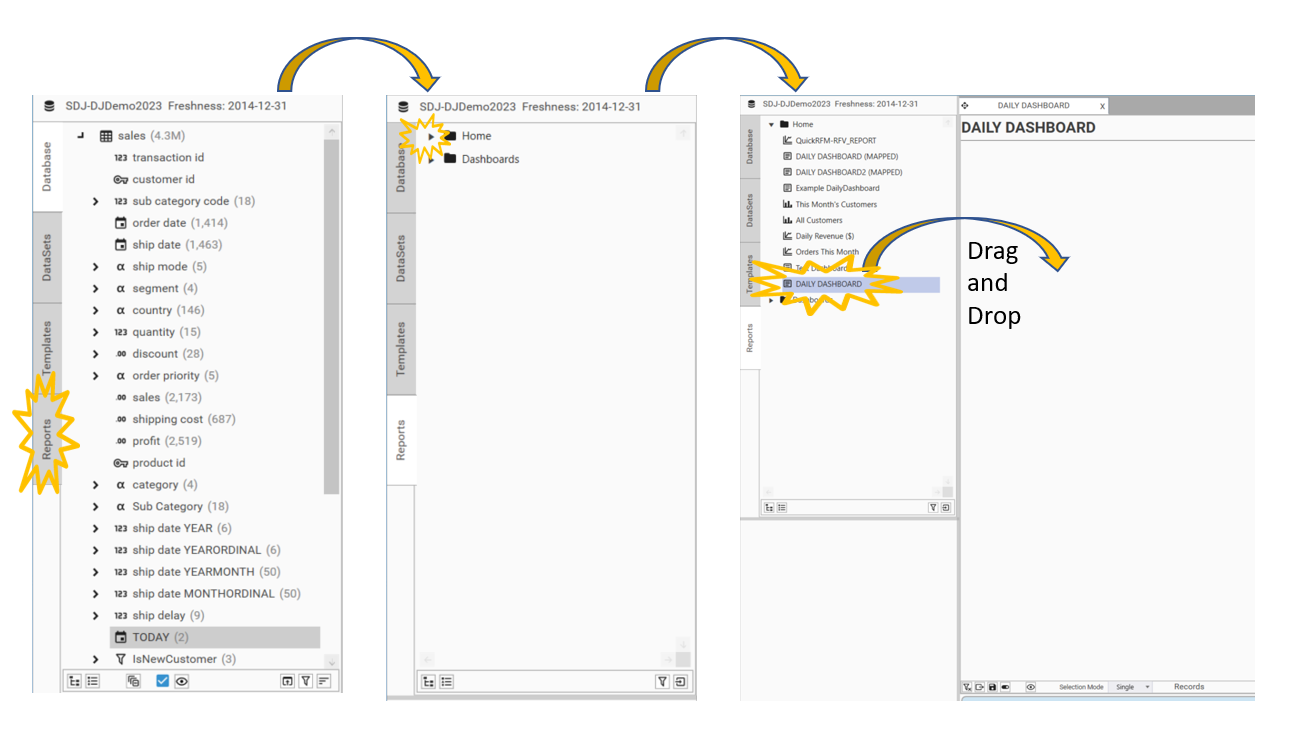
If the Daily Sales Dashboard is not already open, reopen it:
Go to Reports
Expand Home
Double-Click DAILY SALES DASHBOARD
Export as Standardized Report
Design/View Mode
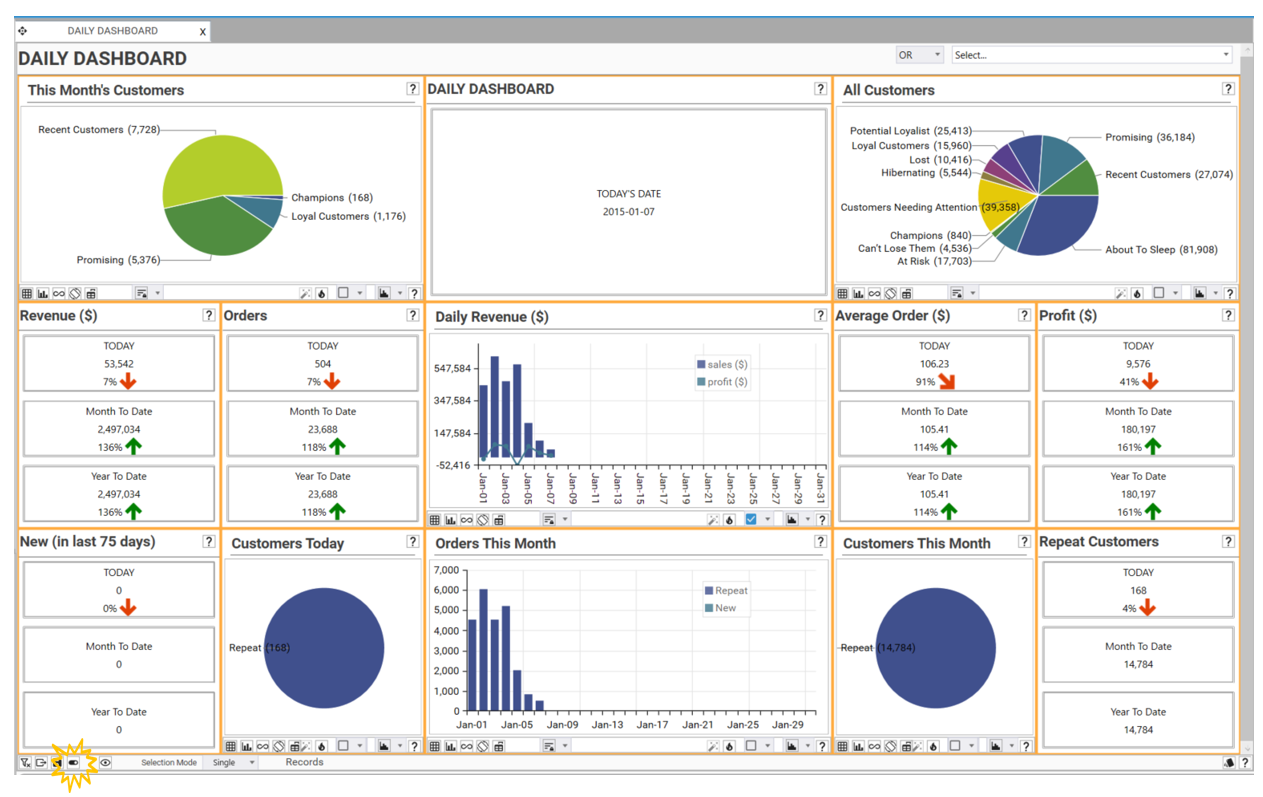
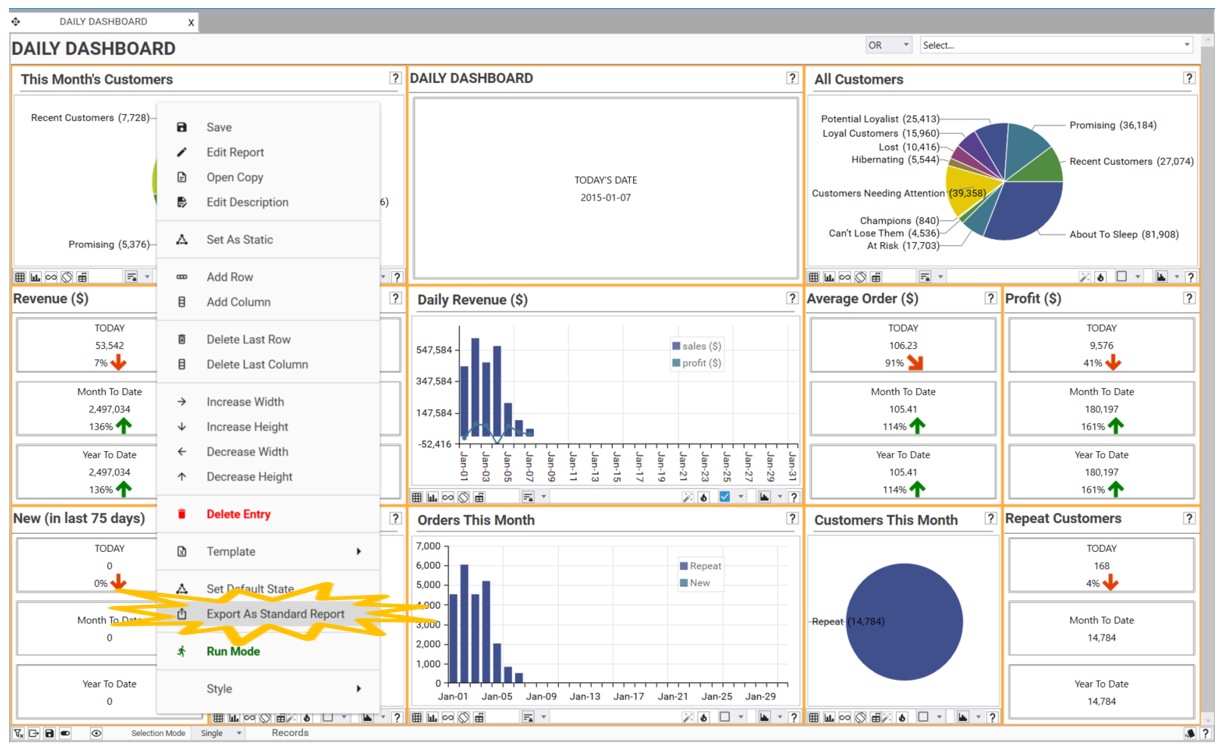
The Dashboard will open in view mode. To Export the dashboard to a standardized report:
Put the report into design mode by using the Toggle button. Individual slots will have an orange border surrounding them.
Exporting
To export the dashboard:
Right-click anywhere on the dashboard and select Export as Standardized Report.
It may take a minute or so to export as it is a complex process to convert between the two.
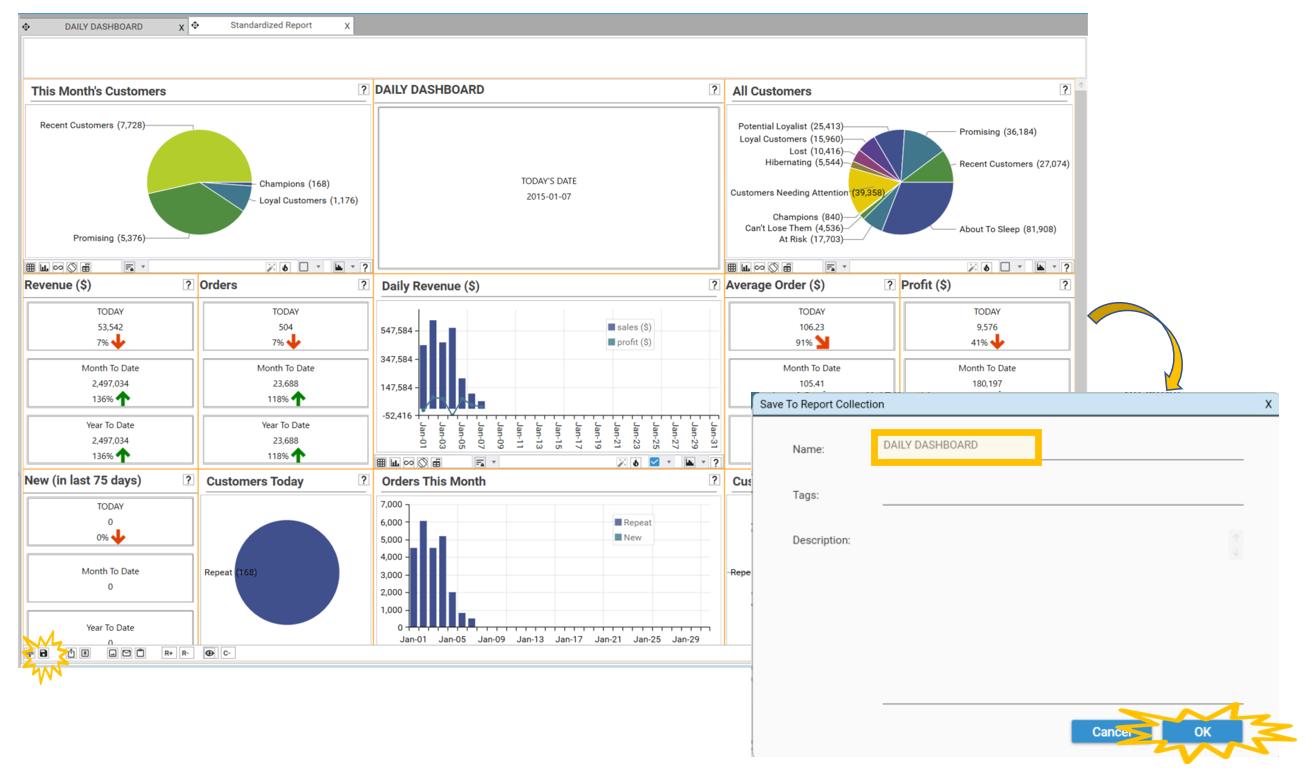
Once complete a new tab will open called Standardized Report.
To save the Standardized Report:
Click the save icon on the toolbar. The Save To Report Collection dialog will appear.
Change the name of the report as DAILY DASHBOARD (note this is case sensitive) and select OK.
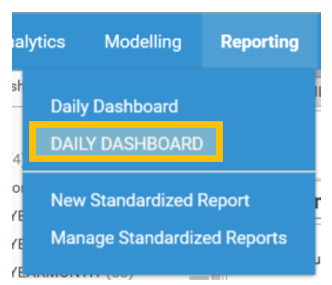
Once saved the report can be accessed via the Reporting menu:
Filters
Adding Filters to the Report
To add filters to the Report:
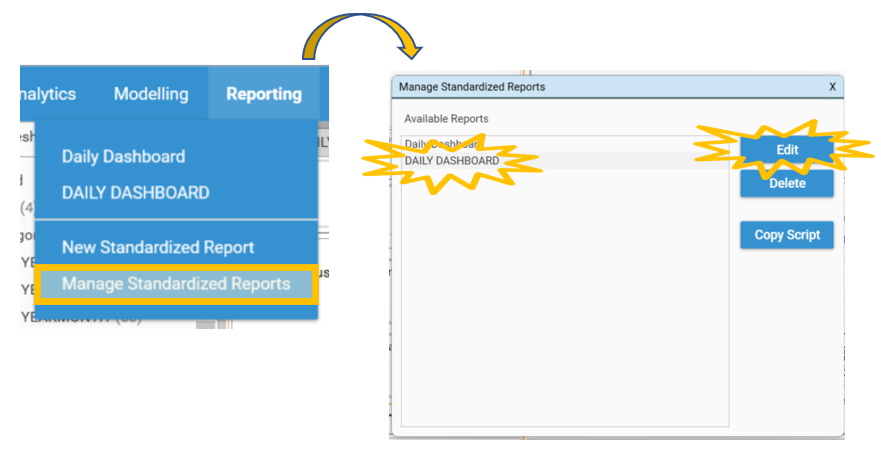
Go to Reporting | Manage Standardized Reports. The Manage Standardized Reports Dialog will appear.
Select DAILY DASHBOARD and then Edit. The report will re-open in a mode where it can be edited.
To add a filter:
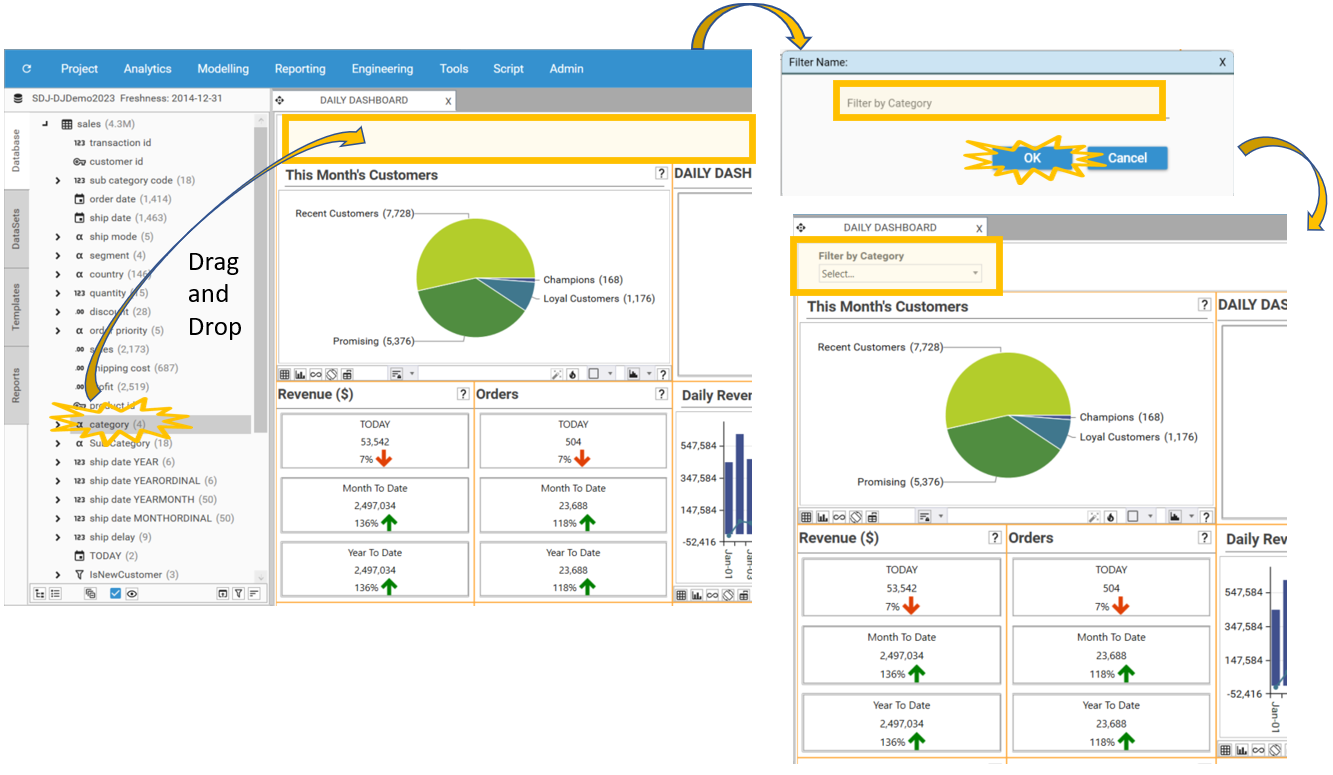
Drag and drop [sales.category] into the area above the report.
Select OK to keep the default filter name.
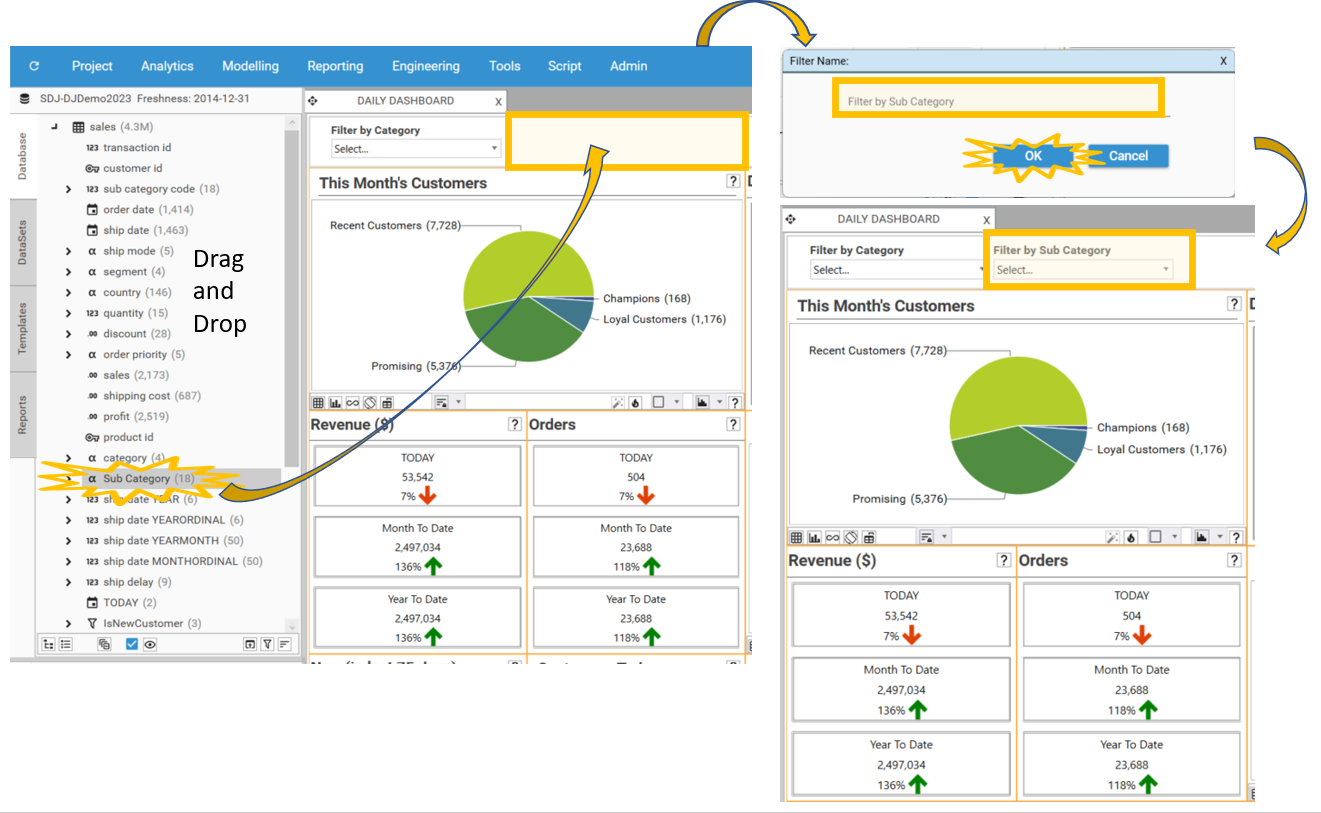
Add another filter of Sub Category:
Drag and drop [sales.Sub Category] into the box above the report.
Select OK to keep the default filter name.
Filter Dependencies
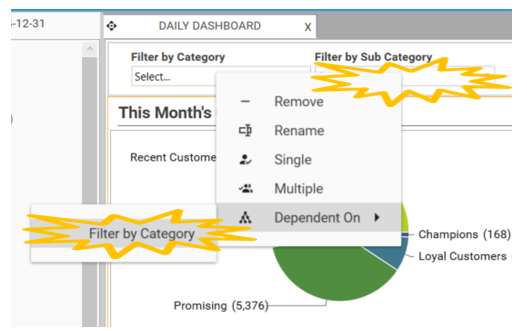
It is possible to set filters to be dependant on each other. For the Daily Dashboard, the “Sub Category” filter is set to be dependant on “Category”.
To set Sub Category to be dependent on Category:
Right-click on the Sub Category filter (in the drop-down box) and go to Dependent On | Filter by Category.
Connecting Filters to Slots
It is possible to have each slot responding in a custom way to each filter setting. By default, a filter will not be connected to any slots on the report. In this instance, each filter will be applied to all slots on the report.
To connect the filters to the report:
Right-click on one of the slots - in this case “Orders This Month By Segment”.
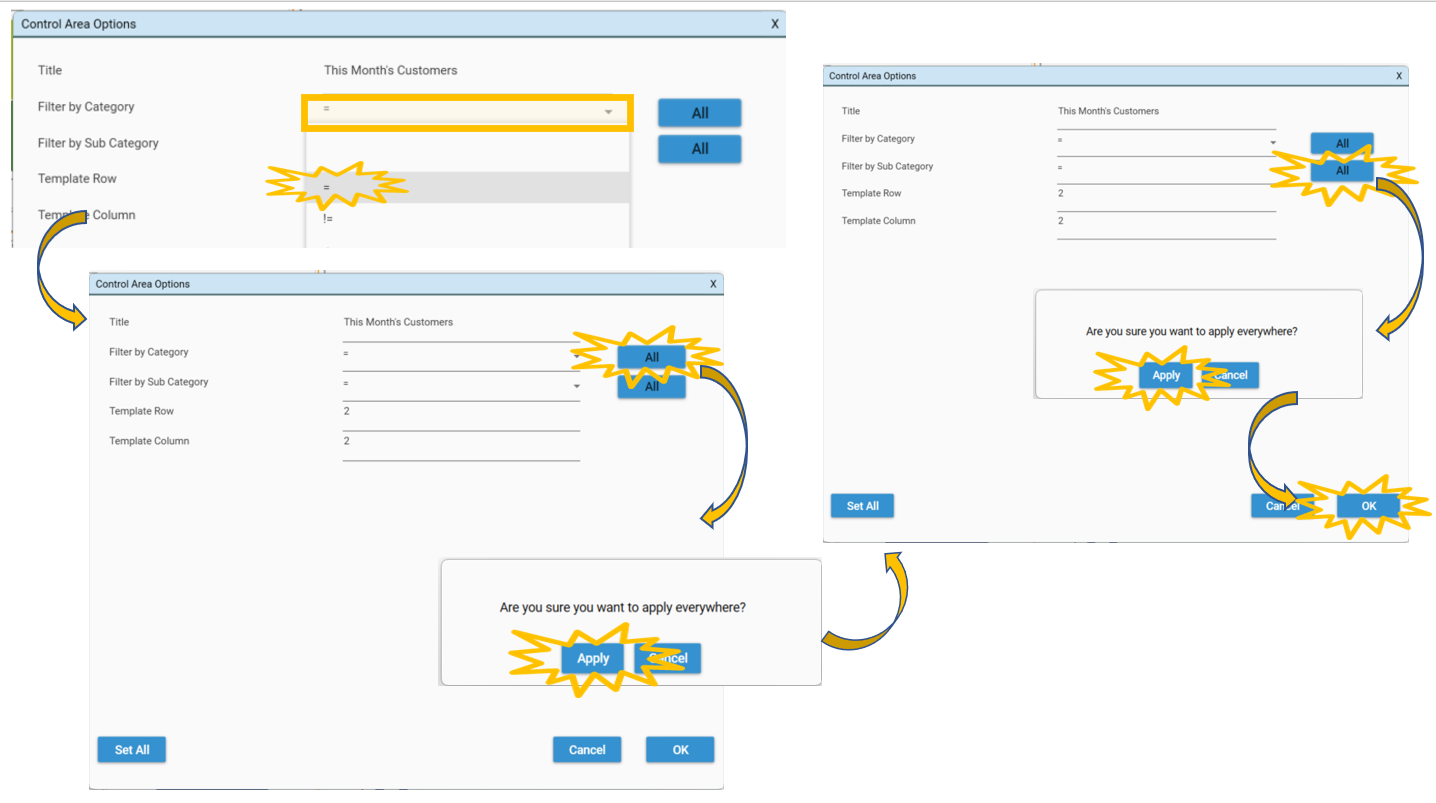
Select Configure and the Control Area Options Dialog will appear.
Set the operator for Category and the operator for Sub Category to equals (=).
Click the All button next to the Filter By Category dropdown. The message “Are you sure you want to apply everywhere?” will appear. Select Apply. This will apply the Category filter to all slots on the report.
Repeat the previous step for Filter By Sub Category
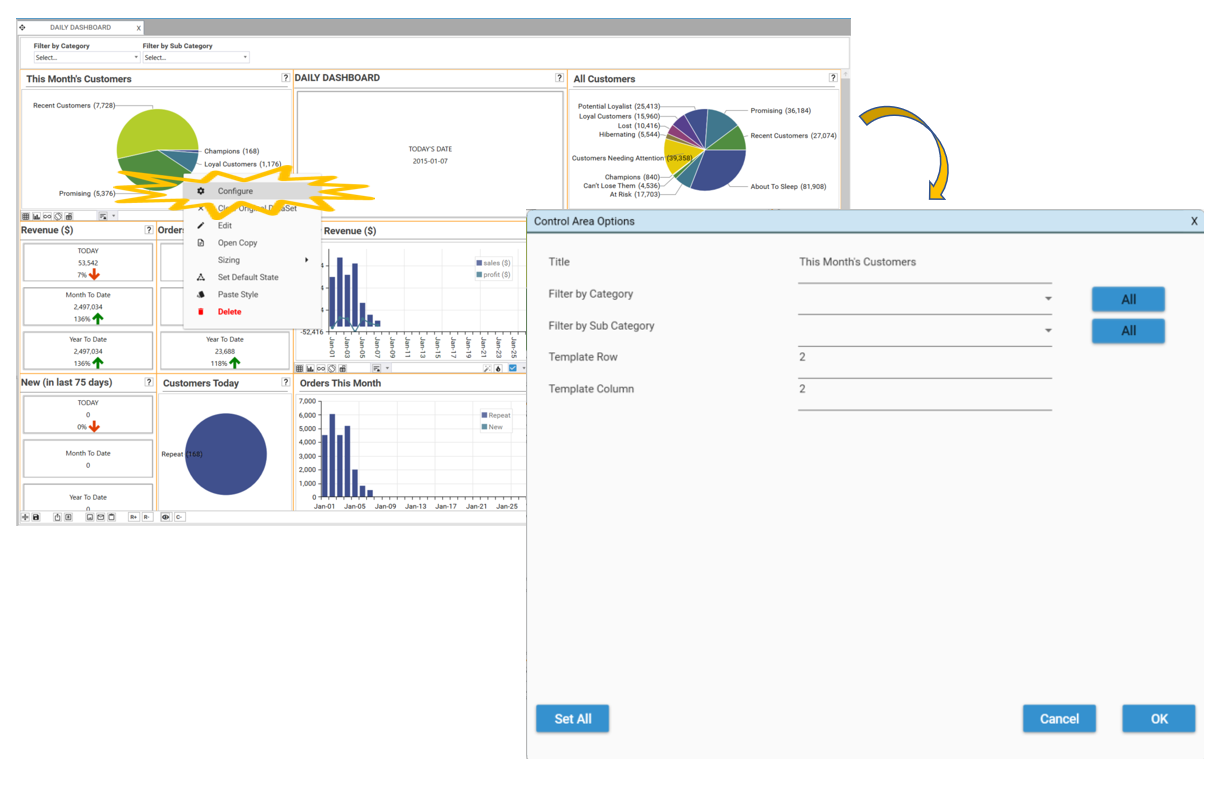
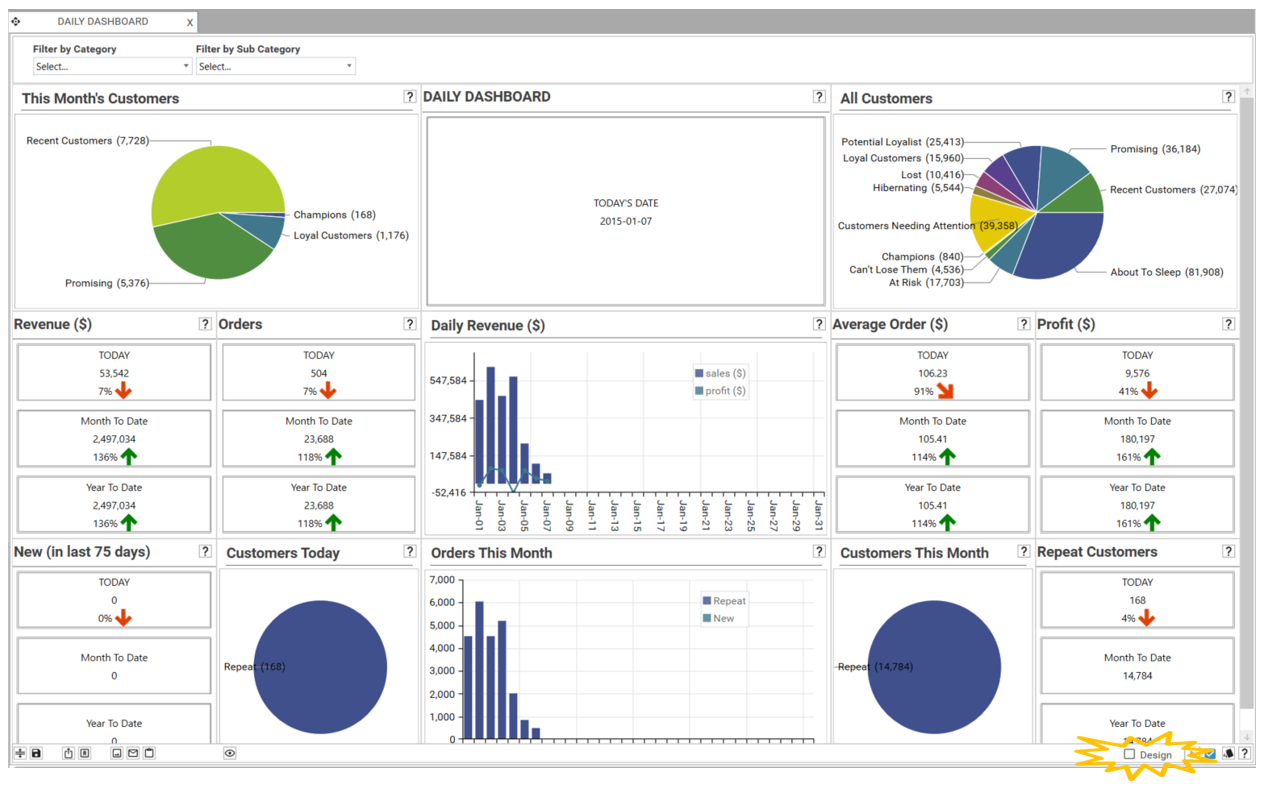
Once the filters have been applied change the Report back into View Mode by deselecting Design in the bottom right-hand corner.
The application of filters can now be tested.
Applying a filter
To filter the standardized report, select a value from one of the filter dropdown. The report will immediately recalculate.
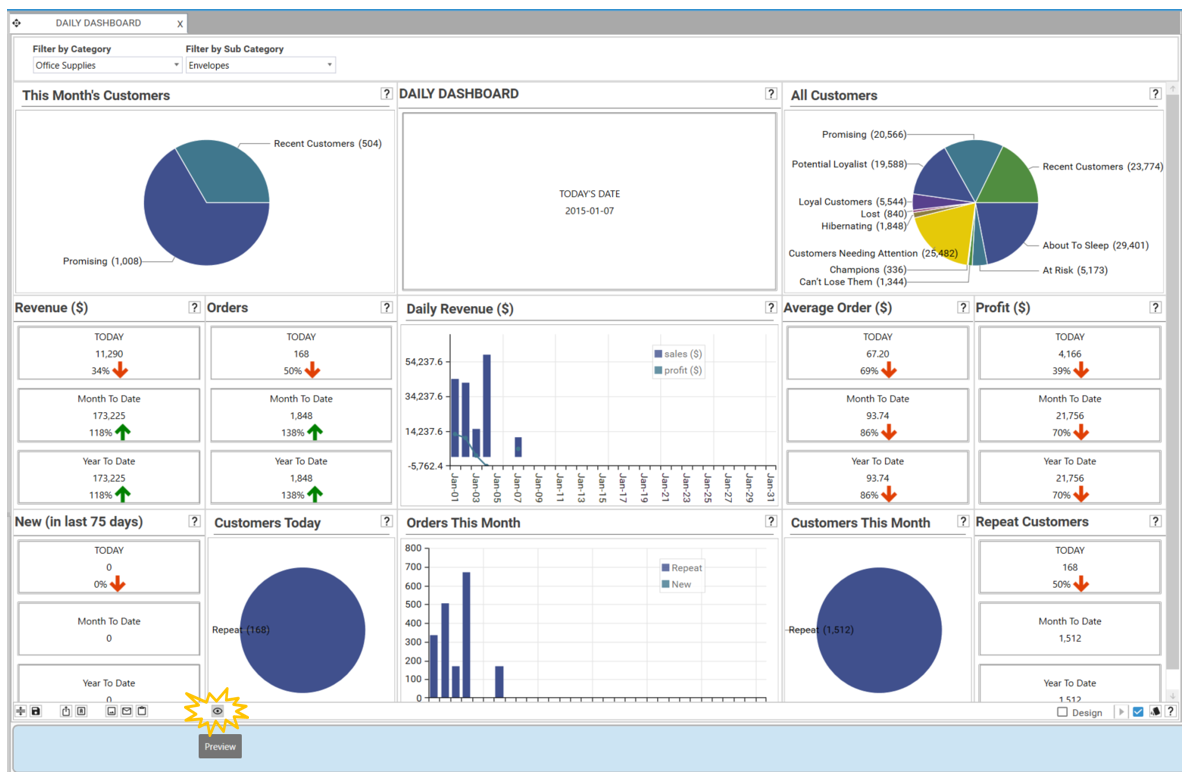
For example, to look only at Envelope sales, select the category of Office Supplies from the Filter by Category Drop down:
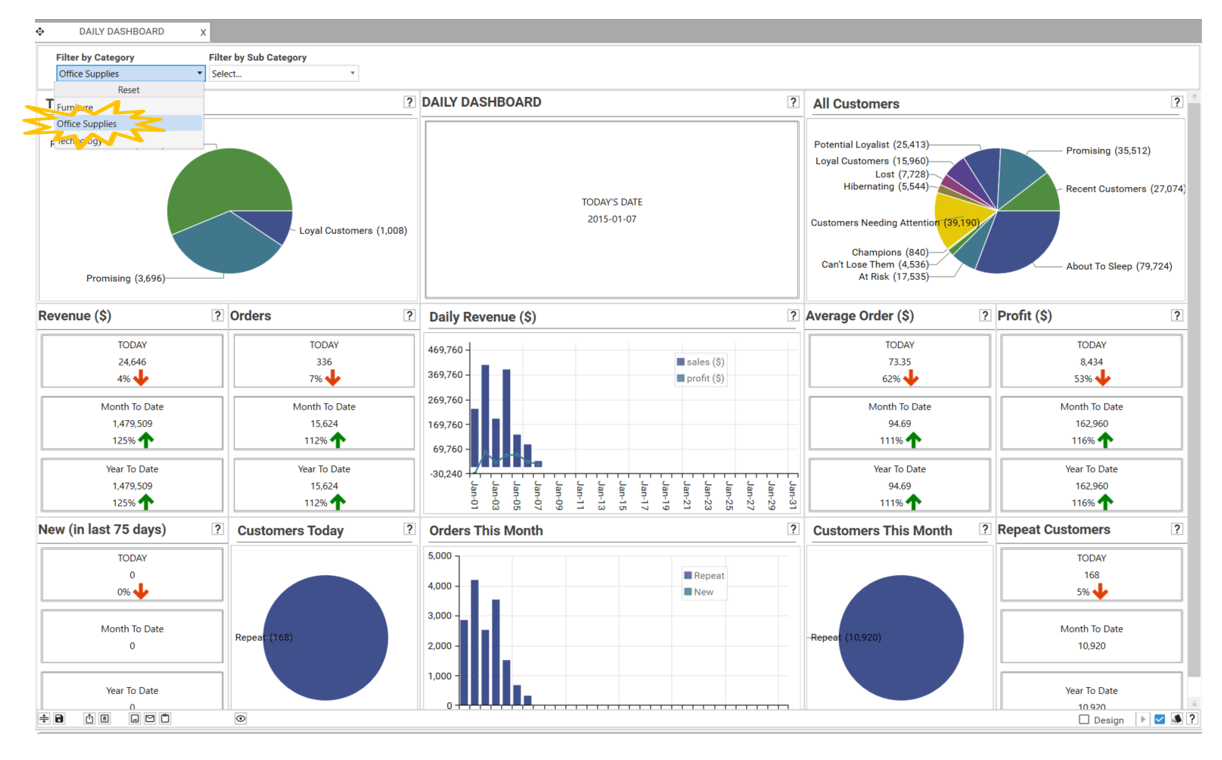
The report is now showing only data in the Office Supply category.
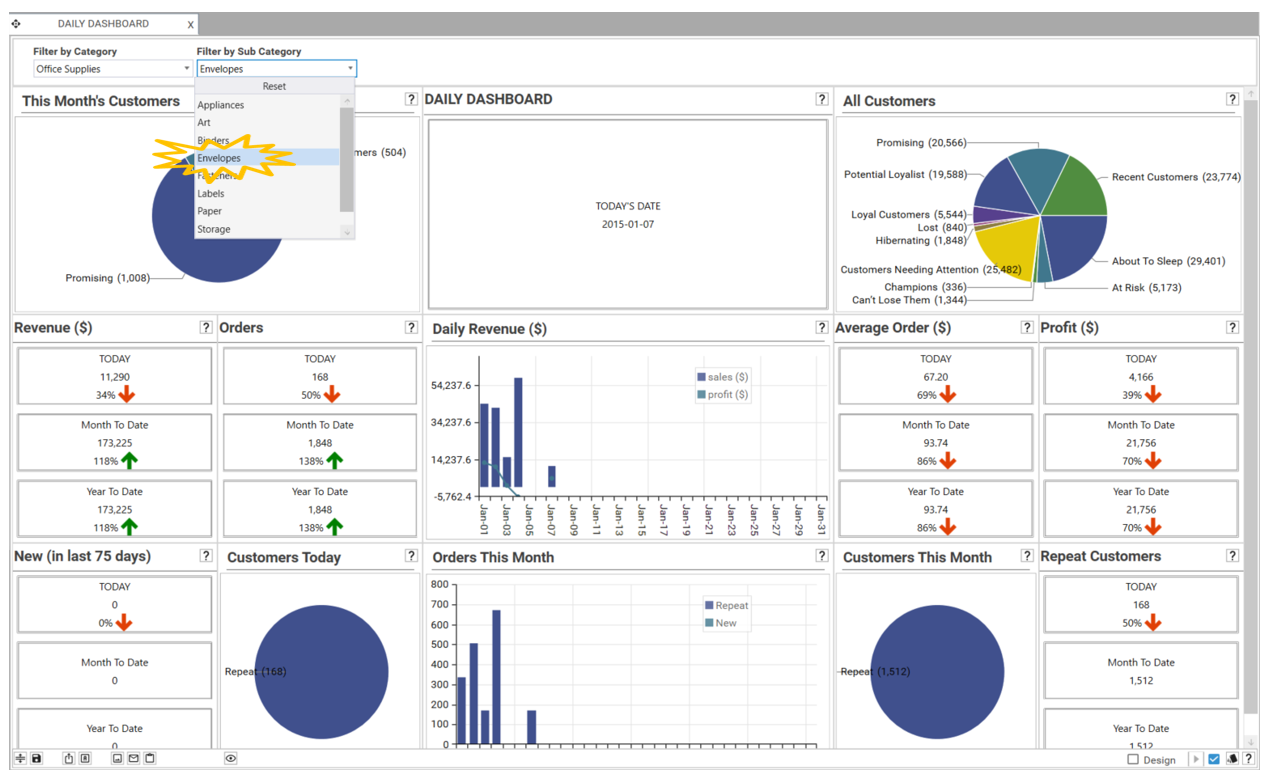
This can be further filtered by selecting a Sub Category of Envelopes:
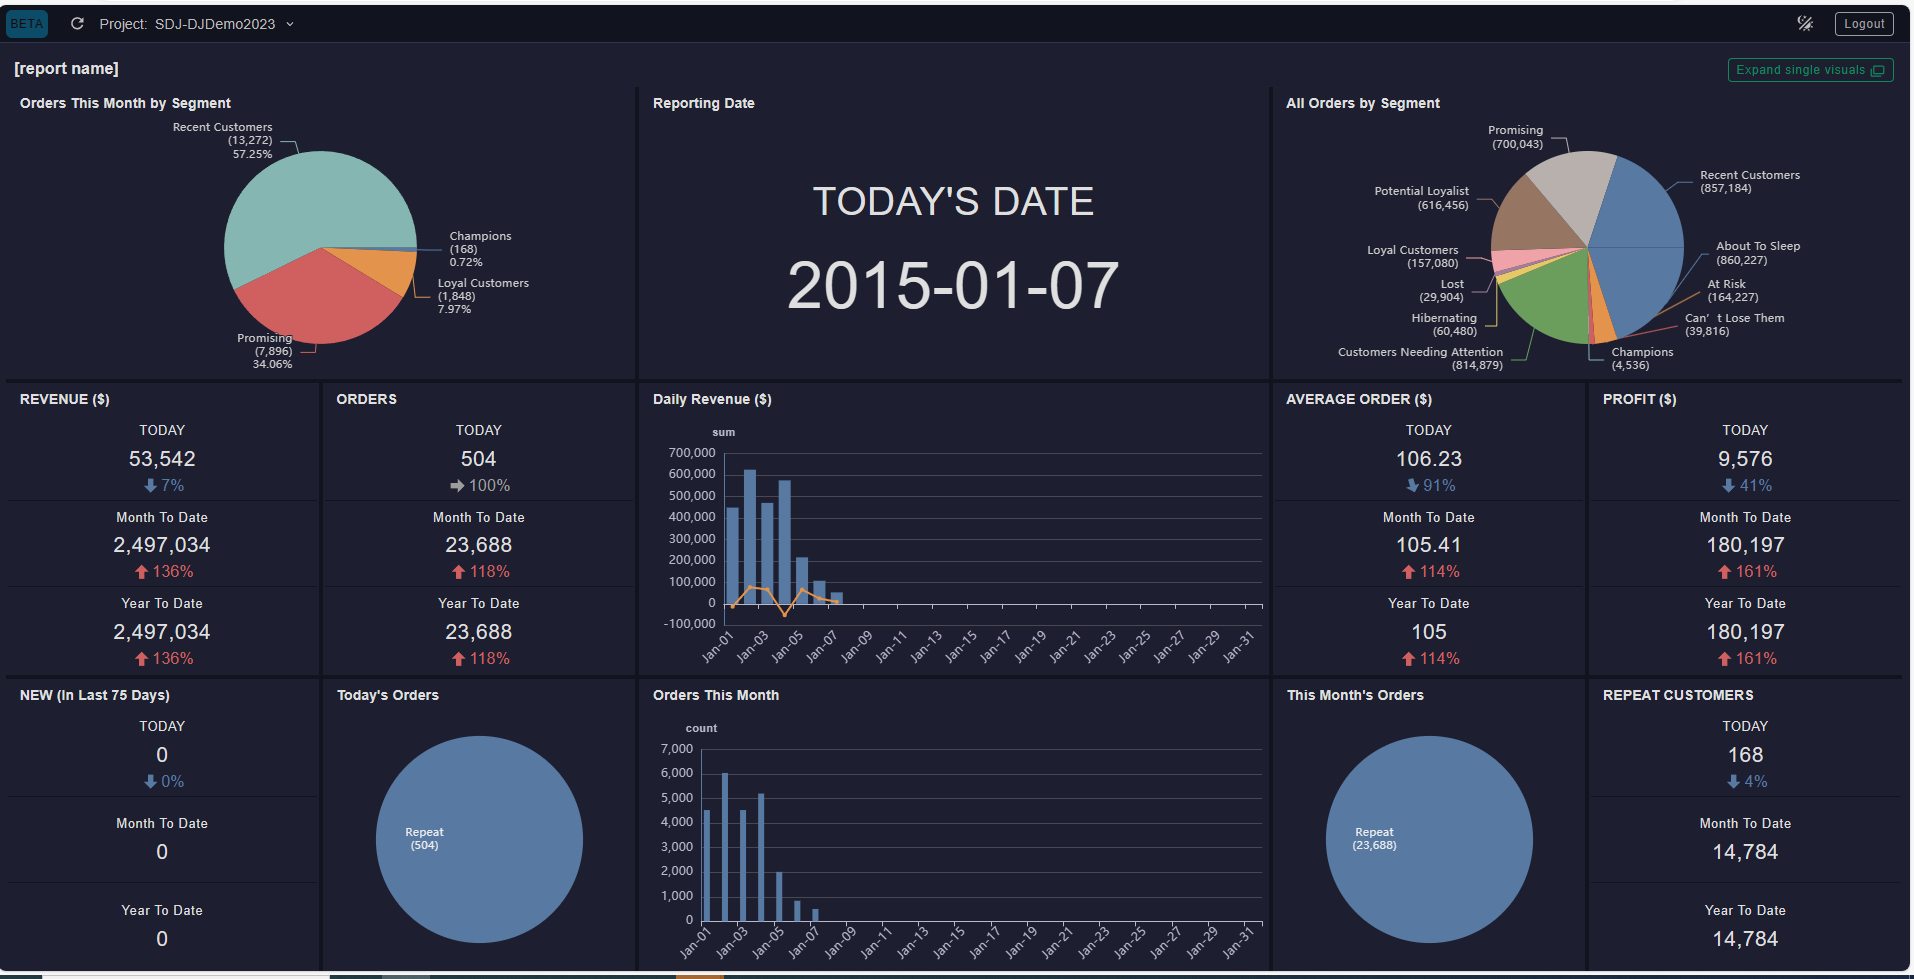
Viewing the Report in a Browser
The DAILY DASHBOARD is now complete and ready to be distributed. To preview it in the web app use the preview button:
