- The user is logged in to an active DataJet realm that contains the DJDemo2023 data (or data arranged in a similar structure)
- Demo Data (or data in a similar structure) has been loaded into a project and reporting tables have been created. See Step 3 - Create Reporting Tables if this has not yet been done.
- This step can be skipped if there is no requirement to create a dashboard that is filtered by products, or if the data already have a user-friendly format.
Approach
When building a dashboard, or any report that is designed to show data to other users, presentation is important as it drives understanding. The data we are working with have product data stored as codes. This section shows how to decode those data into user-friendly categories and sub-categories.
This section details how to:
- Decode fields by mapping source values to new values
Key Techniques
The following functional areas are introduced by this step:
- Custom Decodes from Excel definition files
Video Tutorial
Applying Decodes
The data in the Demo Database sales table contain some category data provided in the form of a code. To turn the data into a more human readable form we will "decode" them by mapping each source code to a new descriptive value. We are doing this so that later on, the final dashboard will be able to be filtered by specific categories and sub-categories.
However, decodes are more powerful than simple 1 to 1 mappings of values - they can be used to group multiple source values into useful higher level categories in a Many to 1 mapping.
For example a 1 to 1 mapping might look as follows:
- 1->Tables
- 2->Chairs
- 3->Sheets
- 4->Duvet covers
A many to 1 mapping on the same data might look as follows:
- 1->Furniture
- 2->Furniture
- 3->Bedding
- 4->Bedding
Decoding Sales Categories
We are going to begin by decoding the field [sales.sub category code], which is loaded from the Demo Database as numeric codes.
The field will be decoded twice, using 2 different decode levels:
- Category (Many to 1 mapping)
- Sub Category (1 to 1 mapping)
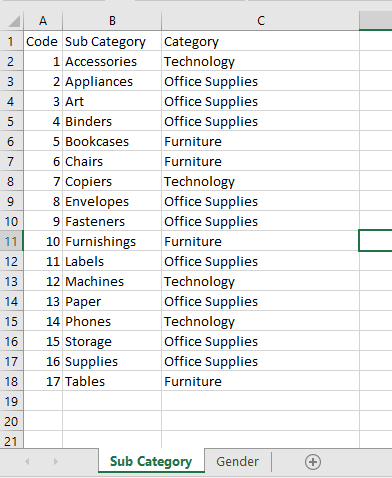
The decode file that is provided with the demo database looks as follows:
Category Decode - Many to 1 Mapping
To decode sales.sub category code to sales.category, do the following:
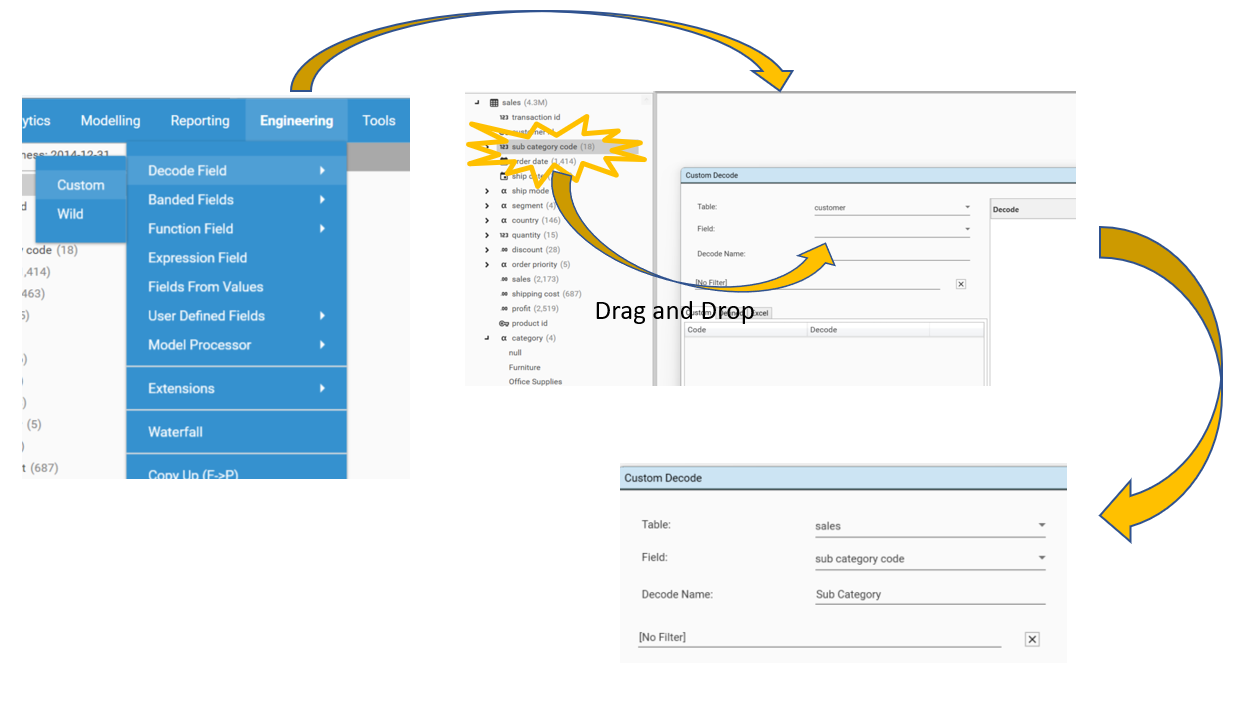
- Right-click on [sales.sub category code] and go to Engineering | Decode | Custom. The Custom Decode dialog will appear
- Name the decode "Category"
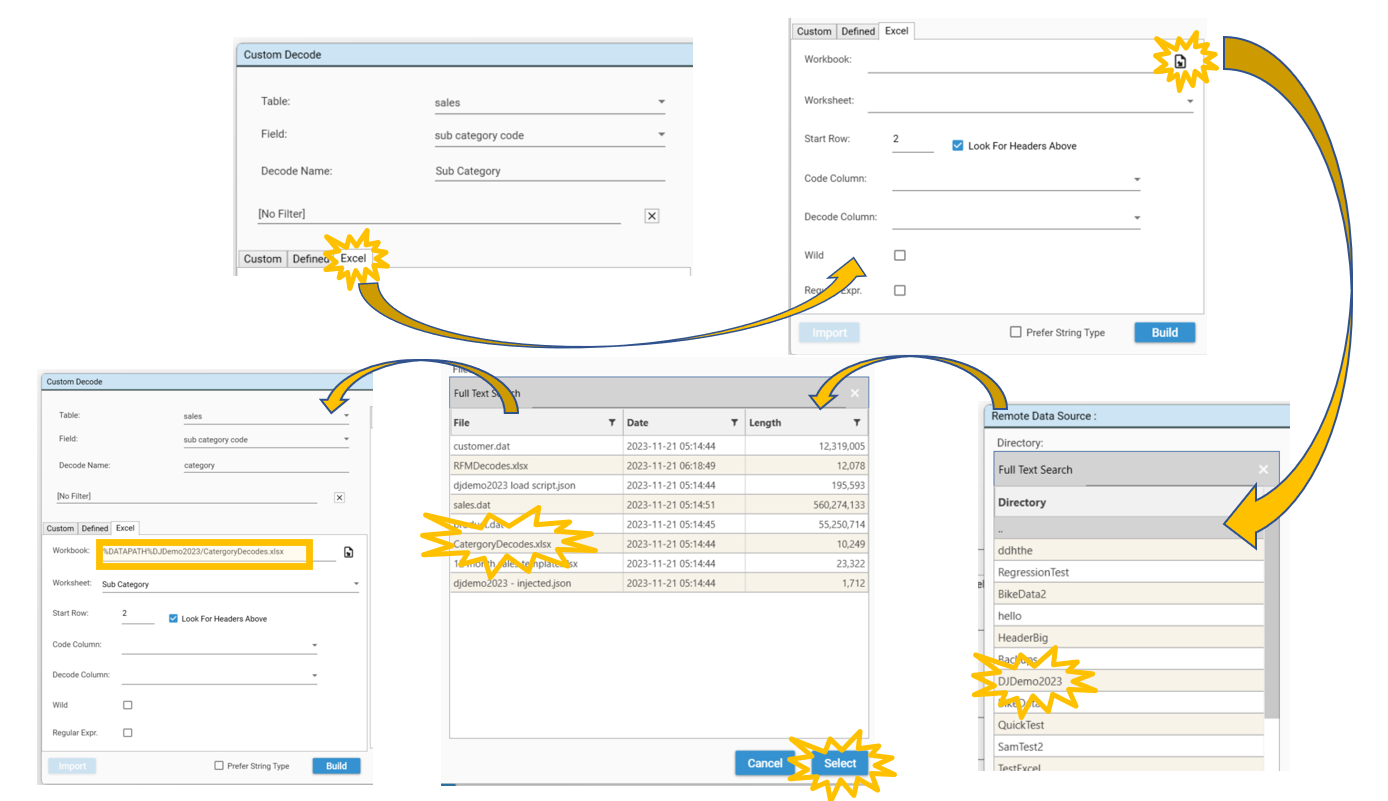
- Click on the Excel tab
- Click on the Workbook File Select icon and select the file Data Source/DJDemo2023/CategoryDecodes.xlsx
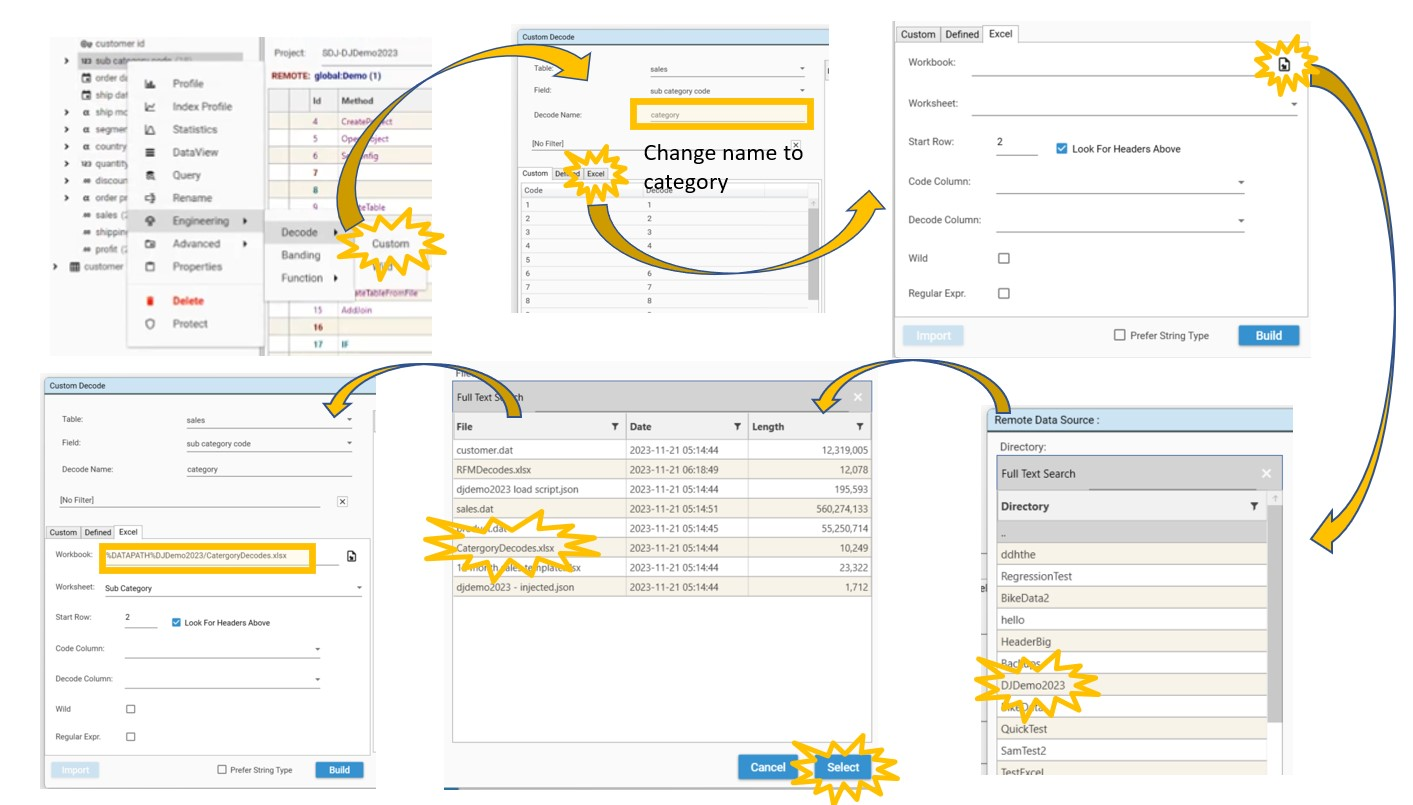
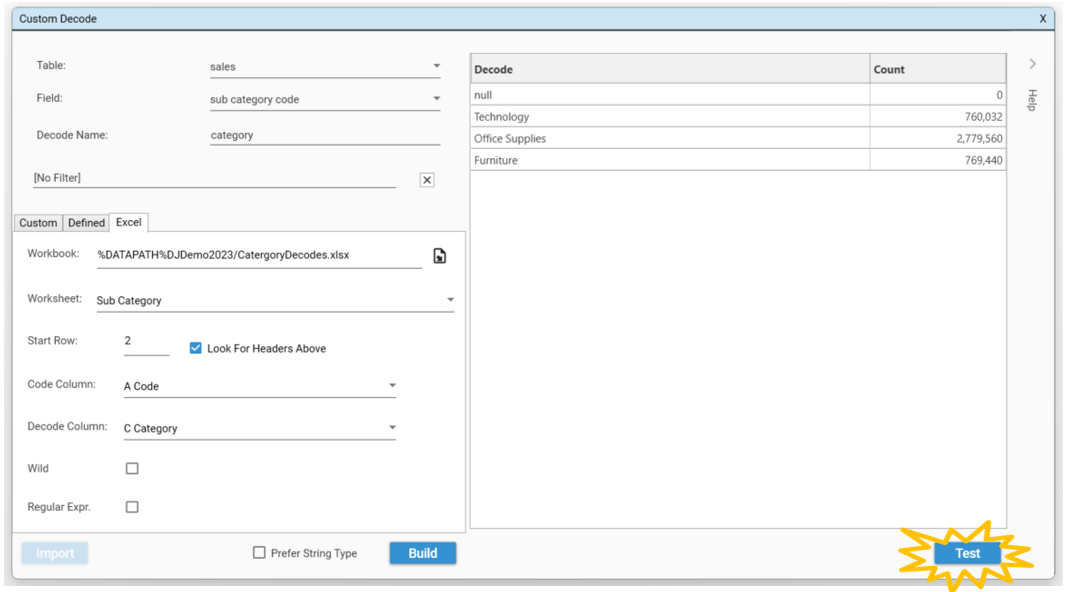
Once the CategoryDecodes.xlsx file has been selected, select Worksheet "Sub Category" (if it is not selected automatically).
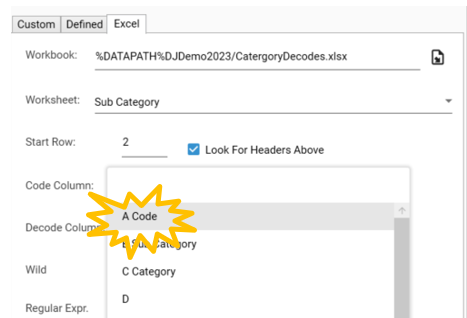
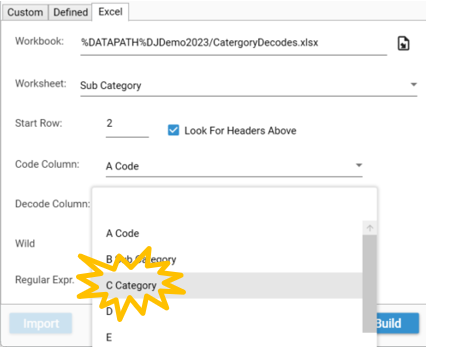
Now that the decode file has been assigned, we need to specify the lookup columns to use in the file. The Code Column and Decode Column drop downs will be populated with columns in worksheet "Sub Category"
- Code Column: This is the raw value, and should contain the values that are in DataJet in the column that is being decoded (sales.sub category code). For this example, Code Column is column A Code
- Decode Column: This is the decoded value (the descriptive value). For this example, Decode Column is column C Category
After completing these steps click the Test button to check that the Decode is correctly mapped:
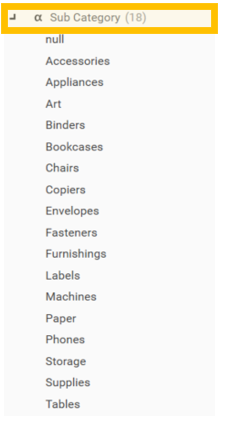
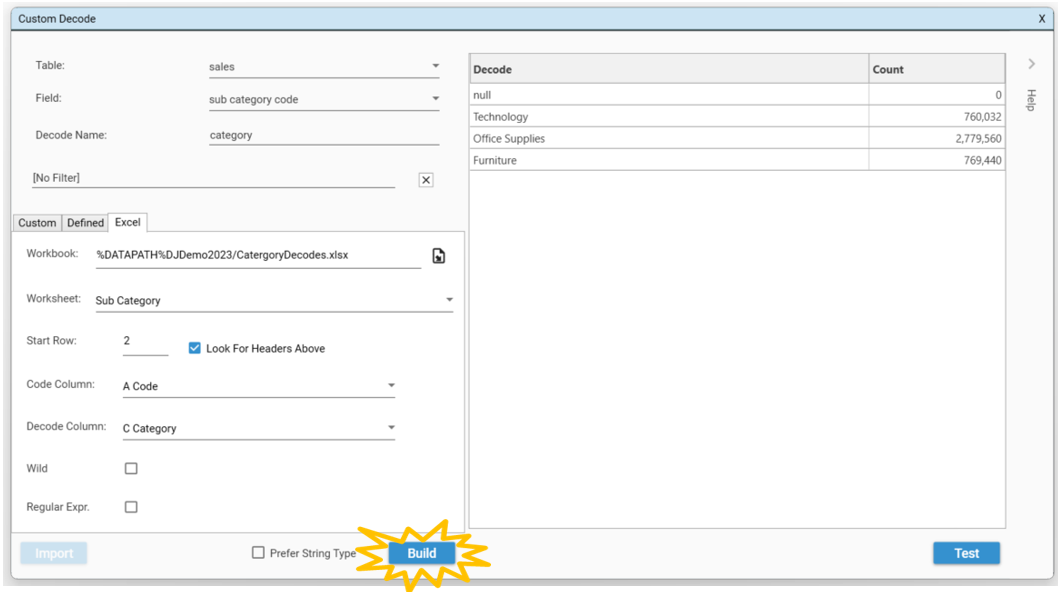
The categories: null, Technology, Office Supplies, and Furniture will appear with counts (as shown above). Here we can see that there are:
- 0 null records (i.e., records that are not mapped by the decode)
- 760,032 transactions of category "Technology"
- 2,779,560 records of category "Office Supplies"
- ...
Once the decode results have been verified, the new field can be created by selecting Build.
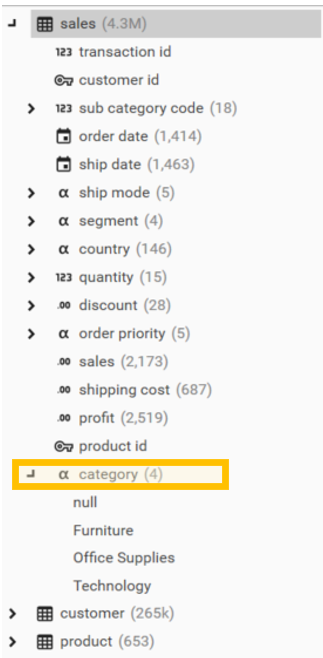
Once the build completes, the new field (category) will appear in the sales table in project explorer.
Decoding Sales Sub Categories (1 to 1 mapping)
For purposes of analysis, we will often use the higher level grouping of category, but sometimes we may require a greater level of detail, and for this a "sub category" mapping is required.
This time we will open the Custom Decode Dialog another way, go to Engineering | Decode Field | Custom and the Custom Decode Dialog will appear. Drag and Drop [sales.sub category code] into the Field box and the Custom Decode Dialog will update.
Assign the decode file by clicking on the Excel tab. Select a file to import by clicking the file select icon. Go into the DJDemo2023 folder and select the CategoryDecodes.xlsx Excel file.
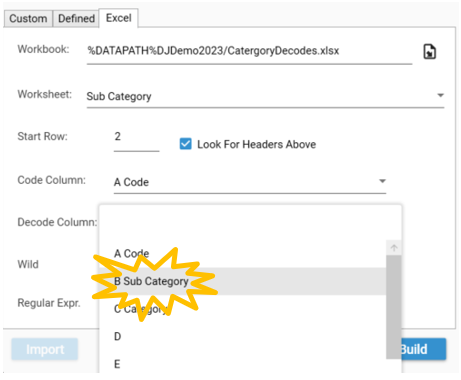
When decoding "sub category code" to "category", we selected "C Category" as the decode column. To decode the field to the sub categories, we select "B Sub Category"
- Code Column: This is the raw value, and should contain the values that are in DataJet in the column that is being decoded (sales.sub category code). For this example, Code Column is column A Code
- Decode Column: This is the decoded value (the descriptive value). For this example, Decode Column is column B Sub Category
The DATAPATH should appear for the CategoryDecodes file. Again for the Code Column select the input as A Code. But this time for the Decode Column select the output as B Sub Category.
 After completing these steps click the Test button to check that the Decode is running properly.
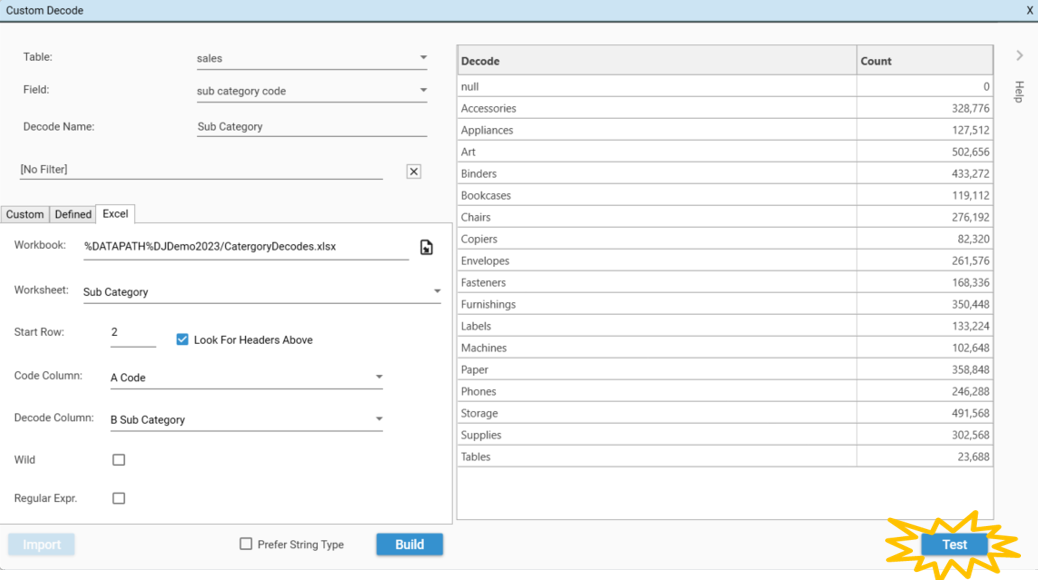
You will see the sub categories appear with counts (as shown above). After verifying the mapping, select Build to create the field.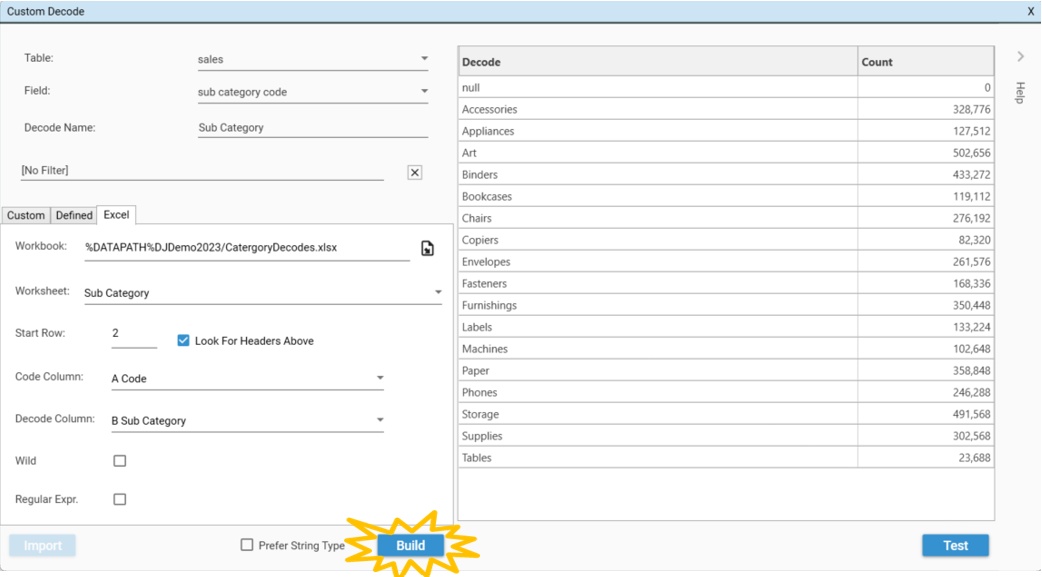
A Sub Category field will appear in the sales table in project explorer.