It is possible to interact with all components in a dashboard, both to change the data that the dashboard is summarizing, and to extract useful data from the dashboard ready for further action.
This overview covers the following:
<<TODO - Video - Interacting with Dashboards>>
Dashboard Filters
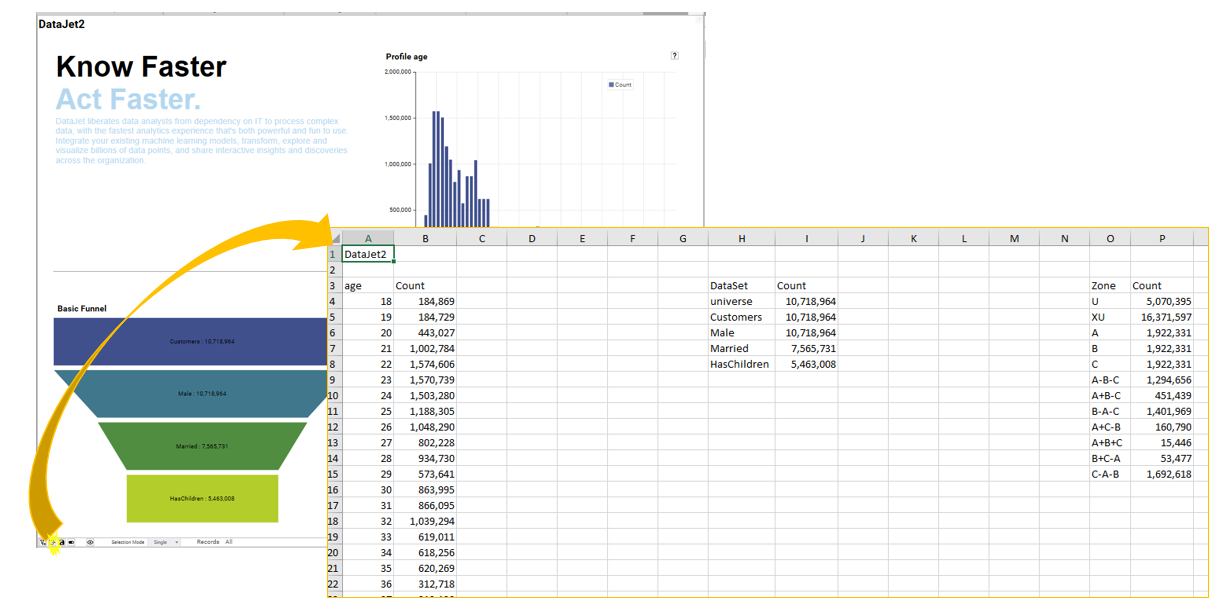
A filter can be applied to the whole dashboard by applying a dataset at the dashboard level – this will restrict the records that are being summarised by the dashboard according to the dataset rules. This filter will be applied to each component in the dashboard, unless a component has been set up as a Static Slot.
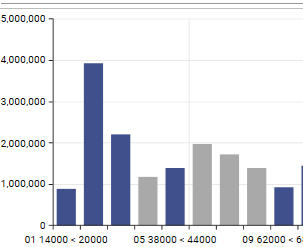
The following shows how the number of customers in all 3 top RFM deciles goes from 15,446 to 7,383 when a filter of Gender = Male is applied.
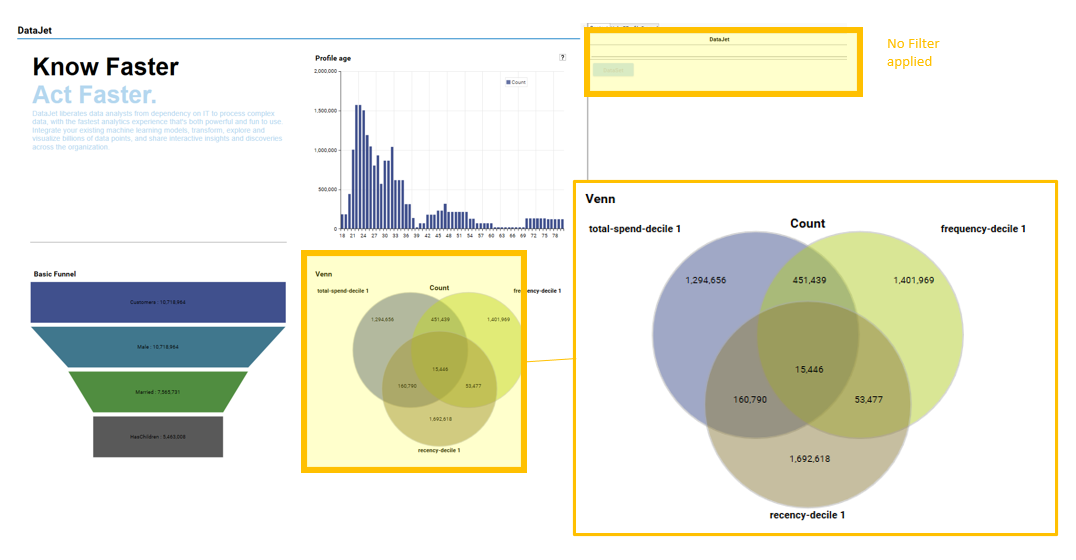 No Filter applied to dashboard
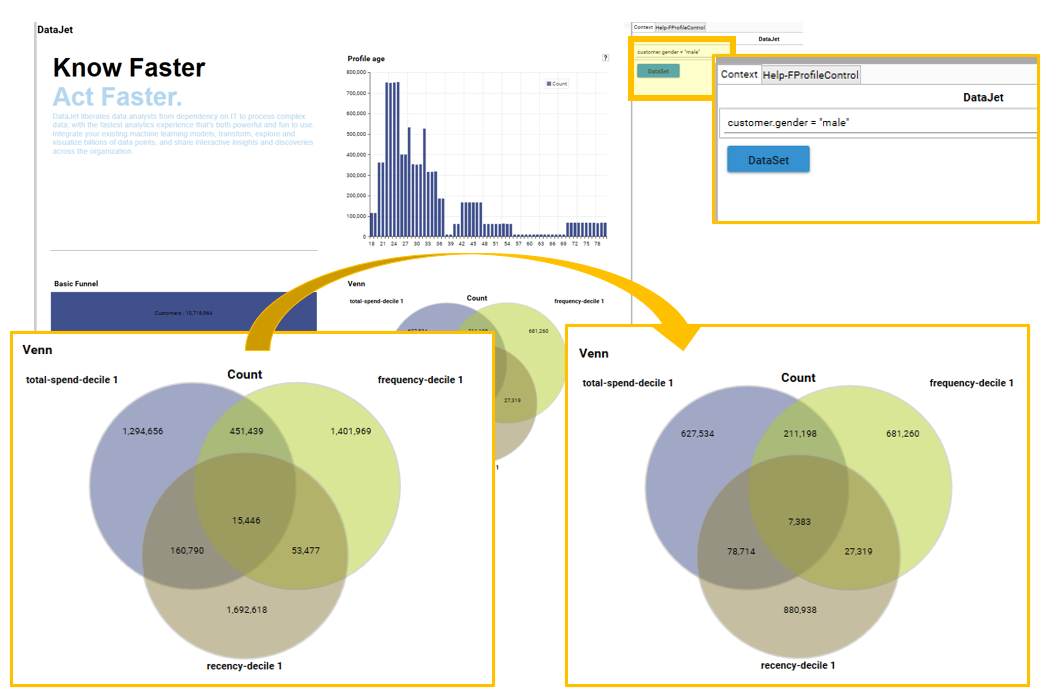 Filter applied to dashboard
<<TODO - Quick Snippet - Dashboard Filters>>
Adding a dashboard filter
To add a dataset as a filter to a dashboard, drag and drop a dataset from any of the following:
- Database Tree
- Dataset Tab
- Dataset Hotbar
- Context Panel
- An open Workspace Tab or Report
Dropping a dataset onto the dashboard will remove any dashboard filter that is already in place (including a Dataset that has been selected from the Dataset dropdown). The dropped dataset will then be applied as a filter.
Filter Logic
If the component has a filter applied at the component level (i.e, a filter was saved with the individual component report), then the dashboard filter will be ANDED to the component filter. The slot will display data that is in both the component dataset AND the dashboard dataset.
Consider the following:
Component | Component Filter | Dashboard Filter | Component Data |
1 | None | Quarter=2 | [Quarter = 2] |
2 | Gender=M | Quarter=2 | [Gender = m] AND [Quarter = 2] |
3 | Spend = Quartile2 | Quarter=2 | [Spend=Quartile2] AND [Quarter = 2] |
For more details on combining datasets, see Deep Dive - Understanding Dataset Manipulation.
Viewing a dashboard filter
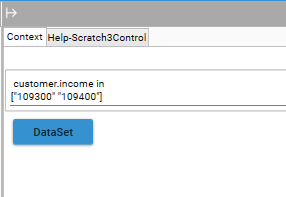
To view the filter that is applied to the dashboard, expand the Info Panel and select the Context Tab. If a filter has been applied, the full query details will be displayed in the panel:
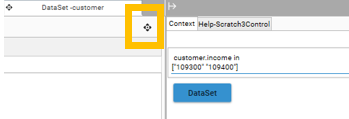
Details of the dashboard filter can be obtained by clicking on the context panel and selecting Dataset. To obtain a copy of the records in the dataset, use the Dataset drag icon to drag the Dataset into the Dataset Hotbar:
<<TODO: Quick Snippet - viewing a dashboard filter>>
Removing a dashboard filter
If a filter is applied at a dashboard level, it can be removed by using the clear filter button on the micro-toolbar:
Once the filter is removed, the dashboard will automatically recalculate. To confirm the dashboard filter status, open the Info Panel and view the Context tab.
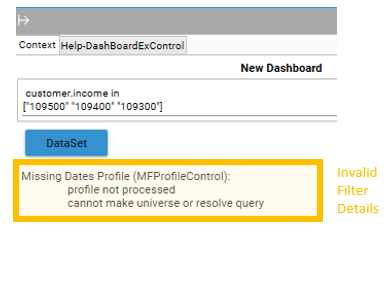
Invalid Filters
It is possible to add invalid datasets to a dashboard. A Dataset is invalid if it comes from a table that is missing a relationship with the data from one or more components on the dashboard. If the Dashboard filter is not valid for one of the dashboard components, the slot for that component will be empty, and details of the missing relationship(s) will be listed in the Context Panel:
To remove the invalid DataSet from the dashboard, right-click in the Dashboard and choose Clear Filter.
Alternatively, review the data model and create any missing keys and joins between the relevant tables. Re-opening the dashboard will then recalculate the Dashboard using the revised Data Model.
Clearing a filter from an individual component or report in a dashboard
To clear a filter that has been applied to an individual slot, do the following:
- Put the dashboard into design mode
- In the slot which requires changing, right-click and choose Edit Report
- Use the Clear Filter option in the resulting floating workspace tab to clear the filter
- Save changes and close
Static and Dynamic Slots
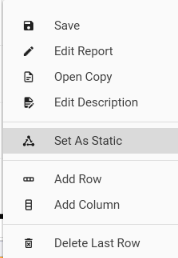
A dashboard consists of multiple slots, with each slot containing a component or report that visualises or displays data. By default, each slot on a dashboard is Dynamic. This means that when a filter is dropped onto the dashboard, the filter is applied to the content of the slot. However, not all dashboards require a dashboard filter to be applied to every slot. To configure an individual slot to ignore dashboard filters, in design mode, use the slot's Right-Click | Set As Static option:
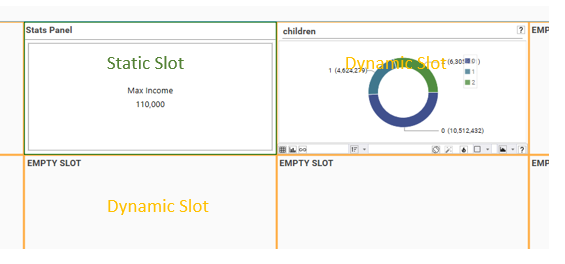
In design mode, Dynamic slots have an Orange Border. Static Slots have a green border:
Changing the content of a slot will revert the slot to the default Dynamic Slot status. Resizing a slot does not change it's dynamic/static status.
Dataset Collections
Dashboards can be distributed with a pre-determined set of filters that allow different views to be created from the same dashboard. This is achieved via use of Dataset Collections.
<<TODO - Quick Snippet -Dataset Collections>>
Creating a Dataset Collection
To create a Dataset Collection:
- Select Engineering | Dataset Collection Builder
- Go to Dataset Tree Tab, select collections, right-click and choose Add Collection
The Create Dataset Dialog will be displayed:
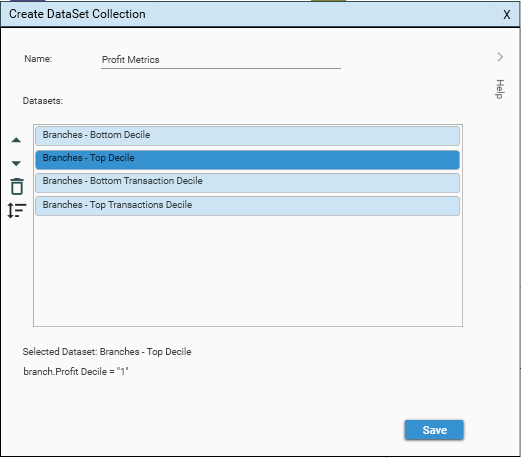
To build a collection, drag and drop datasets from any of the following:
- Database Tree
- Dataset Tab
- Dataset Hotbar
- Context Panel
- An open Workspace Tab or Report
Right-click on dropped datasets to rename them.
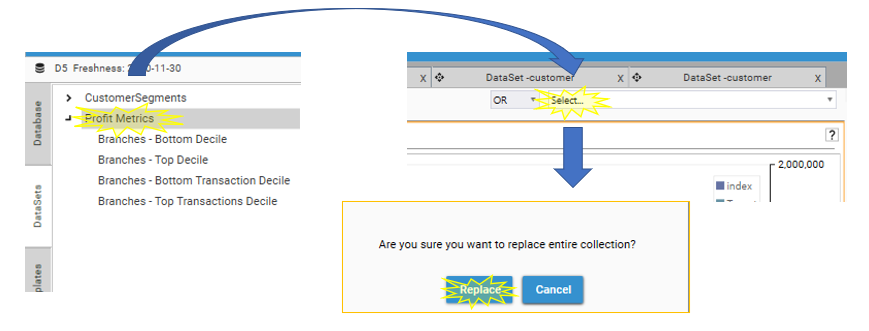
Adding a Dataset Collection to a Dashboard
To add a Dataset Collection to a dashboard, drag the collection from the Dataset | Collection Tab, drop it onto the Filter Drop Down and choose Replace:
Configuring DataSet Behaviour
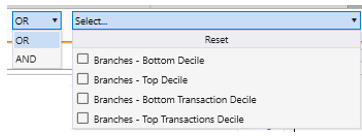
Dataset Collections have the following configurations:
| Single-Select | |
Multi-Select OR | Multiple Datasets can be selected. The dashboard will calculate for data that is in at least 1 of the selected Datasets. |
Multi-Select AND | Multiple Datasets can be selected. The dashboard will calculate for data that is in all of the selected Datasets. |
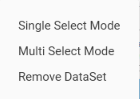
Use the Dataset Filter | Right-Click menu to choose Single Select or Multi-Select Mode or to delete the Dataset Collection from the dashboard:
Apply a Dataset to the Dashboard by checking or selecting the Dataset in the Dataset Filter dropdown.
Removing a Dataset Collection from a dashboard
DataSet Collections can be removed only when a dashboard is in design mode.
To remove the DataSet Collection, right-click in the Dashboard DataSet Dropdown and choose “Remove DataSet”
Exporting Data from Dashboards
Dashboard data can be exported to excel by clicking on the Export To Excel button in the micro-toolbar:
It is possible to export either to a blank workbook, or to a pre-configured template.
Dashboards are designed so that they can be created and executed as part of a server-side script (i.e, where no office products are installed, or where no UI is available). Data can also be exported from dashboards as part of a scripted process.
Exporting to a blank workbook
To export to a blank workbook, click the Export To Excel button. A file-system dialog will be displayed. Provide a filename and click Save. A prompt will appear asking whether or not to view the file.
<<TODO - Quick Snippet - Exporting Dashboards to a blank workbook>>
By default, exported data will be saved in the user's OUTPUT directory.
Drop Order
The order in which data is output to the excel file depends on the order in which components were added to the dashboard.
The first component (Drop 1) will be output first, the second component (Drop 2) will be output second etc.
The Drop order of components does not change even when components are moved around or when layouts change. This means that as long as the data is still in the dashboard, templates that expect component data to be in a particular location can rely on the data being there, even if the visual layout changes (see Exporting to a Template for more details on this).
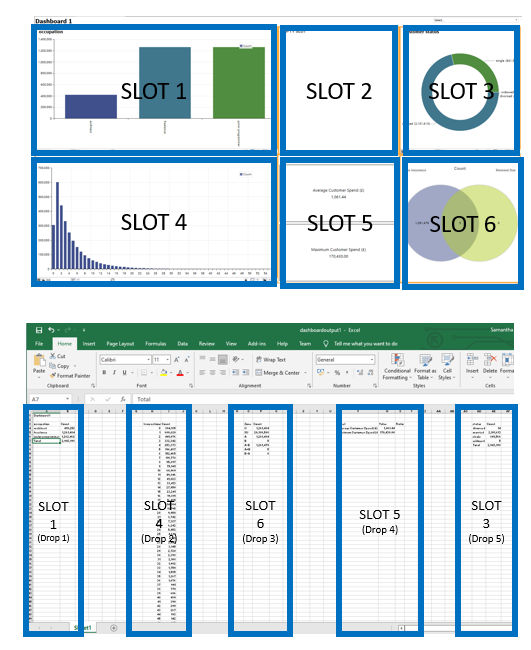
Dashboard Title | The dashboard title is output into cell A1 (R1, C1) |
Spacing | 5 blank columns are left between each individual component data grid. |
Slot Titles | Slot Titles are output to Row 2 |
Header Row | Header data is output into Row 3 |
Data Row | Grid Contents start at Row 4 |
Exporting to a template
Raw Data exports are available out of the box from either a browser or from the Explorer Dashboard.
In the event that visualisations need to be included in excel data exports of dashboard, templates can be configured and attached to the dashboard.
<<TODO - Quick Snippet - Exporting Dashboards to a Template>>
The template setup process is as follows:
- Create a Dashboard
- Export Raw Data to Excel (e.g., RawData.xlsx)
- Use Excel to configure the data and layout in RawData.xlsx, working out placement of data (if different to the standard) and adding visualisations as needed
- Save the modified Excel workbook (DashboardTemplate.xlsx)
- In the Dashboard, right-click and choose Template | Set
- Select the newly created template
- Select the data sheet
- Choose the start row for the output data (this is the row in which the dashboard title will be output)
- Choose SAVE
- From the dashboard, choose “Export To Excel”
- View the resulting Excel workbook to confirm the exported workbook looks as required
- Save the Dashboard. The configured template will now automatically be applied to any export of data from the dashboard, including exports from a browser.
- Be sure that the excel template has been set up to dynamically respond to the data that is output from the dashboard
- If using macros/named ranges etc, make sure that distribution policies and security policies allow macro-enabled workbooks to be used.
- It is often easier to keep visualisations and raw data on separate sheets
Updating Templates
Once assigned to a Dashboard, the Template is stored inside the Dashboard definition. To update the template used by the dashboard, the dashboard must be updated with a new version of the template using the Template | Set command, and the dashboard re-saved.
The template update process is as follows:
- From dashboard, choose Output to Excel and View the file
- Save the file with a new name (e.g., TemplateX_v1.1.xlsx)
- Make changes to the layout/visualisation of data in the new file and resave
- In Dashboard, choose Template | Set and select updated template file.
Any data output from the dashboard will now apply the updated template.
Exporting Dashboards as part of a script
Dashboard creation and export can be added to a scripted process by dragging the Dashboard report from the Report Tree and dropping it into a Script Editor script.
When the report is dropped, the following options will be available:
- Save
- Export
Select Export and a prompt will be displayed asking for the name of the export file:
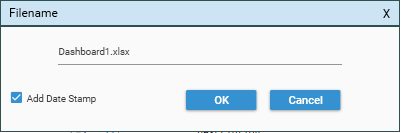
Select the "Add Date Stamp" checkbox to append the date and time to the export filename.
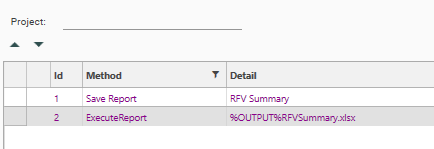
The JSON method name and the name displayed in script editor are not always the same. For example, "Save Report" is a user-friendly name for the AddToCollection method:
Method Display Name | Method Details |
Save Report | Method: AddToCollection The AddToCollection Method contains all the information used to recreate a dashboard and add it to the reports collection. NOTE: AddToCollection assumes that all data objects used by the dashboard already exist. If a required data object (for example a field or table or DataSet) doesn’t exist, the dashboard will still be created, and will still appear in the Report Tree, but it will have errors when opened. See AddToCollection for more details on configuring scripts to create dashboards. |
Export Report | Method: ExecuteReport ExecuteReport will calculate a dashboard and output its contents to the specified file. By default, data is output to the System Output Folder (i.e., System Variable %OUTPUT%) See ExecuteReport for more details on scripting the export of data from a dashboard. |
Selecting Records
Dashboards are interactive and allow segments and selections to be isolated for further analysis.
DataSets of underlying records can be selected from any profile, venn or funnel component in a dashboard, either by selecting segment(s) in chart(s) or by selecting cell(s) in result grid(s) and dragging into the DataSet HotBar:
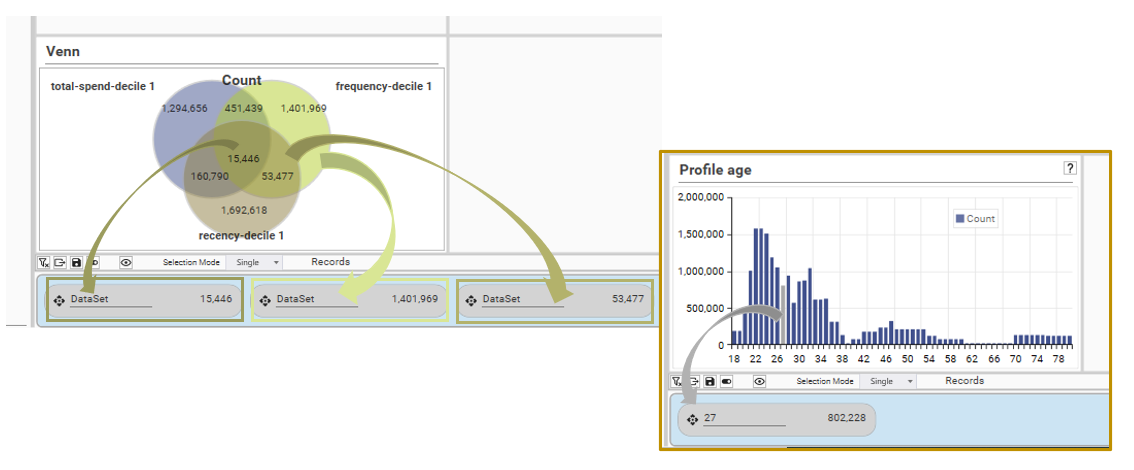
To work with the underlying records, use the DataSet HotBar Right-Click menu:
Choose Open Copy to see a DataSet View of the records. Choose Save to save the Dataset to the DataSet Tab. See DataSet HotBar for more information on working with the HotBar.
<<TODO - Quick Snippet - Selecting Data from a Dashboard>>
Resolution Table
The records in the DataSet will all come from the same table – this is known as the “Resolution Table”. So for example, the Resolution Table could be a customer table, a transaction table, a product table... If segments have been selected from multiple visualisations or results grids it is likely that records have been selected from different tables.
If valid relationships exist between all the selected tables, the records in the DataSet will be for the table containing the first segment that was selected.
Unconnected Tables
If one or more tables in the selection do not have a relationship, the query will not be able to resolve and the “…” symbol will be displayed in the resulting DataSet object:
Selecting the DataSet, right-clicking and choosing Open Copy will open a DataSet View that gives the details of the query. The failing query rule will have [...] in the count and totals column,
Depending on the source data, it may be possible to join Tables that are unconnected. See Engineering | Joins for more information on table relationships.
Choosing segments
Selectable Segments
Segments can only be selected from a Dashboard when it is in run-mode.
Highlighting Selected Segments
Selected segments are highlighted in grey for bar and columns charts:
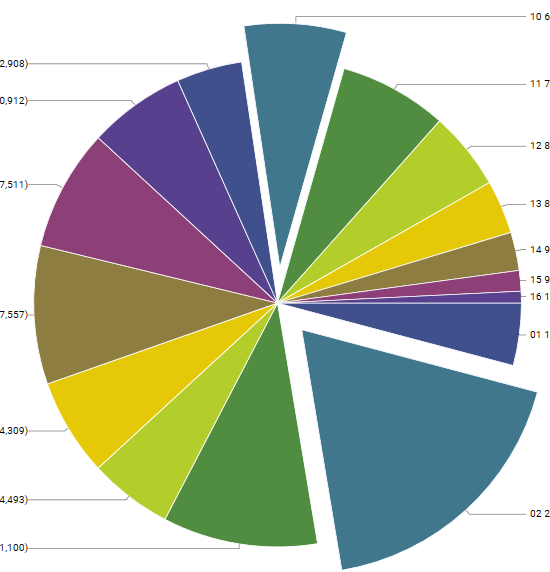
For pie charts, selected segments are expanded:
Selection Mode
- Multiple segments can be selected at the same time.
- Segments can be selected from one or more charts.
- The combining logic for multiple segments is determined by Selection Mode in the micro-toolbar:
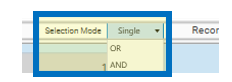
Single
The query will contain only records IN the highlighted segments of the active slot:
OR
The query will contain sub queries from all slots that have segments selected. The resulting DataSet will contain records that are in at least one of the sub queries:
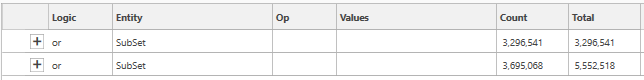
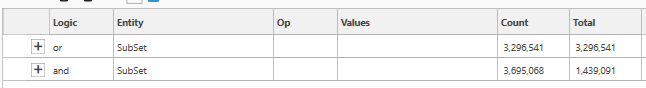
AND
The query will contain sub queries from all slots that have segments selected. The resulting DataSet will contain records that are in ALL of the sub queries:
Viewing Selections
The following methods are available for viewing query details:
- Drag and drop
- Highlight segments by clicking on them,
- Drag from the slot or dashboard to the DataSet HotBar to see an instant count.
- Query Details
- Hover over the DataSet to display a query tooltip.
- Right-click the DataSet and choose Open Copy to see more details of a HotBar DataSet,
- View Selected Data
- Click segments in the dashboard to highlight
- Right-click and choose View Selected Data
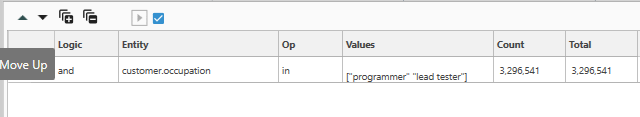
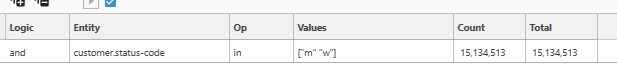
If choosing Open Copy or View Selected Data, a DataSet View Tab will be opened displaying the query details. Dashboard selections are made using the IN query command.
- Editing and Saving - In the DataView tab, queries can be edited and/or saved to the Database Tree.
- Adding to script - Saved Queries can be dragged from the Database Tree or the DataSet HotBar into a Script.
Verifying Selections
It is important to verify that selections made from a dashboard are as expected and that the selection options which have been applied are what is required.
- If Selection Mode = Single, the selection that is created will depend on the active slot – i.e., the slot where the right-click menu was viewed, or where the drag started.
- The order in which segments are selected can also affect the query results.