Overview
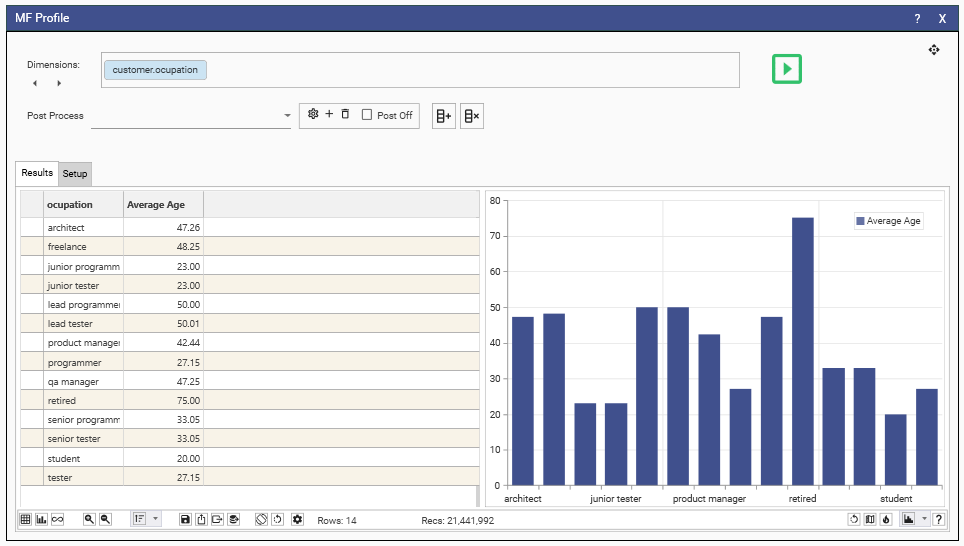
Multi Function Profile (MFP) allows the analysis and visualization of multiple measures against the same dimension space.
Open a new MFP from main menu Analytics.
Drop one or more fields into the dimensions box. This will form the vertical axis.
The horizontal axis (or columns) are created by adding measures.
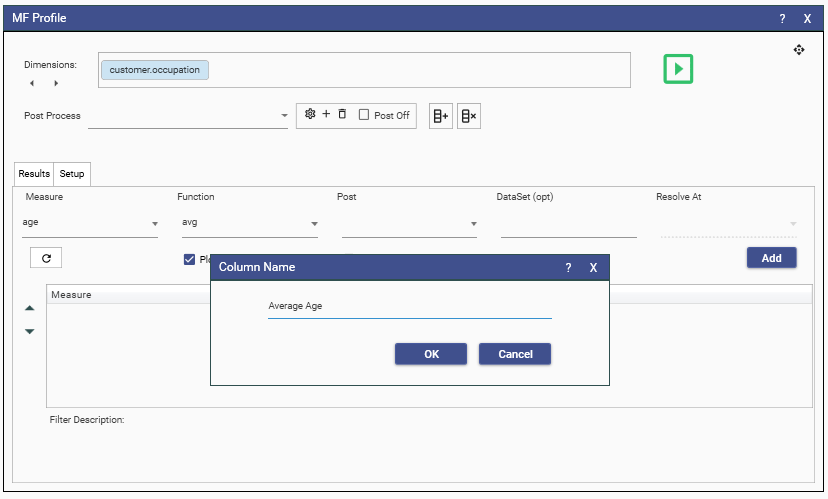
In the Setup tab,
- Selected a field from the Measure combo ( or drag a field onto the combo from the solution explorer).
- Select the function to apply to the field.
- Optionally select a post function, dataset and resolution level if the function is count.
- Click Add to add this measure, after entering a name for the column.
Once an entry has been added, it can be re-configured by right-clicking on it's row in the Setup grid.
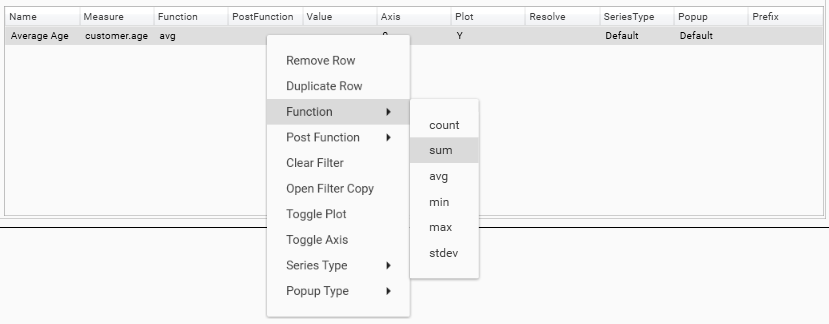
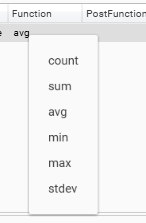
Or by left clicking on a particular cell in the row.
Double click on the name cell to edit the column name.
Drag a dataset over a row to add or replace the dataset for that measure.
Tip: Measures can be added by dragging a field directly onto the Setup grid, and using menus to finalize the configuration.
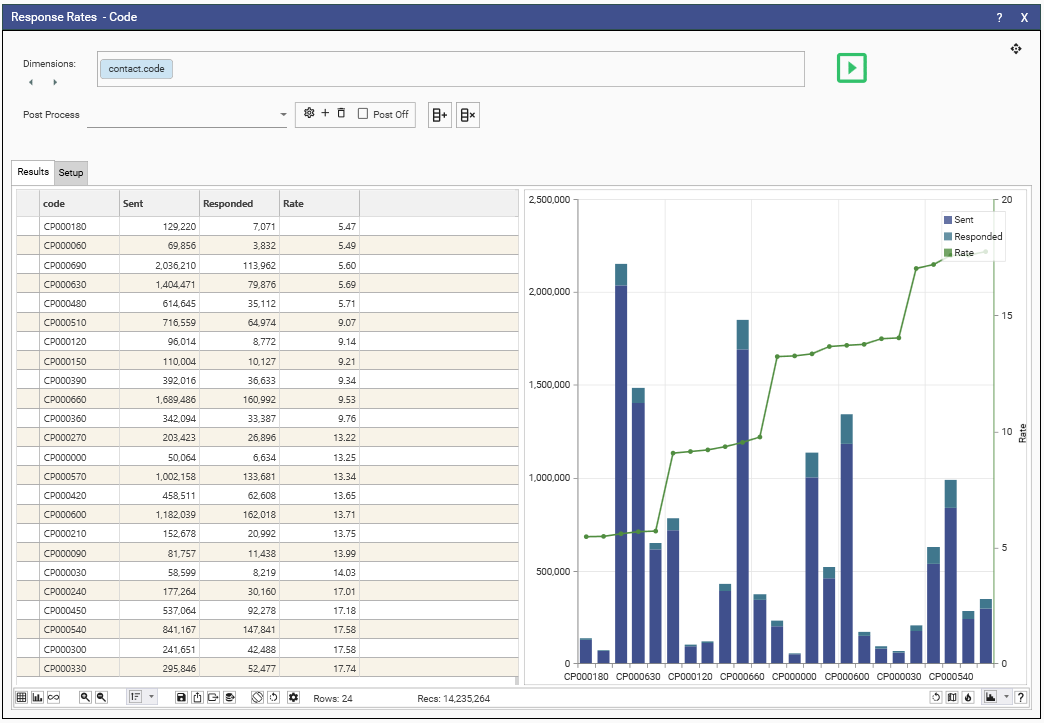
Once configured, hit the green run button to execute. This will switch from Setup to Display.
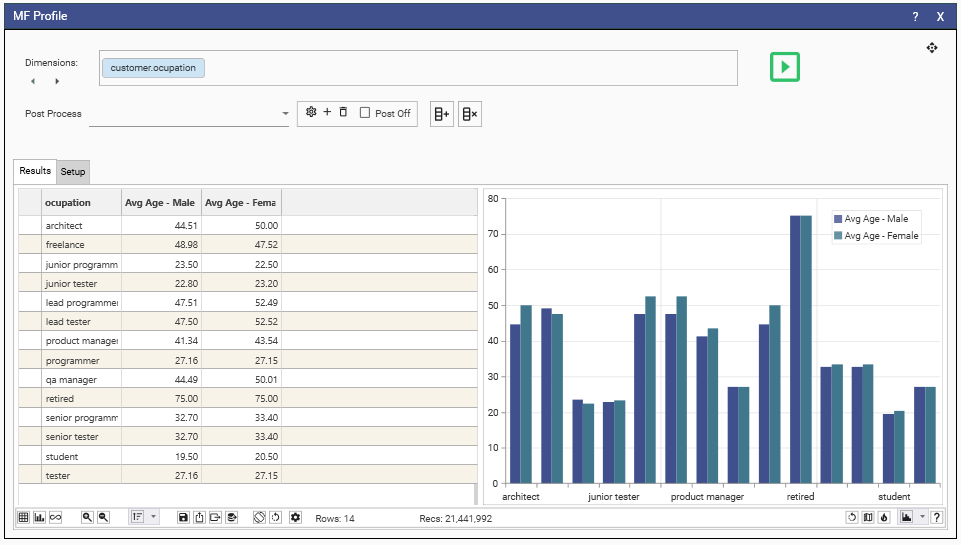
Switch back to Setup to add additional measures, or modify existing entries.
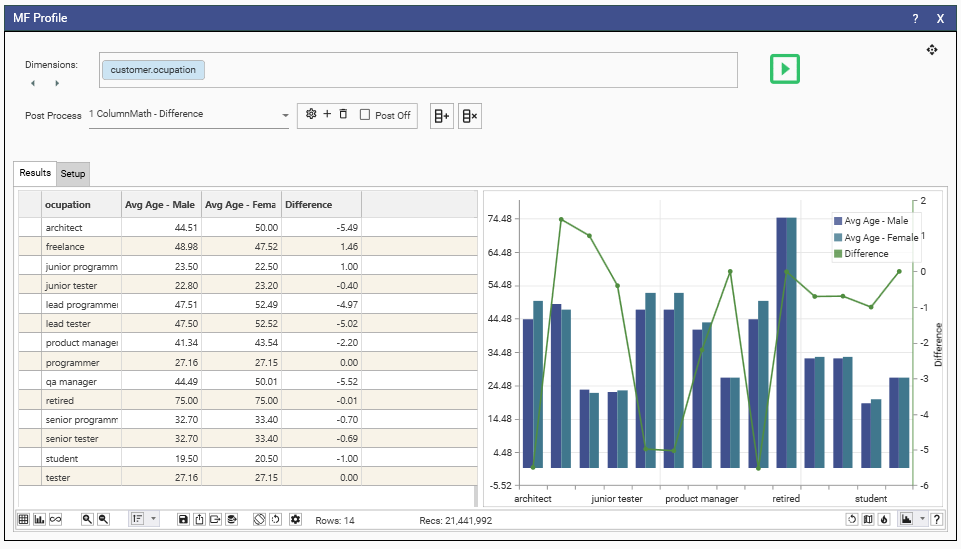
Here we have added a filter of gender = Male and renamed the first column, duplicated it and changed the filter and name to Female

Calculating
Calculated Columns
New columns can be added to the calculation by applying post-processing functions.
in Setup mode hit the + button in in the post processing section to add a new process.
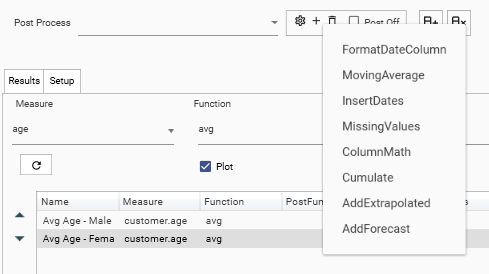
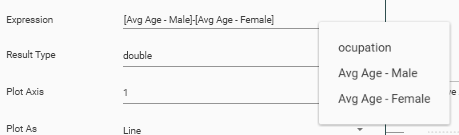
So, for example, selecting ColumnMath will open the configuration window for the new column.
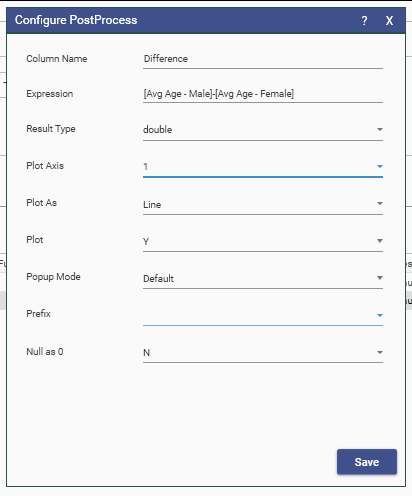
Here we have added a column that will calculate the difference between the 2 average age columns, and we will plot the value as a line on a second axis.
Tip: right-clicking in the Expression text box will open a menu of existing columns to help avoid typographical errors in the expression. Select from the menu to insert into the text.
Calculating
Templates
See Dashboard Overview - Interacting with Dashboards (exporting from dashboards) for details on how to export dashboard data using an excel template.