Multi-Function Profile
This section contains a functional reference of all Multi-Function Profile Report Functionality. For details on how to get started with multi-function profiles, view Multi-Function Profile - Getting Started and Multi-Function Profile - Quick Reference.
The Multi-Function Profile report is accessed via:
- Analytics | Multi Function Profile
- Tree-view Shortcuts
- Profile Report
Contents
- Introduction
- Report Layout and Structure
- Setup
- Dimensions
- Measures
- Calculation Options
- Right-Click Menu
- Modelling
- Post Processing
- Options Dialog
- Toolbar
- Drag and Drop
Introduction
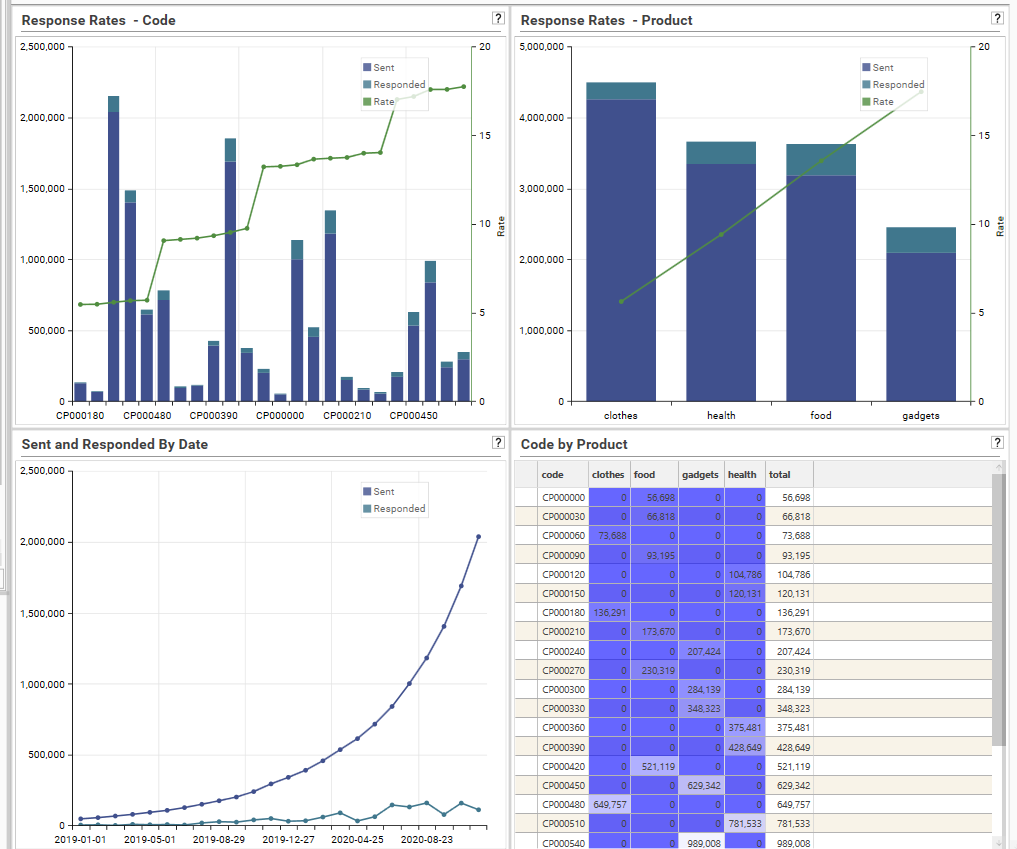
Multi-Function Profiles allow for the creation of interactive charts and data-tables that provide instant information about data, and are a key tool when engaging in data-discovery or exploration. They are similar to Profiles, but instead of working with a single measure and multiple dimensions, they allow multiple measures to be specified in the same report, and so allow for greater reporting flexibility.
A multi-function profile is a tabular or visual representation of grouped data. Row Labels and Graph Axis are controlled via dimensions, and data series, or columns, are controlled via measures.
Like profiles, multi-function profiles are concerned with the FREQUENCY of data – i.e., how often a particular value or result is found in the database, and are used to understand:
- The shape of the data – how are the data distributed?
- Identifying outliers and unusual patterns
- Exploring patterns over time
Note: If analyzing unrelated or overlapping groups of data, rather than data grouped into a single categorisation, consider using Query Matrix.
Report Layout and Structure
The Multi-Function Profile report has 3 views:
- Setup
- Results
- Detail
Setup
Setup view is used to configure report inputs:
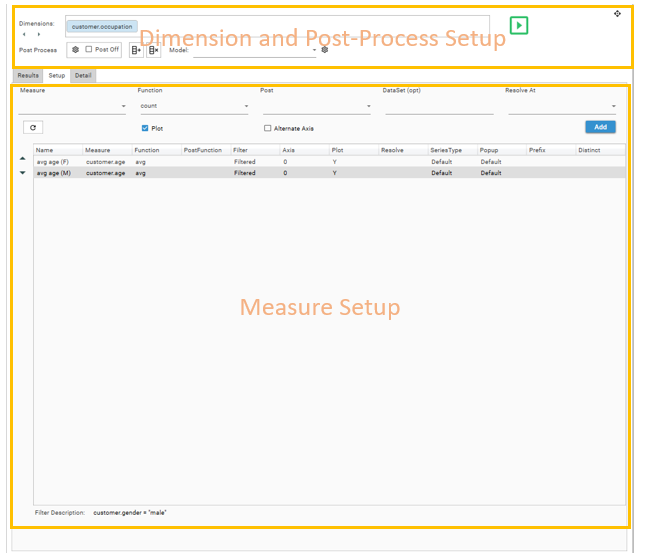
- Dimension Setup - specify rows to be included in the result set:
- Drop and configure report dimensions
- Measure Setup- specify columns to be displayed in the result set:
- Drop measure fields onto the grid or into the measure box
- Apply Functions, Post-Functions, filters, graph settings, resolution levels and other measure configurations
- Re-order and duplicate measures
- Post-Processing - specify calculations, models and manipulations to be applied to the result set returned from the profile engine:
- Configure Post-Processing calculations
- Apply modelling to report output
Click the Calculate Button to see the result set:

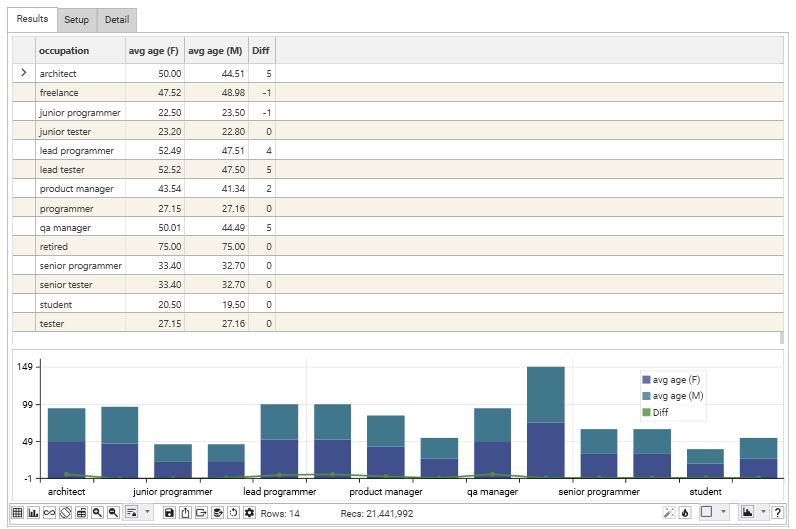
Results
The Result View consists of a result grid and a chart display. Control and layout of these sections is via the micro-toolbar.
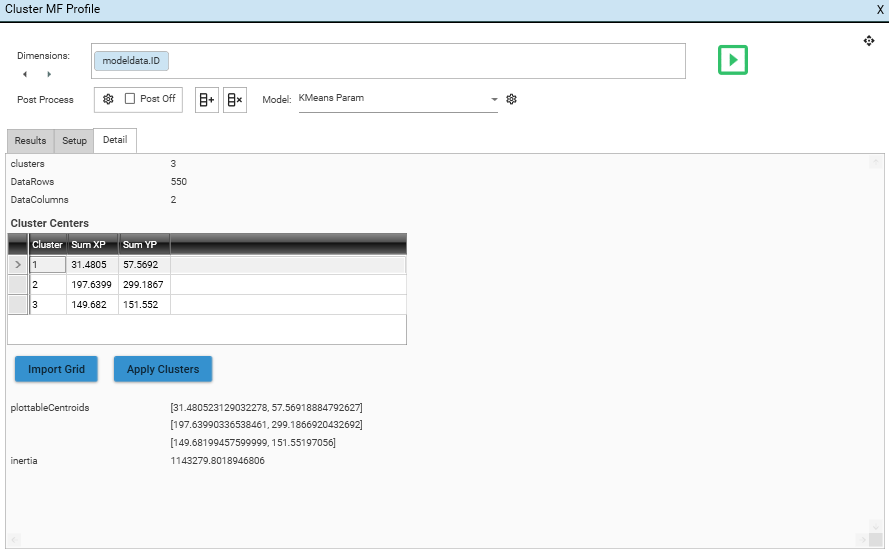
Detail
The detail view displays model output, if a model with extra output detail has been applied: