Multi-Function Profile
Used for:
- Summarizing, Visualizing, Counting, Frequency, Grouping, Aggregating, Cross-tabulating
- Modelling and Post-Processing of Result Grids
- Calculating and Displaying multiple measures in the same presentation
Quick Start:
- Drag a Field from Database Tree and drop into Dimension box
- Drag a measurable Field from Database Tree and drop into Measure grid
- Drop a Dataset onto the grid to use a subset of records
- Add more Dimensions by dragging and dropping more fields
- Add more Measures by dragging and dropping more fields into Measure grid
- Use IconBar to control graphs, views, sort order etc
- Click Configure icon to apply Post-Processes and use raw results in further calculations
- Select a Model to apply modelling to raw results
- Click cells, segments, bars and columns to select data and drag to DataSet HotBar
Functional Overview:
- Set up Vertical axis by adding one or more fields as Dimensions
- Set up Horizontal axis (or columns) adding one or more fields as Measures on the Setup tab.
- Refine and configure each measure individually – choose whether to plot or not, how to plot, which axis to use by right-clicking measure
- Filter the whole calculation by dropping a dataset onto the datagrid, and/or filter each measure individually by dropping filters onto the measure
- Configure the number of rows and columns, sort order, which values to include/exclude via the Settings button in micro-toolbar
- Choose whether to display grid, chart or both, and determine relative orientation
- Select chart type and control chart displays, legends, axes etc from Chart options button in micro-toolbar
- Select data from grids and charts and drag to HotBar for further analysis
- Post-Process data by creating new columns or applying models
- Change the column display order by moving measures up and down, copying, deleting, renaming and editing measures
- Add DataSet collections to provide multiple filters and views of results
- Configure templates to use when exporting results to excel
- Export Results to new tables or to file
- Add report to Dashboards
- Save Reports
- Recreate reports via scripts and distribute
See Multi-Function Profile for a full functional overview of multi-function profiles
Overview
Extendible, flexible visualisation
Multi Function Profile (MFP) allows the analysis and visualization of multiple measures against the same dimension space.
Simple visualisations can be created almost instantly, but the multi-function profile report also provides access to a huge range of functionality through various configuration options.
Post Processing
Post Processing functions, column math and models can be used to manipulate result grids. New models can be quickly developed or imported using the Discrete Model Processor for either python or R
Creating a profile
Open a new MFP from main menu Analytics.
Drop one or more fields into the dimensions box. This will form the vertical axis.
The horizontal axis (or columns) are created by adding measures.
In the Setup tab,
• Selected a field from the Measure combo ( or drag a field onto the combo from the solution explorer).
• Select the Function to apply to the field.
• Optionally select a Post Function , DataSet and Resolution Level if the function is count.
• Click Add to add this measure, after entering a name for the column.
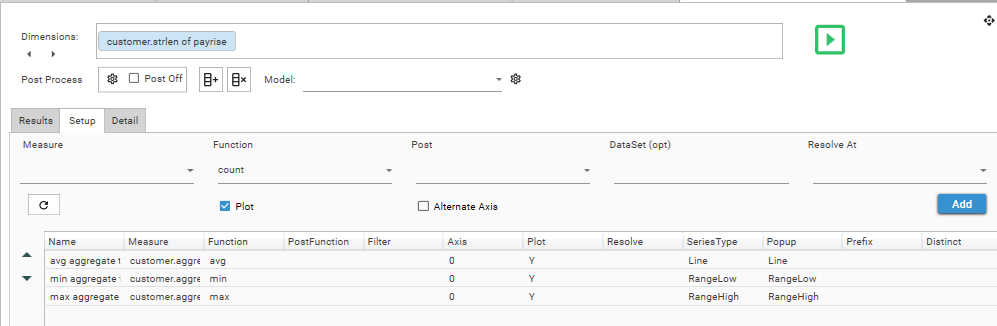
Once an entry has been added, it can be re-configured by right-clicking on its row in the Setup grid.
Or by left clicking on a particular cell in the row. 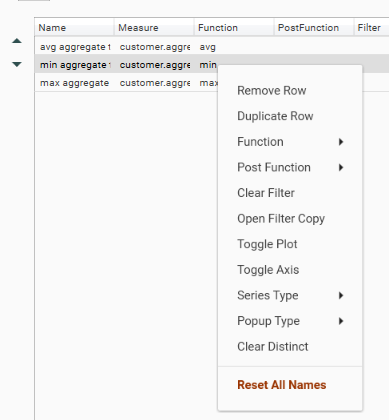
Double click on the name cell to edit the column name.
Drag a dataset over a row to add or replace the dataset for that measure.
Tip: Measures can be added by dragging a field directly onto the Setup grid, and using menus to finalize the configuration.
Drag a new measure over an existing entry to replace it.
- Once configured, hit the green run button to execute. This will switch from Setup to Display.
- Switch back to Setup to add additional measures, or modify existing entries.
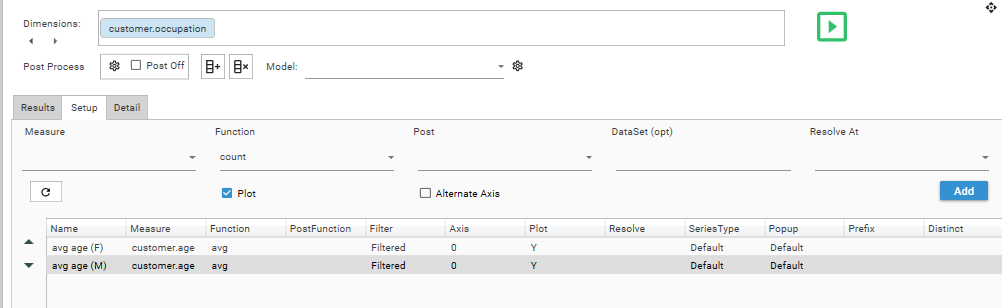
Here we have added a filter of gender = Male and renamed the first column, duplicated it and changed the filter and name to Female
Calculated Columns
New columns can be added to the calculation by applying post-processing functions.
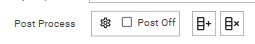
In Setup mode hit the + button in in the post processing section to add a new process.
So, for example, selecting ColumnMath will open the configuration window for the new column.
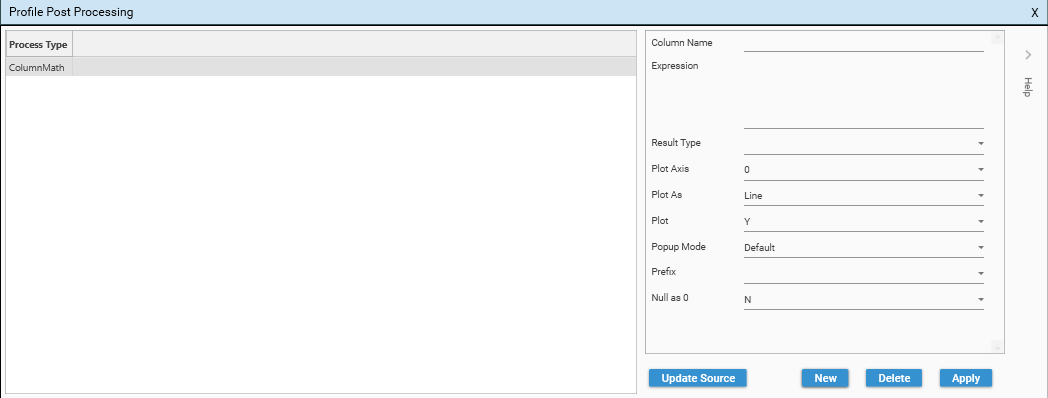
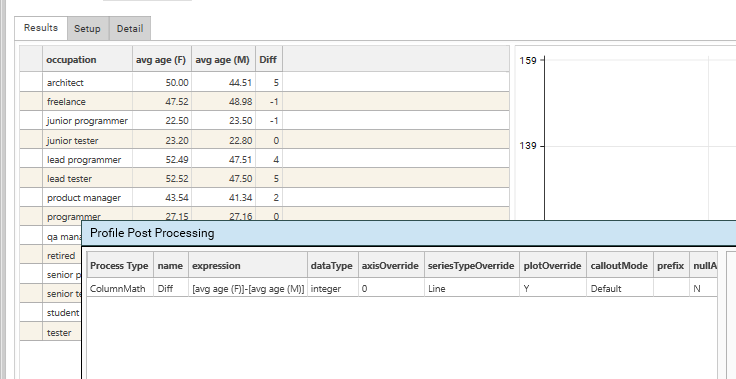
Here we have added a column that will calculate the difference between the 2 average age columns, and we will plot the value as a line on a second axis.
Tip: right-clicking in the Expression text box will open a menu of existing columns to help avoid typographical errors in the expression. Select from the menu to insert into the text.
Results
When calculated (or opened from the Results tab) the view will switch to Results mode.
- Choose to display as a Grid , Chart or Split view
- In Split view, the Orientation of the grid and chart can be changed.
- The grid's rows/column orientation can be Flipped if visible and of the correct form.
- Set the Chart Type as appropriate for the data
- Add any additional Chart Options
- Grid displays can also be optionally colored as HeatMap
Sorting
The grid, and therefore the graph, can be sorted by
- Selecting from the Sort Combo
- Clicking on grid headers
- Settings in the Option dialog
Saving Reports
Click the Save button to save a report, enter a name, description and any tags required.
Once saved, the report will appear in the Report Tab of Solution Explorer.
Export To Excel
Click the lower icon bar Export To Excel button to save the profile as an Excel file. Once saved, Explorer will prompt to view the file in Excel.
By default, the profile result grid data will be exported at Sheet1 Cell A1.
The profile can have an Excel template assigned (and persisted with its definition).
- Right click on the grid, select Template->Set Row Offset and set a suitable offset at which Explorer will start the profile data in Excel
- Export the profile
- Edit the exported file in Excel and format the grid / add graphs as required; then save.
- Save this file and the profiles template from right-click Template->Set
- Save or (re-save) the profile to add the persist this template definition
Export To File
Hit the export to File button to save the result grid from a profile on the server
Tip: hold down Ctrl when pressing the File button export you tour local machine.
Export To Table
Hit the export to Table button to dump the content of the result grid into a new project table.
Enter the table name when prompted. Each column in the grid will be a field in the new table.