NOTE
This article is part of the "Tutorial - Basic Sales Dashboard" series. It assumes the following:
- The user is logged in to an active DataJet realm that contains the DJDemo2023 data (or data arranged in a similar structure)
- Demo Data (or data in a similar structure) has been loaded into a project and reporting tables have been created. See Step 3 - Create Reporting Tables if this has not yet been done.
- This step can be skipped if customer segmentation has already been created.
Approach
The dashboard under development is a sales dashboard, showing sales activity grouped by customer segmentation. Several of the visualisations in the dashboard rely on the categorization of customers into specific segments - i.e., classifying individuals into groups based on individual characteristics or behaviours. This tutorial does not not assume that any segmentation has been calculated. Instead, we use a simple method of segmentation called RFM, where R stands for recency, F for frequency, and M for monetary. Other segmentation approaches could be used in its place.
At the end of this step, you will know how to:
- Create Customer Source Metrics from sales data for use in RFM
- Run an RFM model
- Categorise RFM output into a single segmentation field
The output of this customer segmentation section is a field called [sales.CustSegment].
Key Techniques
The following functional areas are introduced by this step:
Video Tutorial
{COMING SOON: Video}
Source Metrics
This section shows how to create simple source metrics for use in an RFM model:
- Recency - how long ago a purchase was made
- Frequency - how frequently a purchase was made
- Monetary - the relative value of the purchases made
Jump To:
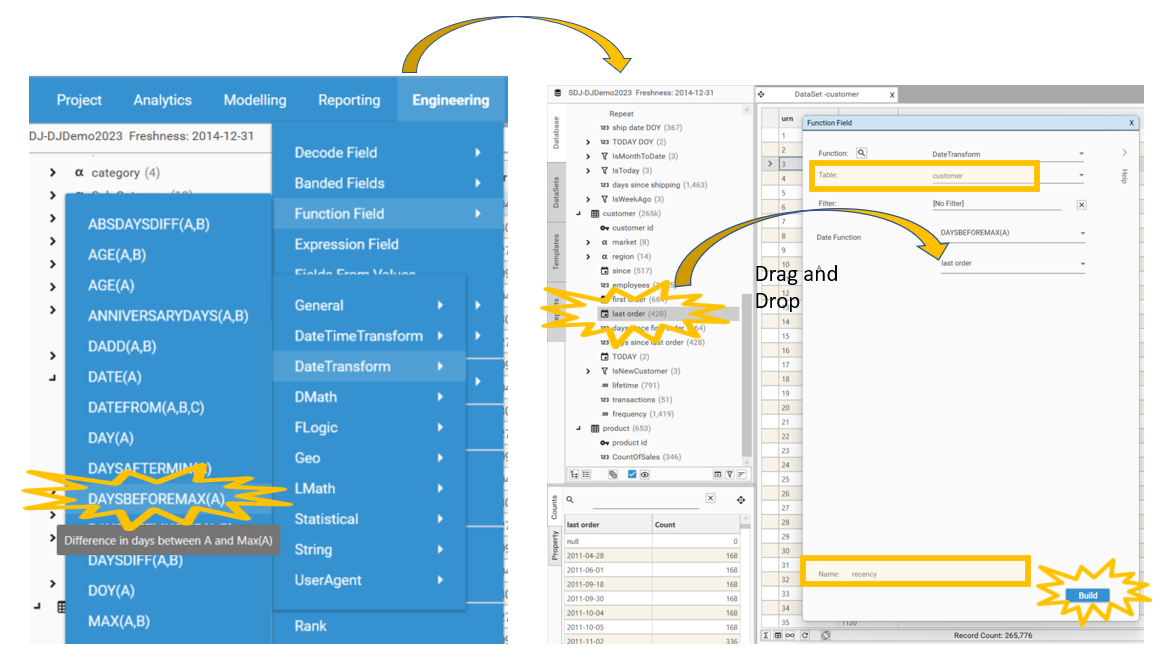
- [customer.last order]
- [customer.recency]
- [customer.first order]
- [customer.lifetime]
- [customer.transactions]
- [customer.frequency]
- [customer.SumOfSales]
Monetary - Customer Value
The monetary part of an RFM model provides an indication of the customer's value. To calculate monetary the following approach is taken:
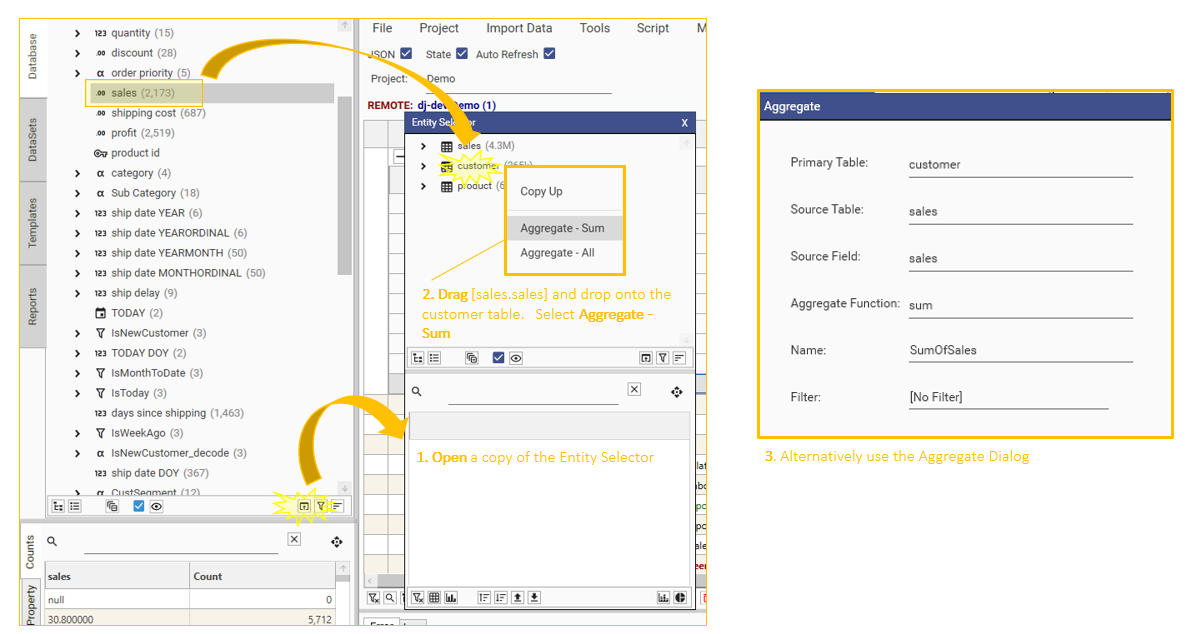
- Calculate Total sales for each customer: Create an aggregate of MAX [sales.sales] on the customer table [sales.SumOfSales]
Calculating [customer.SumOfSales]
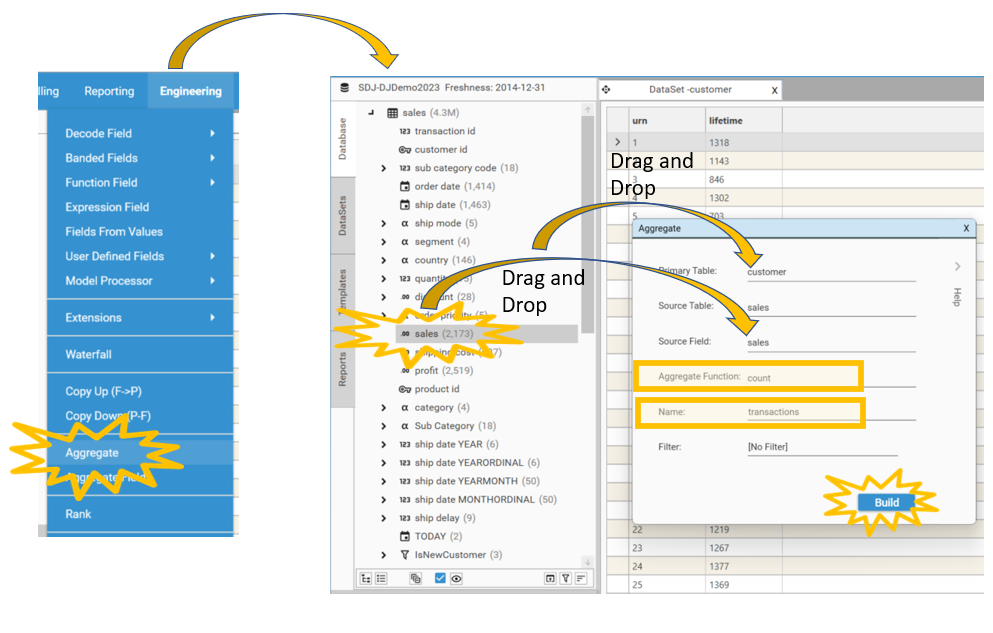
To calculate [customer.SumOfSales]:
- Click on Engineering | Aggregates and the Aggregate dialog will open.
- Select customer as the Primary Table
- Drag and Drop [sales.sales] onto the Source Field box
- Select "max" as the aggregate function
- Name the field "SumOfSales" and click Build.
{
  "method": "BuildAggregate",
  "project": "SDJ-DJDemo2023",
  "targetTable": "customer",
  "source": "sales.sales",
  "overwrite": true,
  "name": "SumOfSales",
  "function": "sum",
}
Frequency
The frequency part of an RFM model provides an indication of how frequently a customer interacts, or makes a purchase. To calculate frequency the following approach is taken:
- Calculate when customer first became a customer: From [sales.ship date], use an aggregate to extract the date of the oldest transaction and label this as [customer.first order]
- Calculate the number of days the customer has been active: Create an expression of [last order] - [first order] for each customer ([customer.lifetime])
- Calculate the number of transactions for each customer: Create an aggregate of MAX [sales.sales] on the customer table ([customer.transactions])
- Calculate the average number of days between transactions for each customer: Create an expression of [customer.lifetime]/[customer.transactions] for each customer ([customer.frequency])
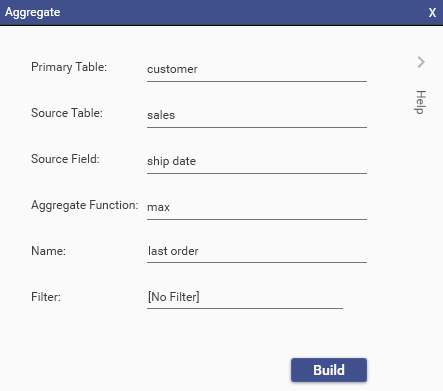
Calculating [customer.first order]
To calculate [customer.first order]:
- Click on Engineering | Aggregates and the Aggregate dialog will open.
- Select customer as the Primary Table
- Drag and Drop [sales.ship date] onto the Source Field box
- Select "min" as the aggregate function
- Name the field "first order" and click Build.
{
"method": "BuildAggregate",
"project": "SDJ-DJDemo2023",
"targetTable": "customer",
"source": "sales.ship date",
"overwrite": true,
"name": "first order",
"function": "min",
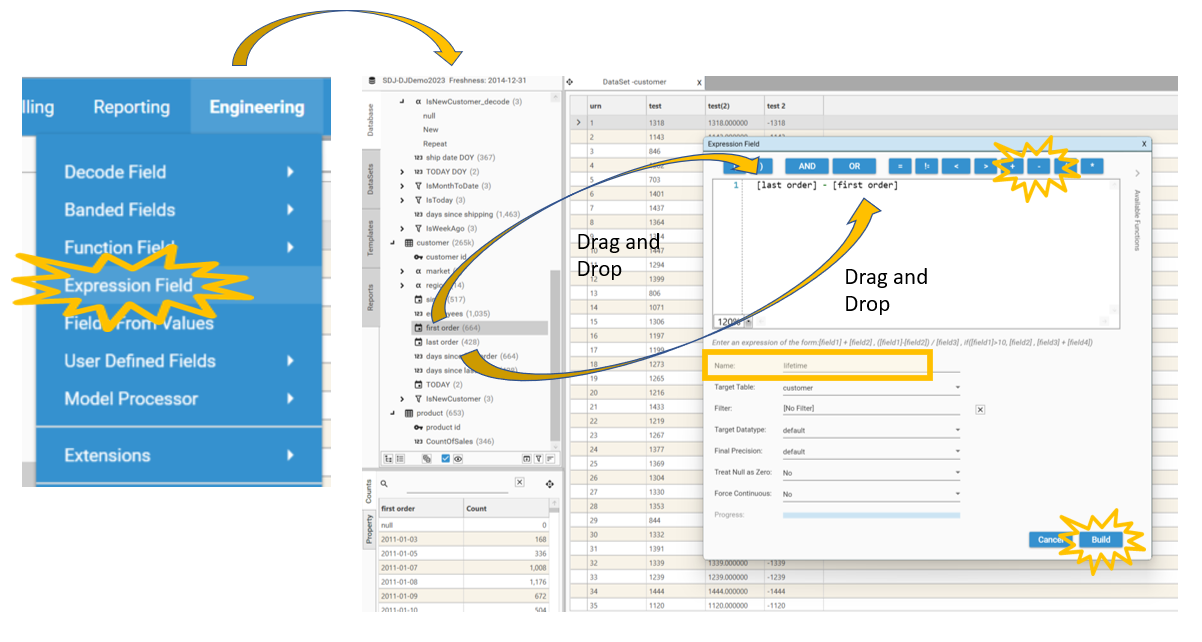
}Calculating [customer.lifetime]
Customer lifetime is the number of days between first and last order. To calculate [customer.lifetime]:
- Click on Engineering | Expression Field. The Expression Field Dialog will appear.
- Drag and Drop [customer.last order] into the expression builder
- Select the minus button or type " - ".
- Drag and Drop [customer.first order] into the expression builder.
- Rename the function to lifetime and select Build.
{
  "method": "BuildBakedField",
  "name": "lifetime",
  "project": "SDJ-DJDemo2023",
  "targetTable": "customer",
  "overwrite": true,
  "dataType": "default",
  "function": "dmath",
  "p1": "expression",
  "p2": "[last order] - [first order]",
  "nullIsZero": false,
  "NOORD": false
}
Calculating [customer.transactions]
To calculate [customer.transactions]:
- Click on Engineering | Aggregates and the Aggregate dialog will open.
- Select customer as the Primary Table
- Drag and Drop [sales.transaction id] onto the Source Field box
- Select "count" as the aggregate function
- Name the field "transactions" and click Build.
{
  "method": "BuildAggregate",
  "project": "SDJ-DJDemo2023",
  "targetTable": "customer",
  "source": "sales.sales",
  "overwrite": true,
  "name": "transactions",
  "function": "count",
}
Calculating [customer.frequency]
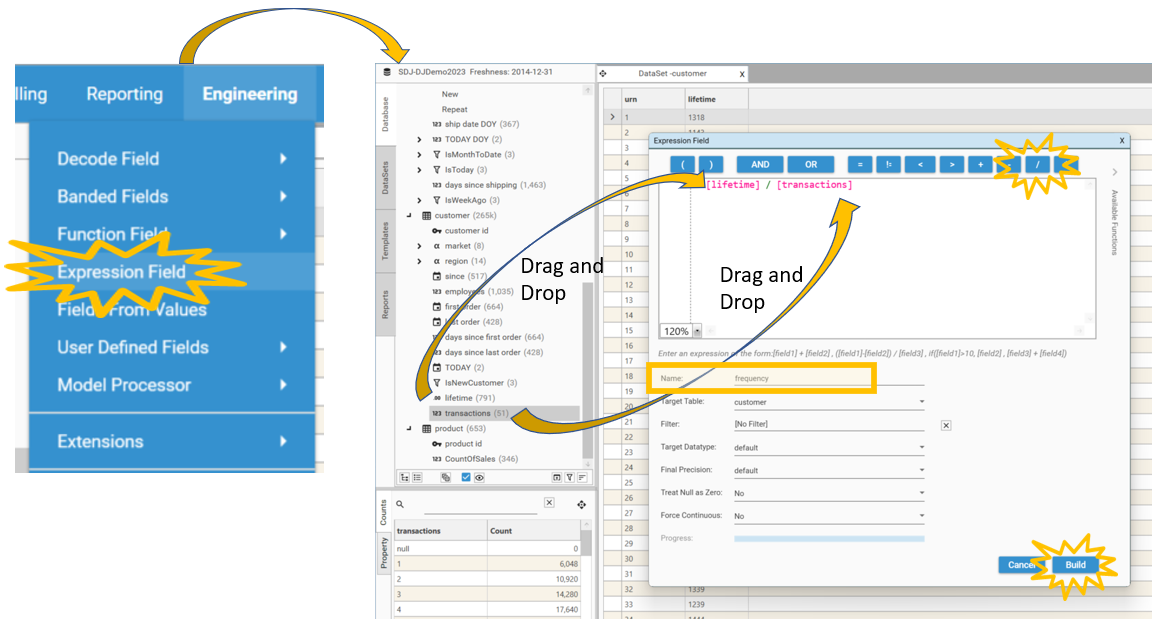
Customer frequency is the average number of days between transactions for each customer. To calculate [customer.frequency]:
- Click on Engineering | Expression Field. The Expression Field Dialog will appear.
- Drag and Drop [customer.lifetime] into the expression builder
- Select the divide button or type "/".
- Drag and Drop [customer.transactions] into the expression builder.
- Rename the function to frequency and select Build.
{
  "method": "BuildBakedField",
  "name": "frequency",
  "project": "SDJ-DJDemo2023",
  "targetTable": "customer",
  "overwrite": true,
  "dataType": "default",
  "function": "dmath",
  "p1": "expression",
  "p2": "[lifetime] / [transactions]",
  "nullIsZero": false,
  "NOORD": false
}
Running an RFM Model
DataJet provides a plug-in for RFM under Analytics | Extensions. There are two RFM models available: Quick RFM and RFM Filtered. Either is suitable to use in this situation, but we will use Quick RFM as we are not applying any filters.
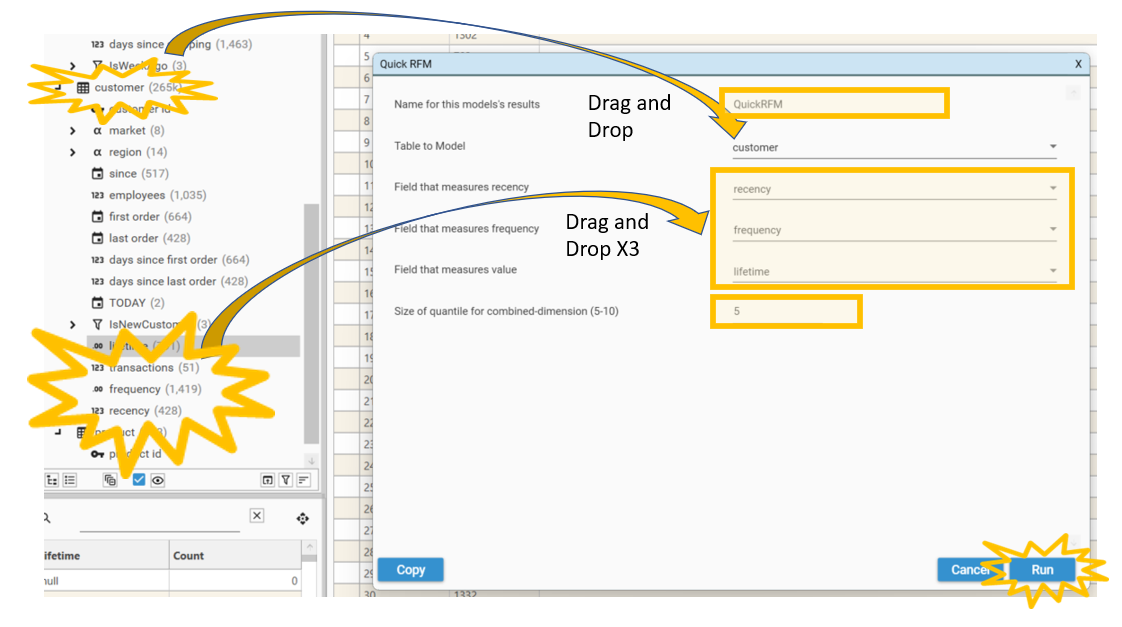
To run the RFM model:
- Select Analytics | Extensions | Quick RFM. The RFM dialog will open.
- Name this model's results QuickRFM.
- Enter customer for "Table To Model"
- Drag and Drop the following into the relevant combo box:
- [customer.recency]
- [customer.frequency]
- [customer.monetary]
- Set a quantile size of five by double clicking in the size of quantile box and typing 5.
- Click Run.
The job window will appear with MODEL as a task. Once this is complete (on the demo database this should complete almost instantly), refresh the page using the refresh button in the top left-hand corner of the explorer.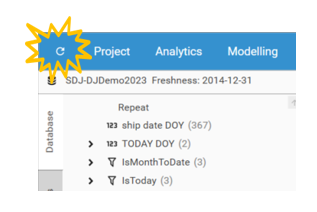
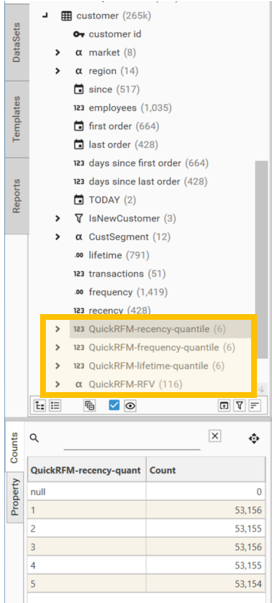
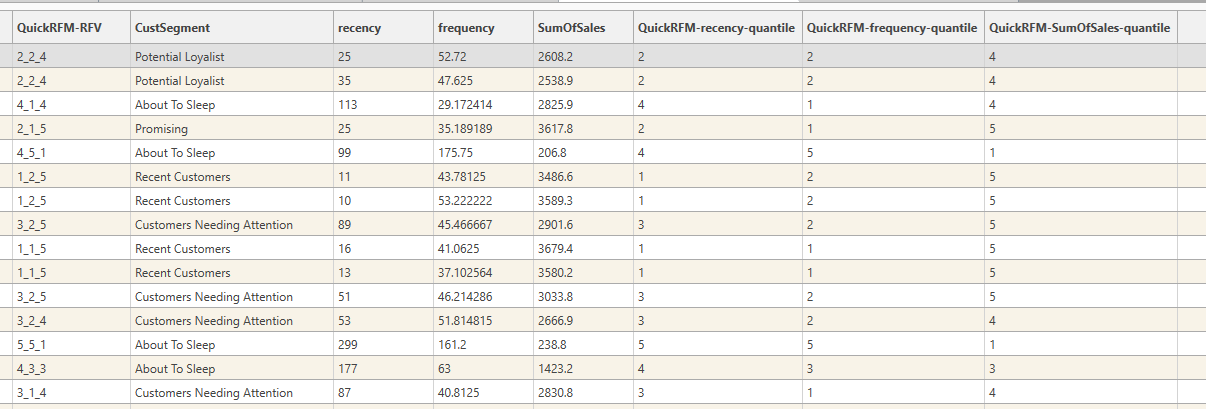
The following fields will appear in the tree:
- [customer.QuickRFM-recency-quantile],
- [customer.QuickRFM-frequency-quantile],
- [customer.QuickRFM-lifetime-quantile]
- [customer.QuickRFM-RFV]
Categorise RFM output
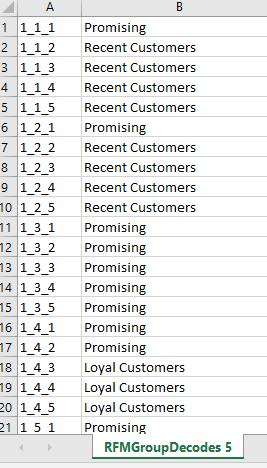
The final step in the segmentation process is to decode the RFM categories. A decode file has been supplied for this purpose:
Calculating [customer.CustSegment]
To create [customer.CustSegment]:
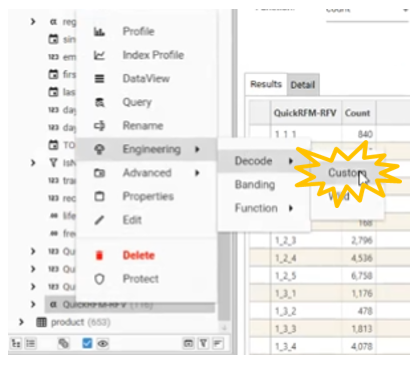
- Right-click on QuickRFM-RFV.
- Select Engineering | Decode | Custom. The Custom Decode Dialog will appear.
- Name the Decode Name: CustSegment.
- Click on the Excel tab. The option to input a workbook will appear.
- Select a file to import by clicking the file select icon (on the right-hand side of the page) to bring up the file selection dialog.
- Go into the DJDemo2023 folder and select the RFMDecodes.xlsx Excel file. A DATAPATH should appear to the RFMGroupDecodes 5 file. For the Code Column select the input as A 1_1_1. For the Decode Column select the output as B Promising.
- After completing these steps click the Test button to check that the Decode is running properly.
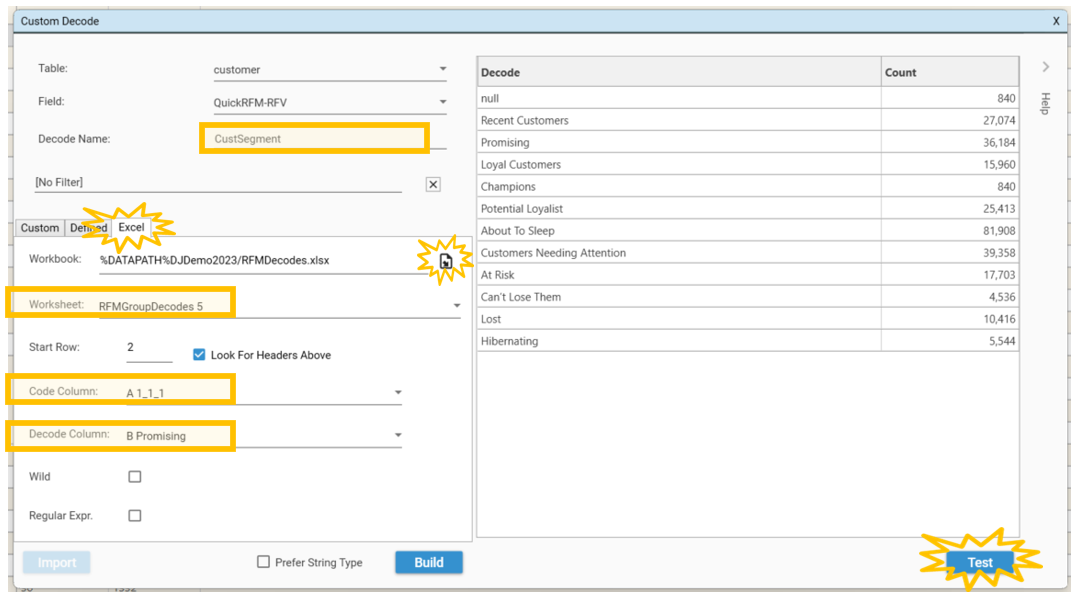
You should see the categories: null, Recent Customers, Promising... appear with counts (as shown above). If you are happy with your test you can select Build. [customer.CustSegment] will appear in the customer table.
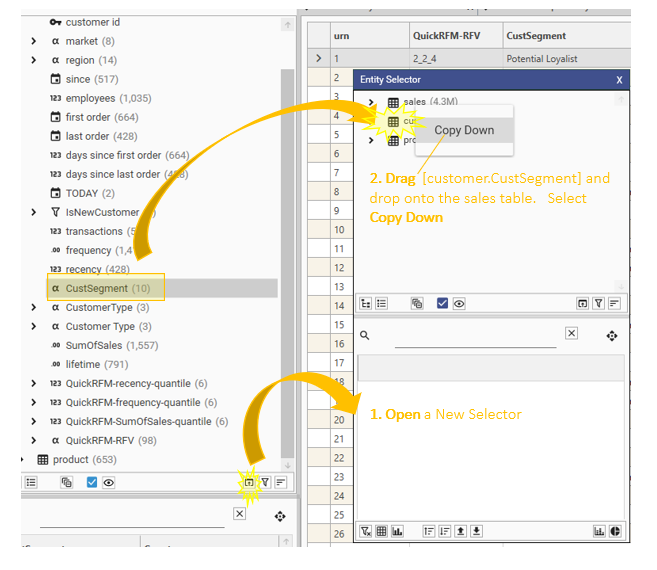
Calculating [sales.CustSegment]
The final step is to Copy Down [customer.CustSegment] to the sales table.
- Click the New Selector icon,
- Drag and drop the [customer.CustSegment] field onto the sales table
- Select Copy Down.
- [sales.CustSegment] will appear in the sales table.
{
  "method": "BuildBakedField",
  "project": "SDJ-DJDemo2023",
  "function": "copydowndiscrete",
  "targetTable": "sales",
  "name": "CustSegment",
  "overwrite": false,
  "p1": "CustSegment",
  "p2": "customer"
}