DataJet's NoSQL paradigm allows a wide variety of queries and selections to be executed by using a drag and drop interface. The profile report(s) work with the HotBar and Database Tree to facilitate this approach.
For a quick overview of using drag and drop with a profile report, take a look at Creating simple profiles and Tab navigation
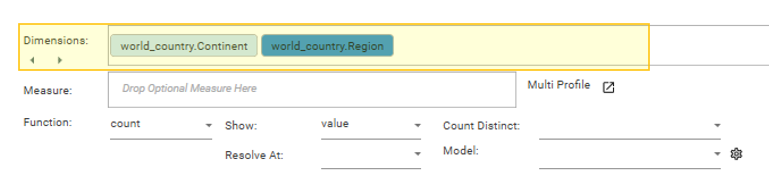
Dimensions
Drop fields from the Database Tree onto the Dimensions area, and the profile will be recalculated.
- It is not possible to drop continuous fields in the Dimensions area.
- To use continuous fields (i.e., date-time fields, continuous integers such as price etc) as dimensions, first carry out transformations on the fields to create a discrete dimension.
- Look at Engineering | Functions for details of possible transformations), including CTOD, Concat, DATE(A)...
To modify dimensions after they have been dropped, select them and RIGHT-CLICK to bring up the context menu:
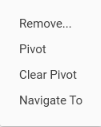
Remove
Removes the selected dimension and recalculates the report.
Clear Pivot
Turns a dimension that is being used as a column dimension back into a row dimension, and changes calculation type from Crosstab to Multi-Dimensional.
Pivot
Turns a row dimension into a column dimension and creates a Crosstab.
Note: Only one dimension can be pivoted at a time.
Navigate To
Selects the dimension in the Database Tree.
Filters
The profile can be filtered by a selected group of records (i.e., calculated using only a specified subset of records).
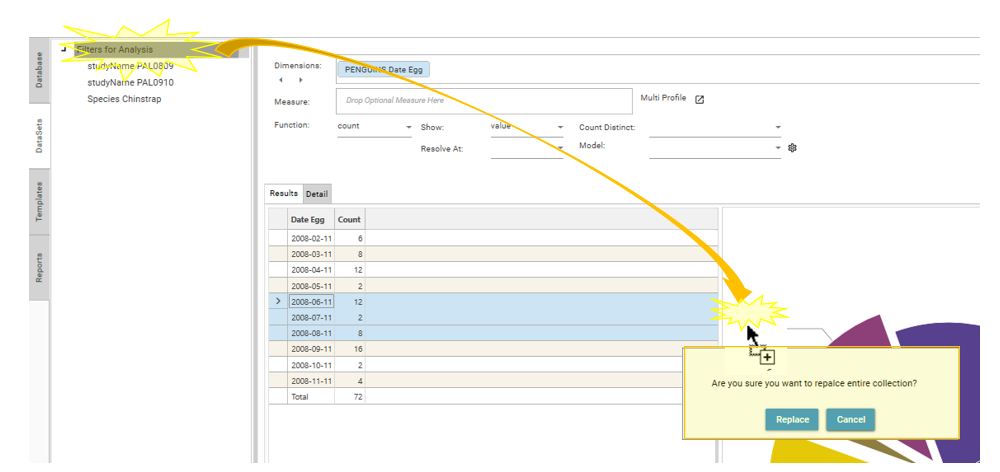
To add a filter to a profile report, select a dataset from the Database Tree, Dataset Tree, Dataset HotBar, or another report, and drop it onto the main report area.
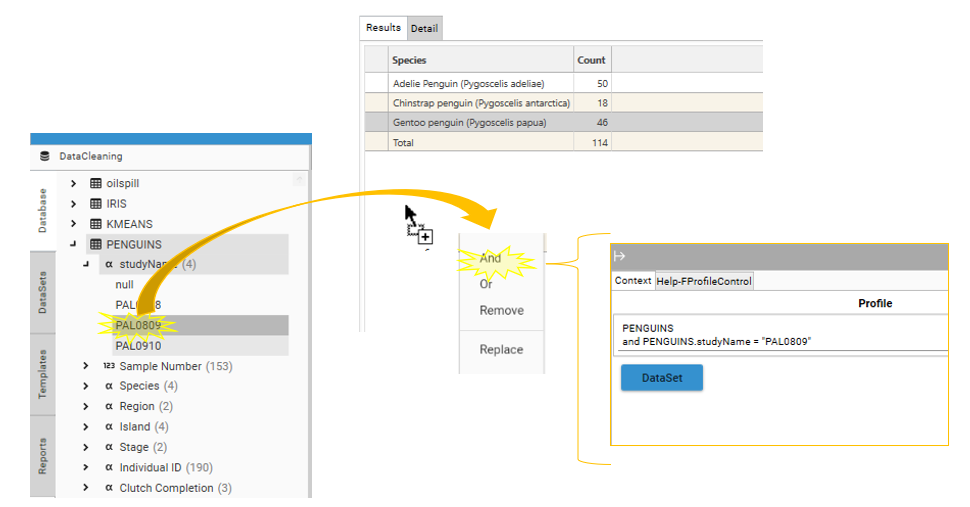
When the mouse is released and the Dataset is dropped, a context menu will appear allowing the filter method to be selected:
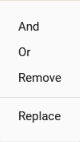
And
ANDs the dropped dataset to the current set of records being calculated by the report. By default the records being analysed will be all records from the table of the first dimension.
ANDing will create the set of records that are in the current report dataset AND in the dropped dataset.
Or
ORs the dropped dataset to the existing set of report records. By default the records being analysed will be all records from the table of the first dimension.
ORing will create the set of records that are in the starting dataset OR in the dropped dataset.
Remove
Removes the records in the dropped dataset from the current report dataset.
Replace
Replaces the current dataset with the dropped dataset. NOTE: This option is not available if the report is currently using all records in the table.
For more information on And/Or/Remove/Replace please see DataSet HotBar - Functional Overview (Combining Datasets)
Measures
Drop a field from the Database Tree onto the Measures area, to determine what will be calculated.
Any field can be dropped into the Measure box, but depending on the field type (i.e., continuous/discrete, numeric/non-numeric) some functions may not be valid. See Profile - Measure for more details on measure functionality.
Reset
Removes the measure from the profile report and returns the report to counting records from the table that holds the dimensions.
Navigate To
Selects the measure in the Database Tree.
Selections
Profile reports are interactive, and records can be selected from both grids and charts.
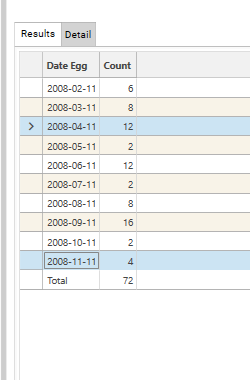
Selecting from the grid
To select from a grid, use the mouse to select a row, or multiple rows, and then drag into the HotBar. A Dataset of the underlying records will be created.
- To view the underlying query of the resulting Dataset, right click the Dataset in the HotBar and choose “Open Copy”
- To select non-contiguous rows, hold down the CTRL key while clicking the desired rows and then drag into the HotBar...
- Hold down the SHIFT key to select a range of rows and then drag into the HotBar.
- CTRL + A will select all records in the grid
- CTRL + C will copy all records in the grid to the clipboard, in an Excel friendly format that can be pasted straight into a spreadsheet.
Selecting from a chart
.PNG)
- Click a chart Column, Bar or Segment to select the underlying records. To select from multiple segments, hold down CTRL while selecting.
- Pie and Donut charts will expand selected segments to show which segments are included in the selection.
- Bar, Column and TreeMaps will hatch selected segments or change the segment colour to indicate selected segments.
Named Datasets
Named Datasets (i.e., sets of filter options) can be added to a profile report by dropping a Dataset Collection onto the report.
See Profile - Right-Click Menu for more details.
Saved Reports
Profiles can be saved for future use by choosing the Save option from the micro-toolbar.
Once saved, the profile report will appear in the Report Tree. Saved reports can be dropped directly onto dashboards, opened up in a new workspace tab, or accessed via a web-browser from https://datajet.app/datajetsoftware/.
To recreate a profile report in script, drag the report from the Report Tree into the script and choose Save Report. (Note: This assumes that all objects required by the report have also been created by the script)
For further details on saving reports, see Profile - Micro Toolbar (Save As report)