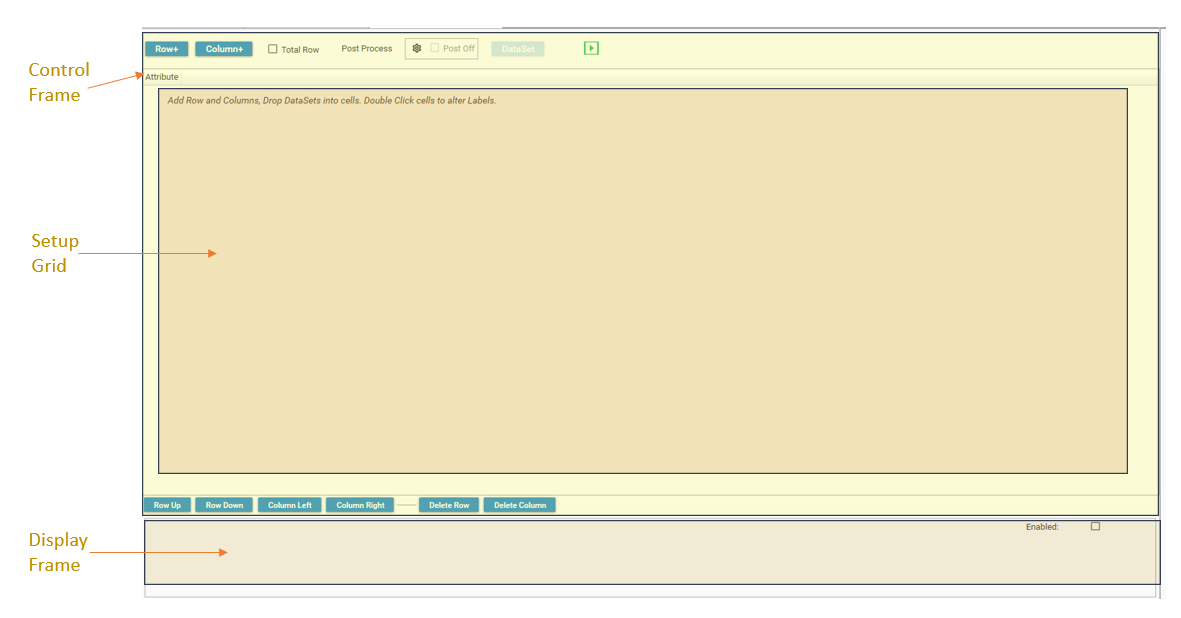
The query matrix allows a set of segments to be analysed within the same report, and is used for grouping and displaying metrics that are not necessarily directly linked via the Data Model. It consists of:
- Control Frame - used to manage columns, rows, post-processing and data sets.
- Setup Grid - the display grid
- Right-Click Menu - accessed by right-clicking in the display grid
- Display Frame - user to control display settings for grid and charts.
Modes
Query Matrix has 2 main modes of operation:
- Column Mode
- Cell Mode
Column Mode is used when the same measure is applied to each cell in the column. Cell Mode is used when each cell is treated individually.
Measures
The measures that can be applied in a query matrix are:
- Count
- Unique
- Sum
- Avg
- Min
- Max
- Null
Creating a Matrix
Add Rows
First add rows to the grid, by selecting the Row+ button.
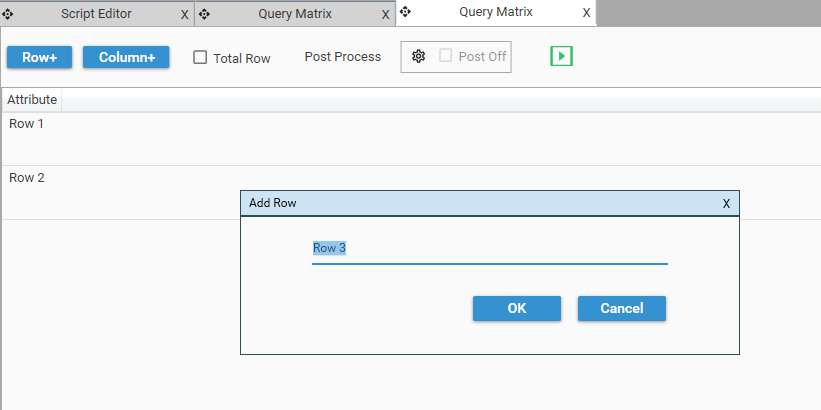
Enter a label for the row, or keep the default label. (Note: If the default label is kept, then the Row Label will be automatically set to match the name of the segment that is dropped into that row's first column.)
Add Measures - Column Mode
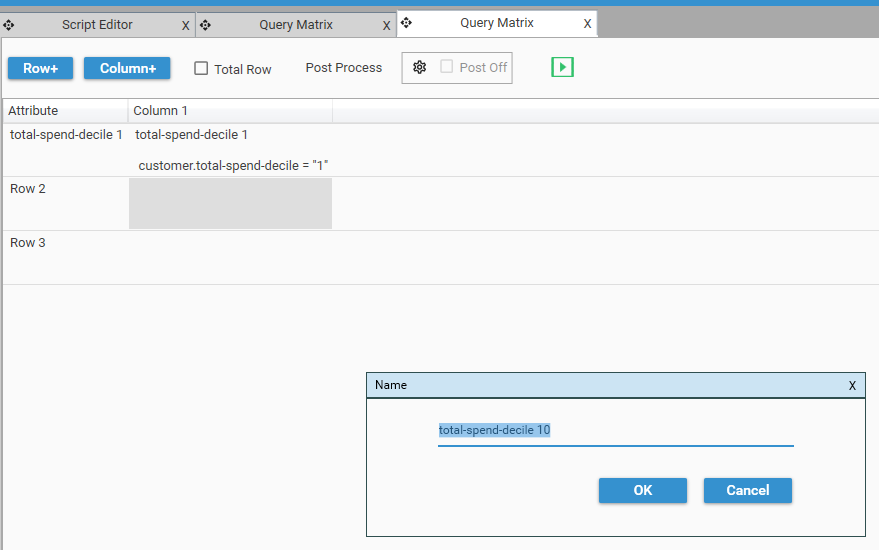
If working in column mode, add a single column. The label can be provided now, or updated later.
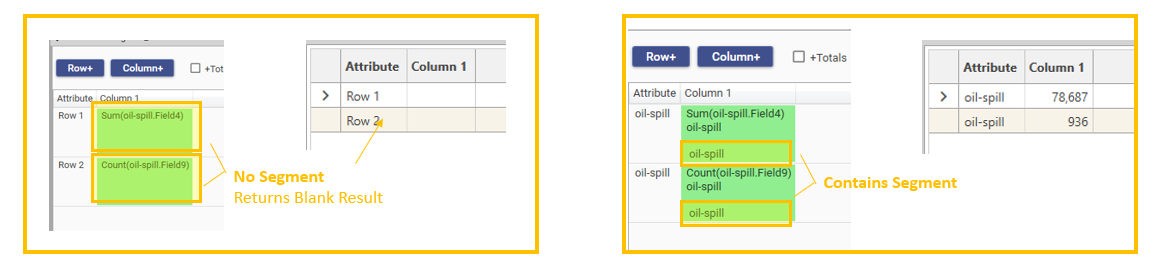
Drop a segment into each cell of Column 1. If the row label is the default (Row X) then the Row Label will be set to match the segment label.
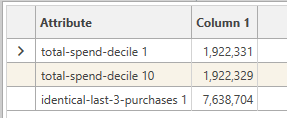
To see counts for the added segments, click the run button:

The Query Matrix will enter run-mode:
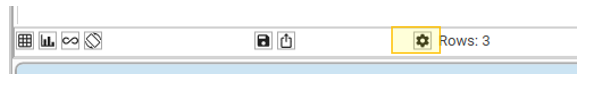
To go back to design mode, right click and choose Design Mode, or select the settings button on the micro-toolbar:
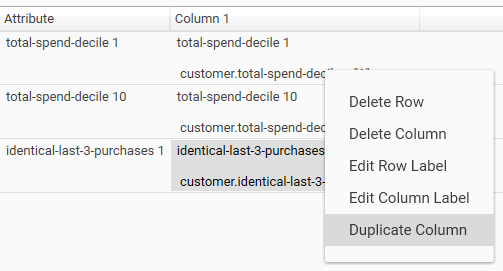
To add further column based measures for the existing segments, right-click column 1 and choose "Duplicate Column". This will add another column with the same segments as the selected column.
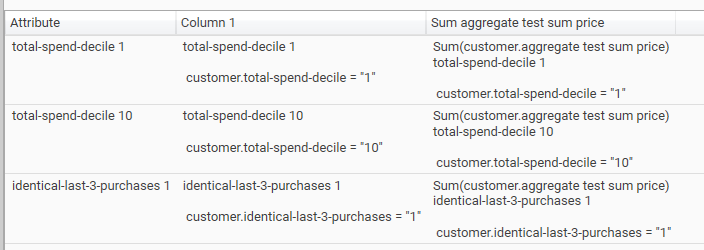
To change Column 2 from a count to a measure, drop a field onto one of the cells in column2 and choose a function from the Entire Column function menu.
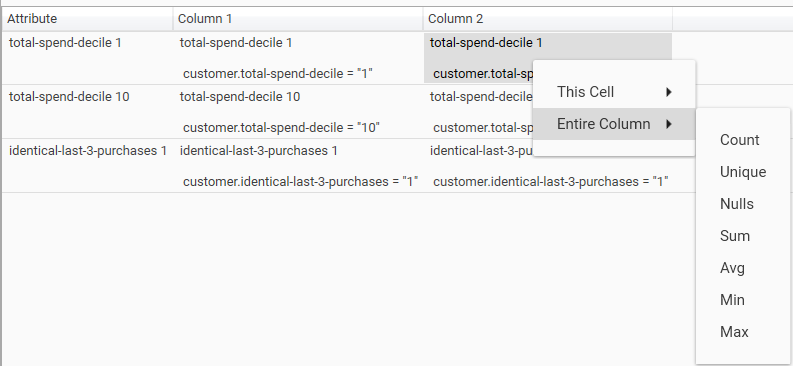
The measure will be added to each cell in the column and the description updated accordingly:
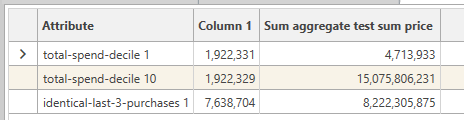
To view the results of the new calculation, click the calculate button:
Add Measures - Cell Mode
Cell mode does not assume that segments are duplicated across columns. If working in cell mode, add columns and rows and drop segments where they are required.
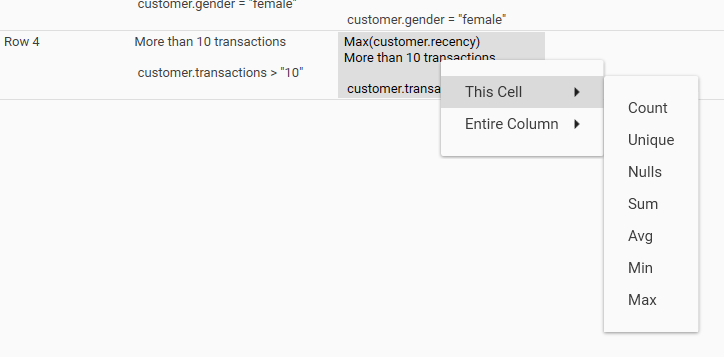
To add a measure to an individual cell, drop the measure field on top of the cell, and choose a function from the "This Cell" right-click menu.
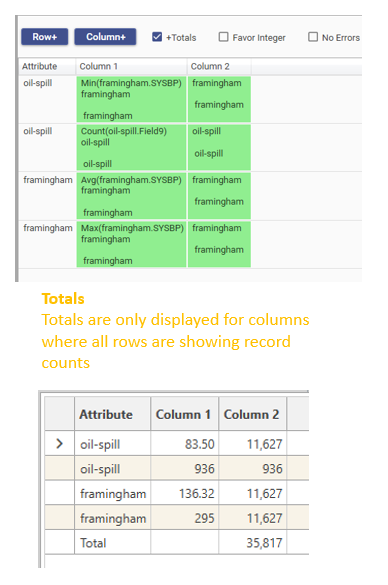
Total Row
If selected, a total row will be included. Only columns where all rows contain record counts will have a Total value.
Favor Integer
If selected, and if there will be no loss of data (i.e., no significant figures after decimal point) decimal data will be displayed as integer.
Post Processing
Use Post-Processing to add calculated columns to the query matrix. See Post Processing Overview for more details on post-processing.
Selecting Records
To select underlying records from cells in the Query Matrix, hold down CTRL while selecting the cell, and drag into the hotbar. See Using the DataSet Hotbar for more details on working with the HotBar.
Display options
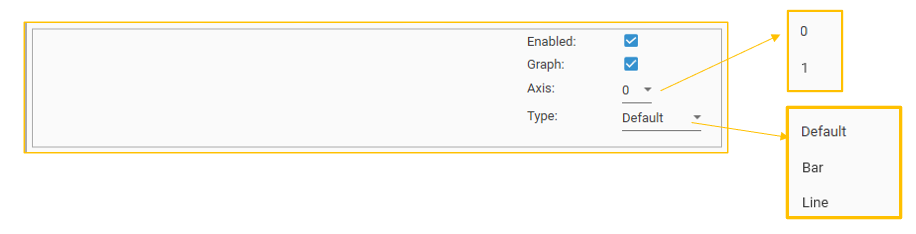
The Display panel will show the display options for the currently selected column:
- Enabled - If selected, the column will be displayed in the result grid.
- Graph - If selected, the column will be plotted on the graph. Only enabled columns can be plotted.
- Axis - Controls the vertical axis used to plot the column
- 0: Left hand vertical axis,
- 1: Right hand vertical axis
- Type - Controls the visualisation for the selected column
- Default: Bar
- Bar: Plots the column as a bar
- Line: Plots the column as a line
Runtime Toolbar
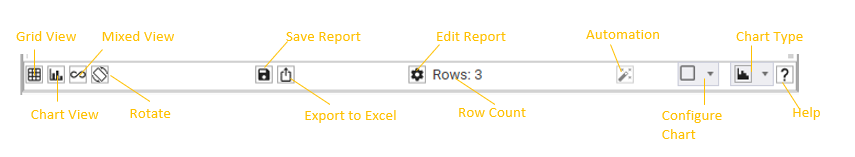
- Grid View - Displays only a result grid
- Chart View - Displays only a chart
- Mixed View - Displays chart and result grid
- Rotate - Sets the relative positions of grid and chart
- Save report - Saves the query matrix to the reports tab
- Export To Excel - exports result grid to excel
- Edit Report - Puts the report into edit mode
- Row Count - displays the number of rows in the matrix
- Automation - Popup menu of any configured automation tasks
- Configure Chart - Charting options
- Chart Type - Select chart type
- Help - Inline Help