Instant Insight with DataViews
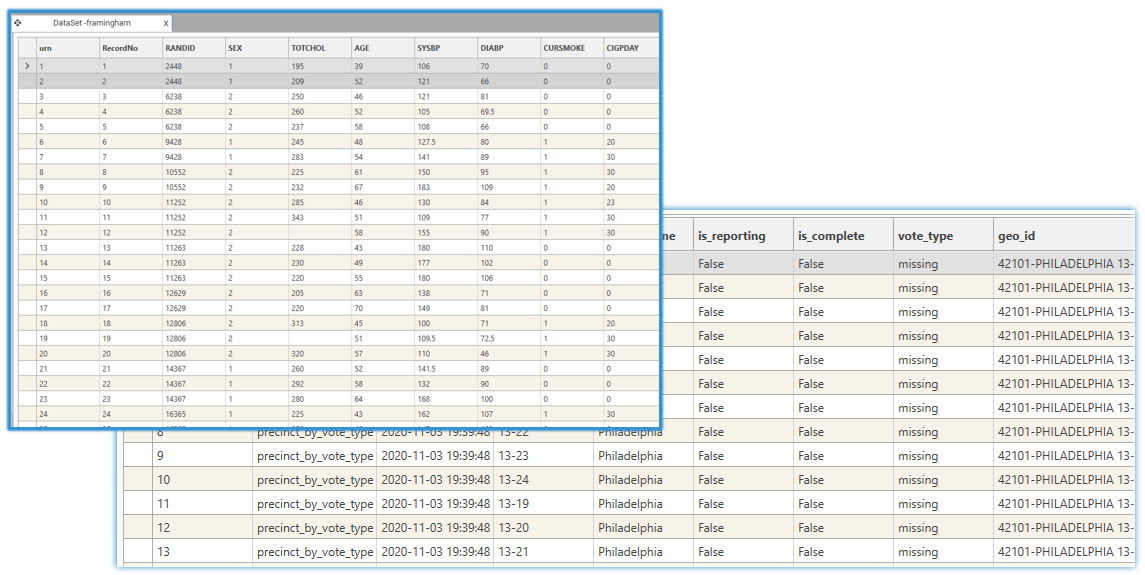
- Inspecting underlying data in record form
- Verifying load process and data types
- Filtering based on data values
- Exporting (subsets of) data into new files and tables
- Sampling of data
- Constructing and saving queries
{TODO: Video - Instant Insight with DataView}
See Also
Opening a DataView
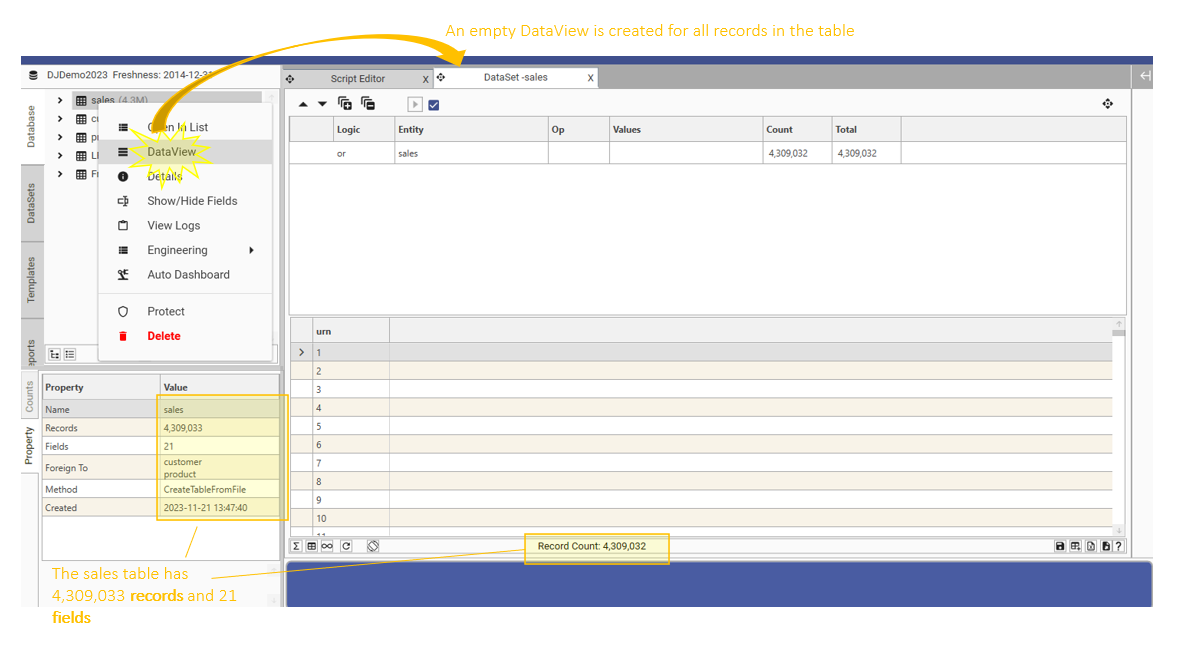
There are multiple ways to open a data view:
- Select the table in the Database tree, right-click and choose "DataView".
- Drag a table from the Database Explorer to the workspace area and choose "DataView"
- Right-click a field in the Database Explorer and choose Data View
- Right-click a Dataset in the HotBar and choose "Open Copy"
Adding Data to the DataView
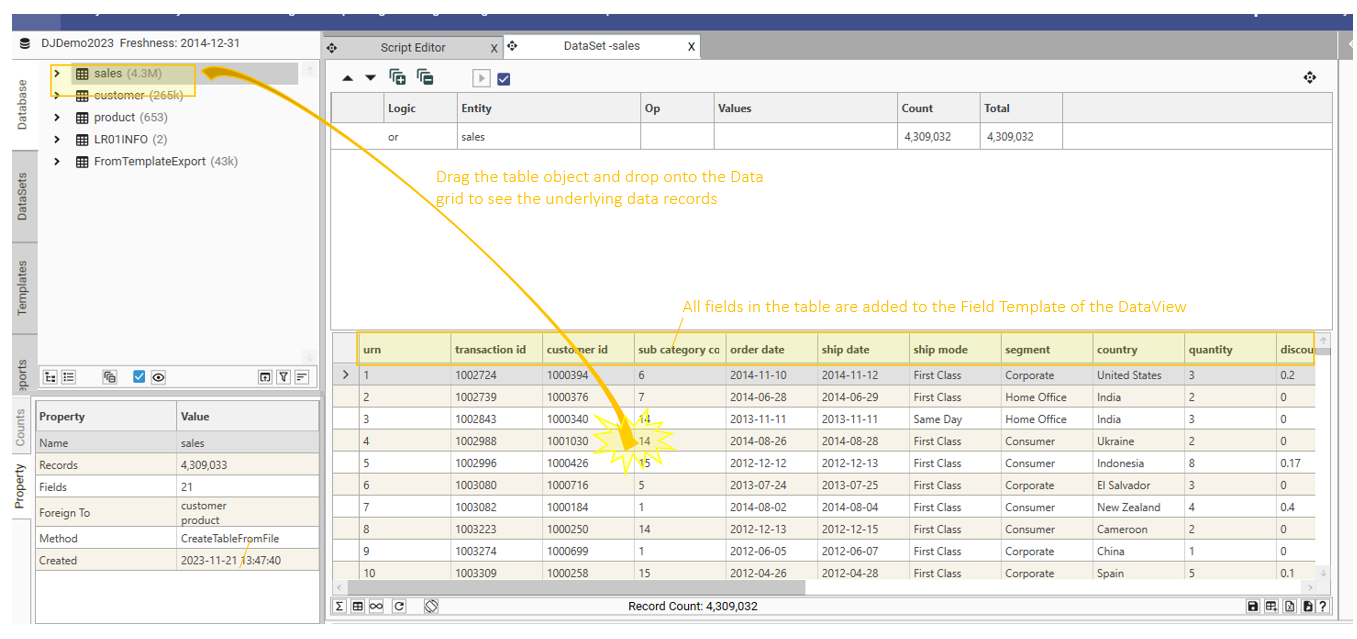
Once a DataView has been opened, fields can be added to the view. There are multiple ways to add fields to a view:
- Add all fields in the table by dragging the table from the Database Tree and dropping it onto the Data View grid
- Drag a field template from the templates tab and drop it onto the Data View grid
- Add individual fields by dragging from the database explorer and dropping on the Data View grid
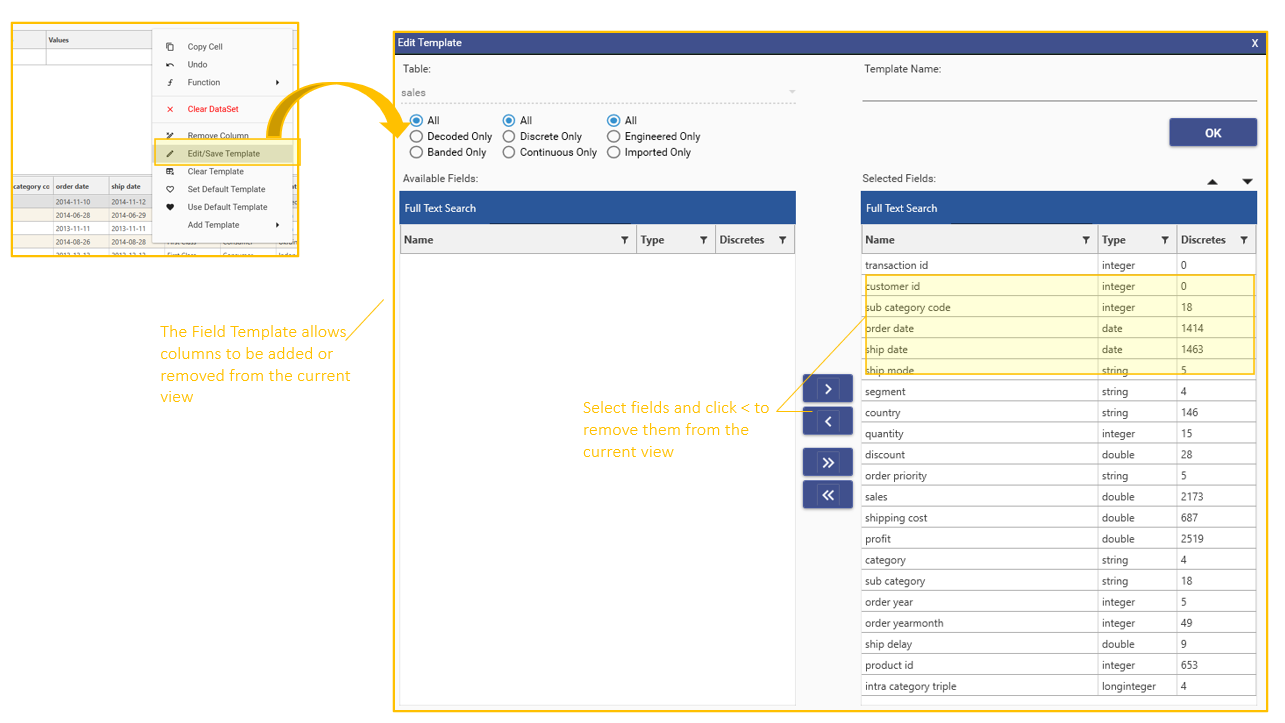
- Right-click in the data grid and choose Edit/Save template. Add fields to the Selected columns and close the dialog
- Right-click a field in the Database Explorer and choose Data View
To edit or view the Field Template for the current Data View, right-click and choose "Edit/Save Template"
Data View Records
Visible Records
Tables in DataJet can be very large (billion+ rows, 10,000+ fields). This means only a subset of data can be on screen at any one time:
- A DataView will display up to 512 columns of data (column limited will be displayed if this number of fields is exceeded)
- Control the display of columns using the Template Dialog
- For small tables (less than 8000 rows), all the records in the table will be displayed.
- For larger tables (and subsets), the first 500 rows of the dataset will be displayed.
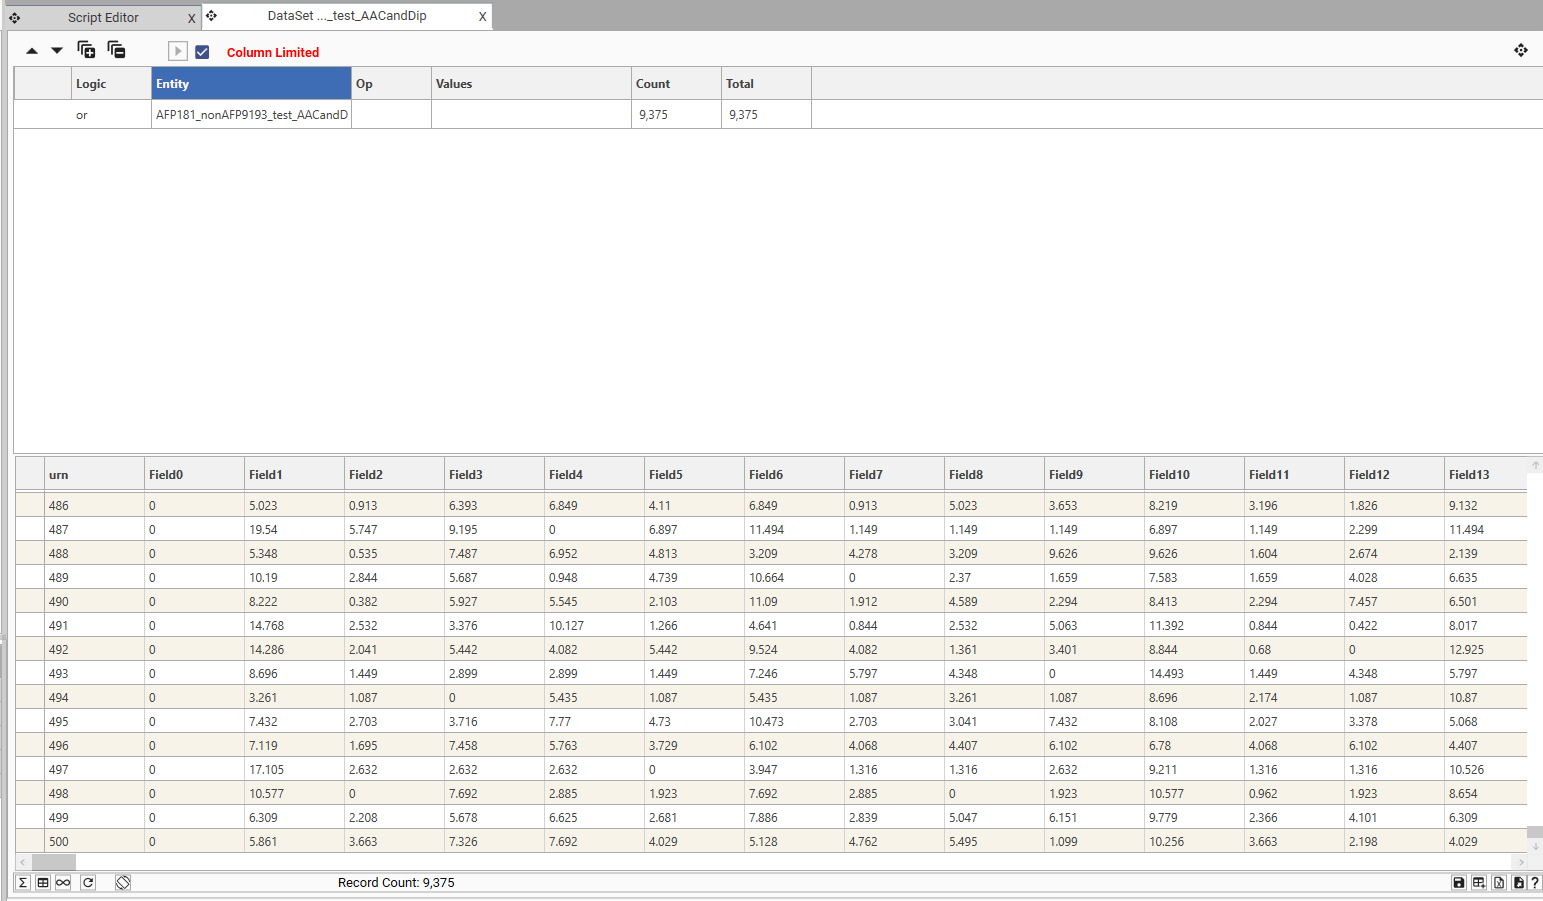 Data View displaying first 512 columns and first 500 rows
Changing Displayed Records
It is possible to bring different records in view through a variety of sampling methods:
- top - selects the top N records
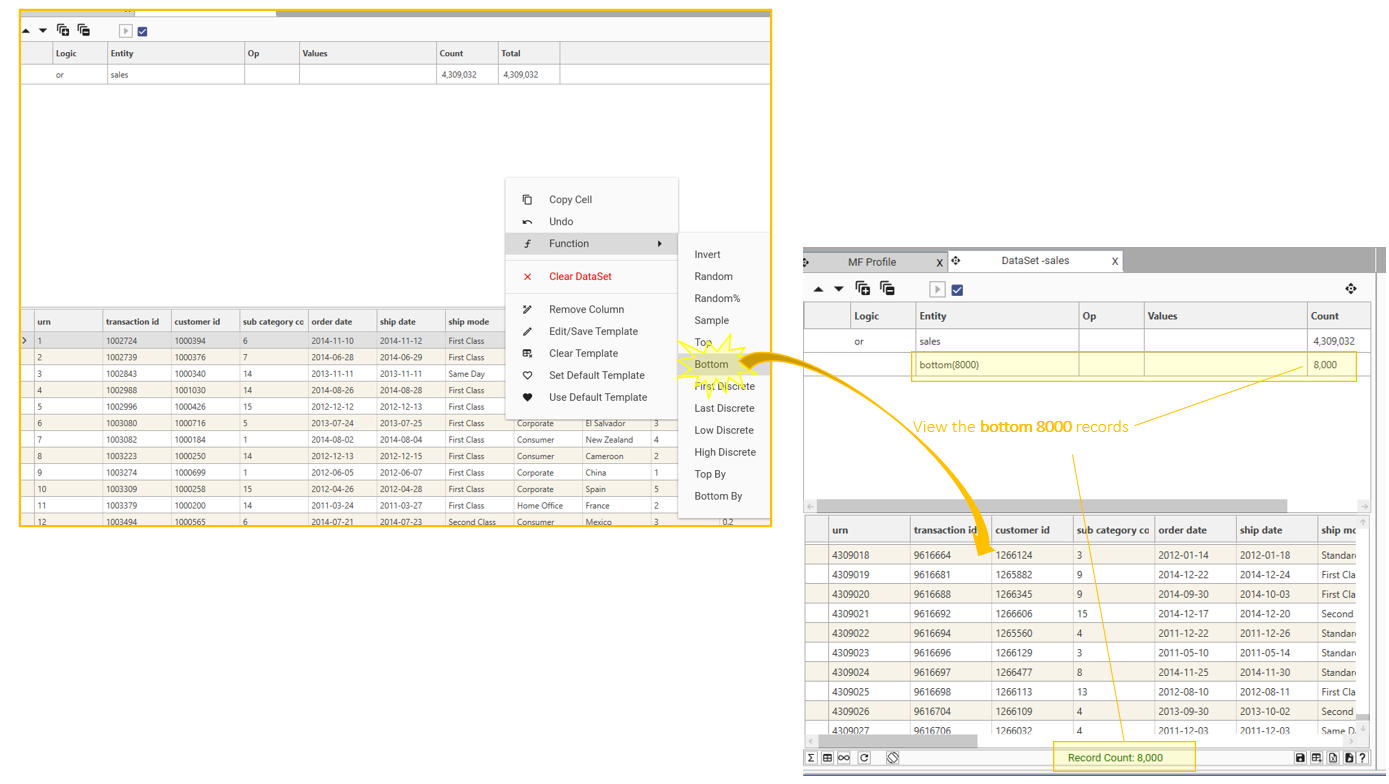
- bottom - selects the bottom N records
- sample - creates a 1 in N sample
- random - selects a random N records
- random % - selects a random N% of records
- top by - selects records containing the first N values of a specified field
- bottom by - selects records containing the last N values of a specified field
- first discrete - selects one record for the first occurrence of each unique value of the selected field
- last discrete - selects one record for the last occurrence or each unique value of the selected field
- high discrete - selects records based on highest value in a scoring field
- low discrete - selects records based on lowest value in a scoring field
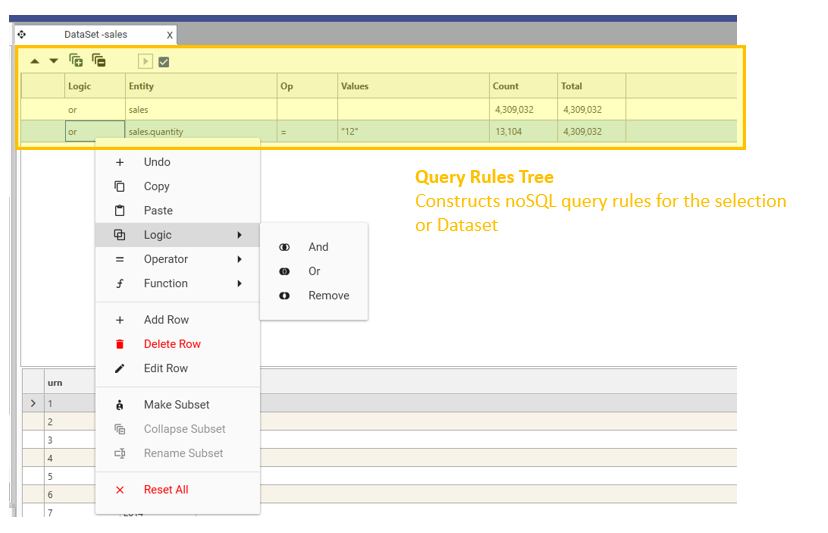
Constructing and saving queries
The records which are displayed can also be altered by modifying the query rule tree:
There are multiple ways to instantly modify the query rule tree:
- Drag a field value from the Database Tree and drop on the query tree or grid
- Drag a field and drop on the query tree - select required values in the "Add Dataset Row" dialog
- Drag a dataset from the HotBar and drop on the query tree or grid
- Select a row in the Query Tree, right-click and either change a setting or choose "edit"
- Right-click in the data grid and choose "undo" or "clear dataset"
- Right-click in the data grid and select a function to apply
- Select a cell in the data grid, hold down CTRL, and drag and drop the cell on the grid
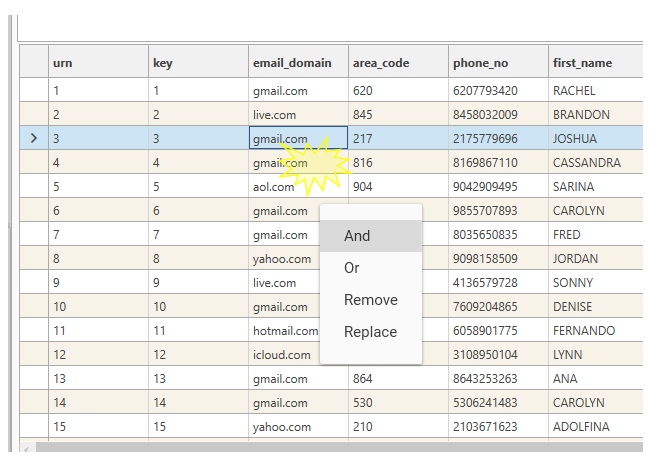 CTRL Drag and Drop cell to filter by cell value
Details of all the actions that have been taken are recorded in the query tree. Save the DataView as a Dataset to keep a more permanent record of the query details:
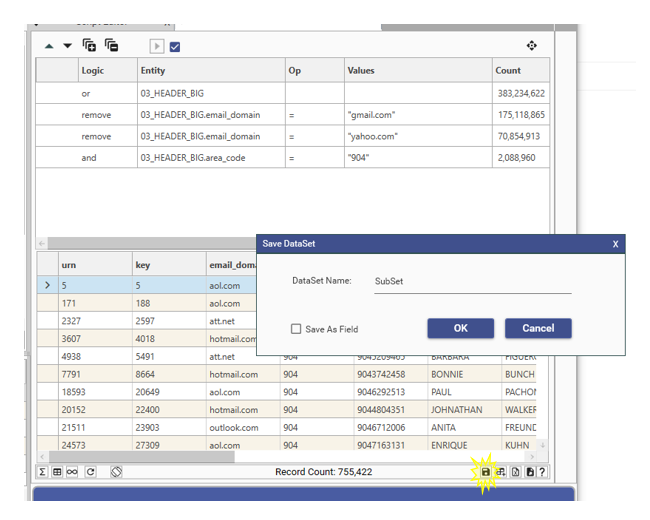 Saving a Query Tree of drag and drop operations
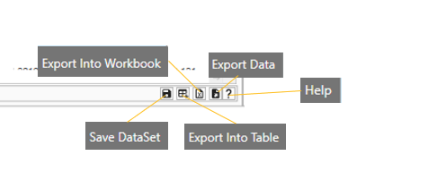
Exporting (subsets of) data into new files and tables
Data can be rapidly exported from the Dataset Scratch report in the following ways:
- Export To Table - Create a new DataJet table from the data in the query
- Export To file - export to delimited file
- Export To Workbook - Export to Excel
Various export options are available:
- Export the data in the existing display template - exports the fields in the display grid
- Specify another template to use for the export - exports fields in a pre-configured template
- Export displayed data or source data - Export the displayed data, or the source data from which it was derived (where data has been decoded or banded)
- Include/Exclude headers
- Specify export location
- Create an audit file