- The user is logged in to a DataJet realm
- The active realm contains the DJDemo2023 demo data files
- See Step 1 - Prepare and Upload Data if these conditions are not yet complete
Approach
In order to create the Basic Sales Dashboard, it is first necessary to load sales and customer data. The tutorial will load data from the "DJDemo2023" database.
This article shows how to:
- Create a project by loading transaction data from a delimited file
- Inspect loaded data
Key Techniques
The following functional areas are introduced by this step:
Video Tutorial
Create Project and Load Data
- We will use Quick Load | New Project From File to create the project
- The Demo Data in the file djdemo2023.rar contains delimited files so we will load data using the Loading Data from a Delimited File Method.
(note - For details of other ways to create projects, see Introduction to Projects)
Create the Project by Loading the Data from a delimited file
From the Project Menu, select Quick Load | New Project From File and provide a project name - (for example, call the Project XXX-Demo2023 where XXX are your initials)
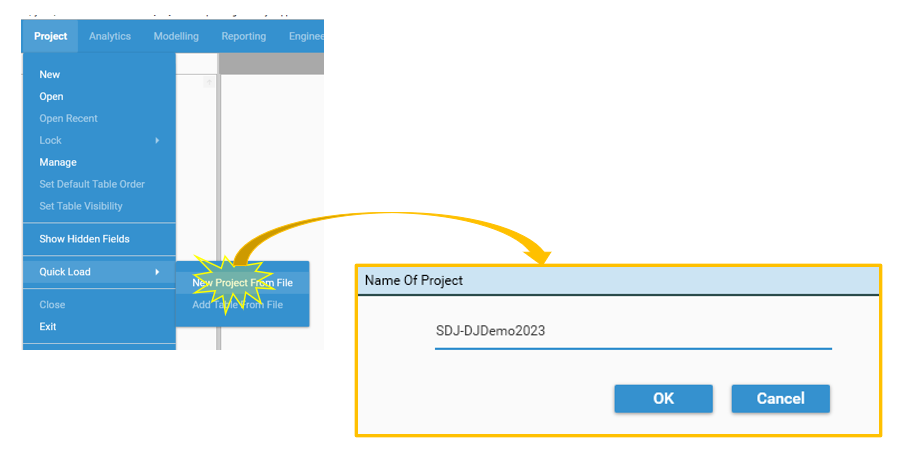
Click OK. The Load File dialog will be displayed.
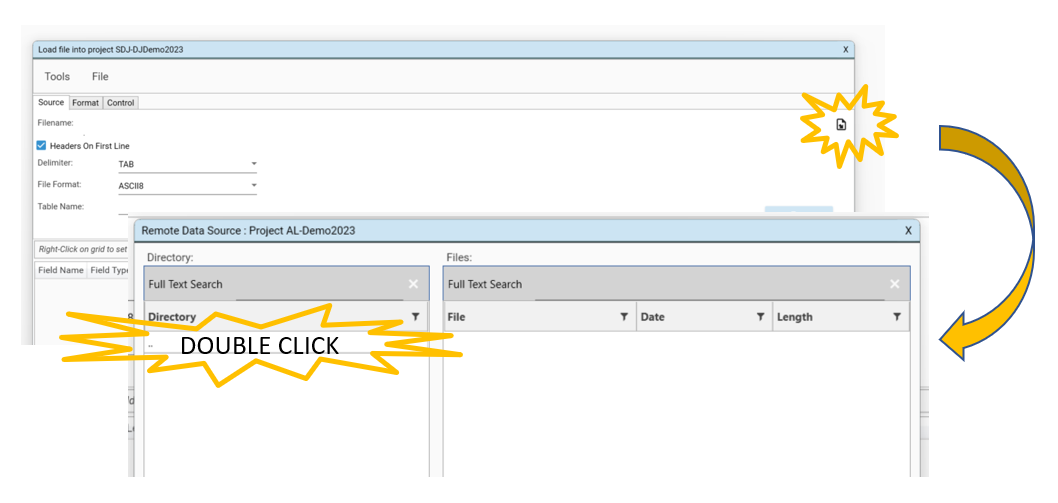
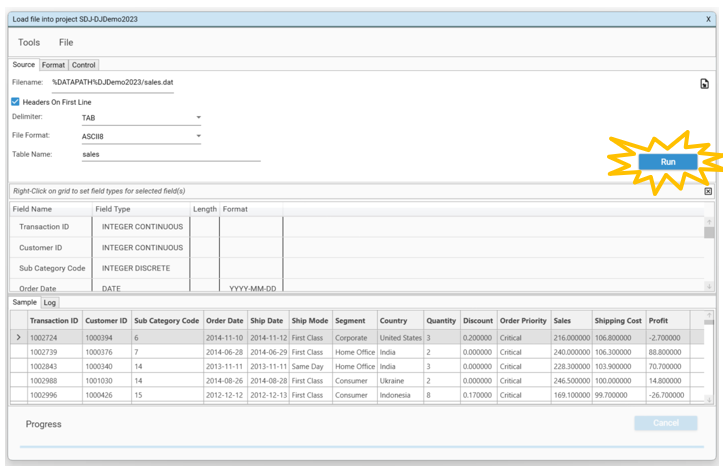
Select a file to import by clicking the file select icon (on the right-hand side of the page) to bring up the file selection dialog.
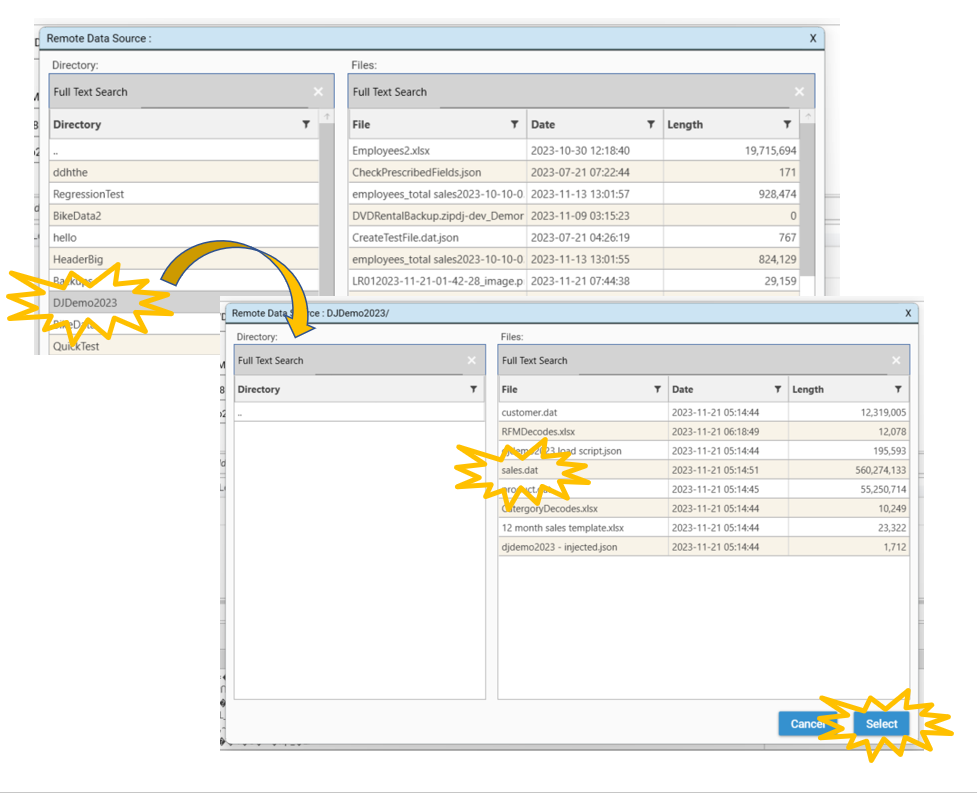
Select DJDemo2023/sales.dat file to load and select Open/Select.
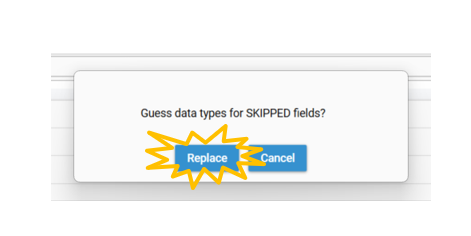
Select Replace in response to the message "Guess Data Types for SKIPPED fields?". This will automatically fill in data types for the content of the file.
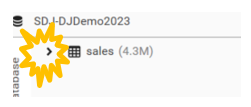
Click Run. The data will load, and the sales data will be visible in the Database Explorer.
Inspect the table to ensure that it has loaded as desired:
- Select the > Icon to expand the table and see the table schema
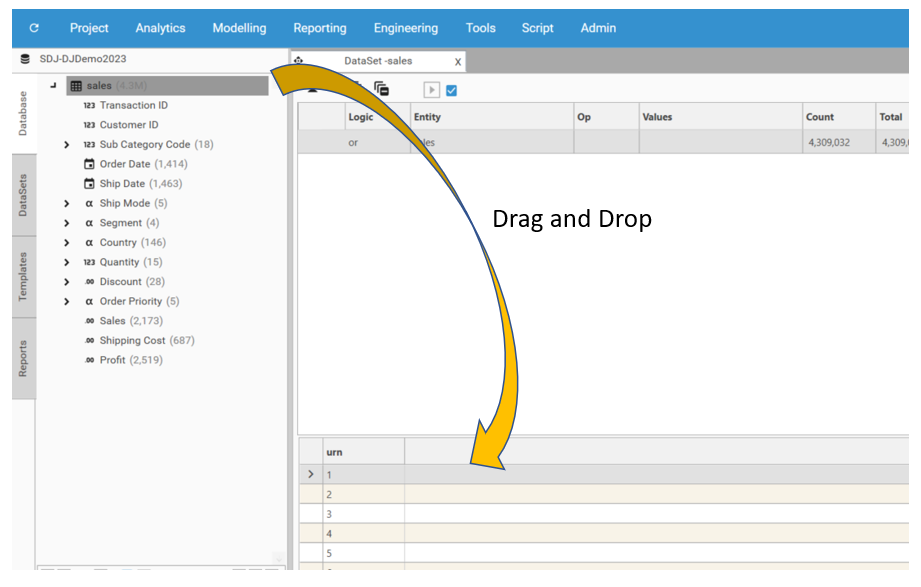
- Right-click the table object and choose Data View - a DataView tab will open
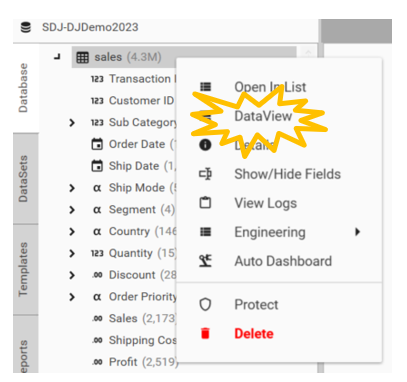
- Drag the table object and drop it onto the DataView grid in order to see the top 500 rows of data.
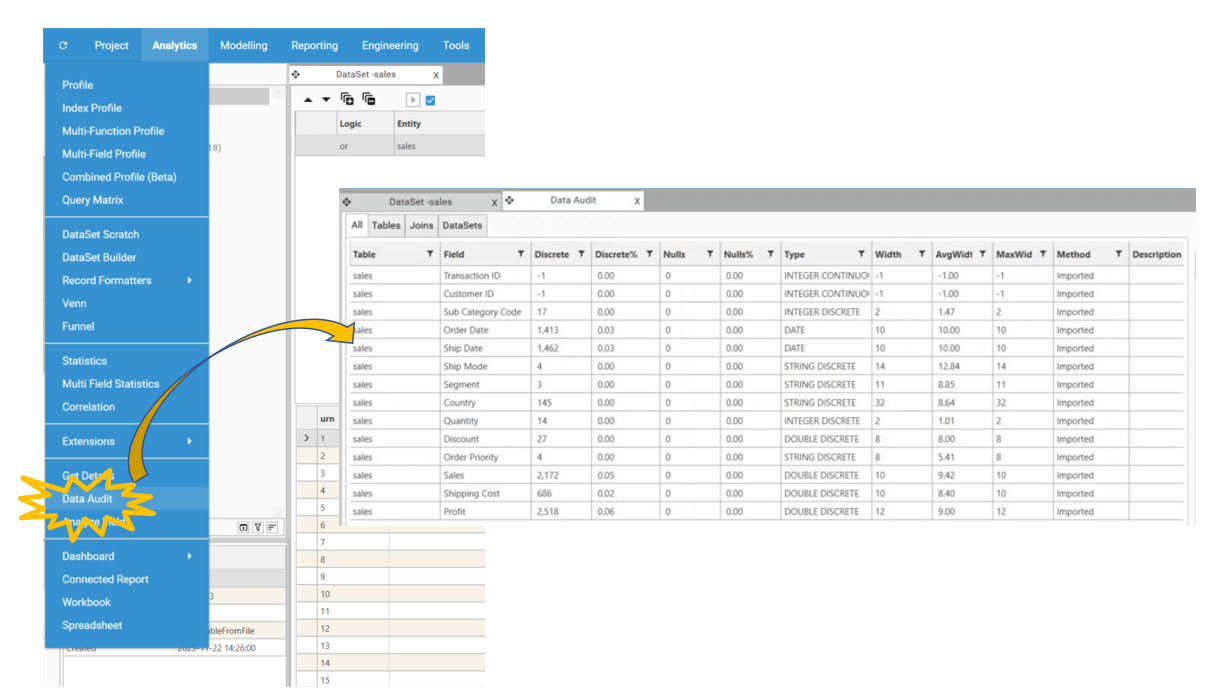
- Select Analytics | Data Audit to see summary data for the table.