The profile options dialog allows a greater level of control over the results returned from the profiling engine. To access the Options dialog use one of the following:
- right-click in the result grid and choose options
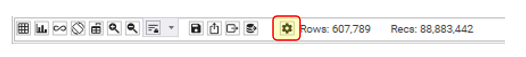
- select the "Settings" button in the mirco-toolbar:
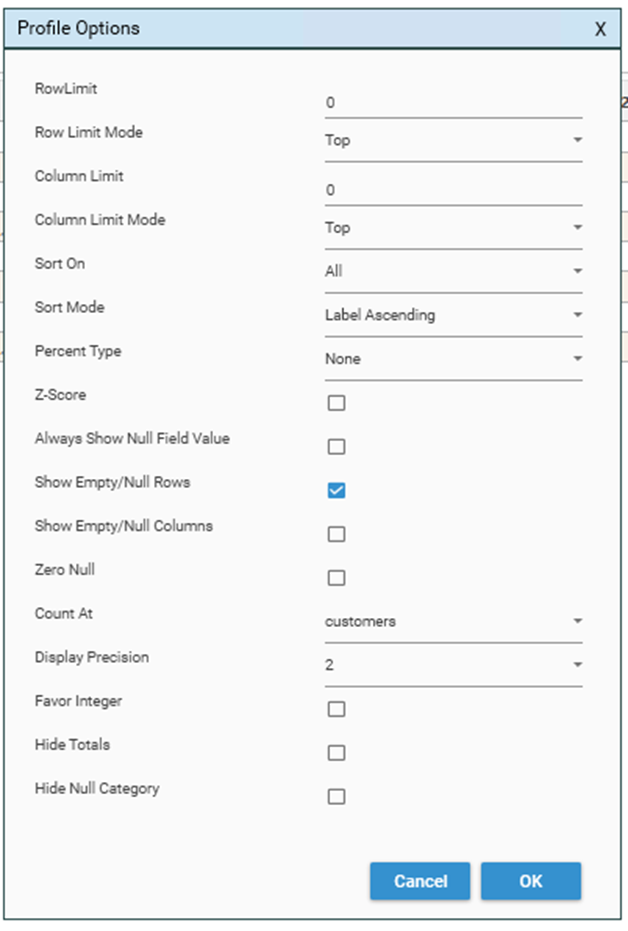
The Profile Options dialog will be displayed:
Row Limit
Specifies the maximum number of rows that will be displayed in the profile:
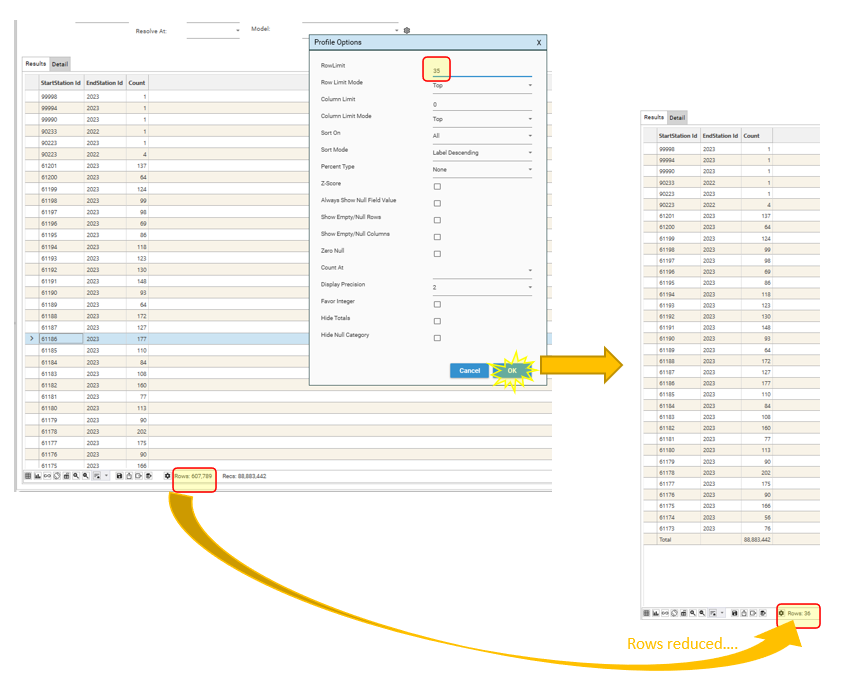
Zero (0) indicates all rows should be displayed.
Note that sort options will affect which rows are included in the result set.
Row limits can be useful if there are too many rows in the profile to display well in a chart. Sorting the data and choosing a row limit allows a graphic to be created where it would not otherwise be comprehensible.
Row limits are applied BEFORE Post functions but AFTER other options .
Row Limit Mode
Determines if the RowLimit is applied to the first (Top) or last (Bottom) 'n' rows of the profile.
Note that sort options will also affect the rows which are selected. See Sort On and Sort Mode.
Column Limit
The maximum number of columns that will be displayed in a profile that has a dimension configured as a pivot field.
Zero (0) indicates all columns should be displayed
Column Limit Mode
Determines if the Column Limit is applied to the first (Top) or last (Bottom) 'n' columns of the profile
Note that sort options will also affect the columns which are returned. See Sort On and Sort Mode.
Sort On
Determines what is being sorted in the result set. Default is ALL.
- ALL: Both Rows and Columns will be sorted.
- Rows: Only Rows will be sorted.
- Columns: Only Columns will be sorted
Sort Mode
Label Ascending:
- Results will be sorted by the labels from low to high.
Label Descending:
- Results will be sorted by the labels from high to low
Value Ascending:
- Results will be sorted by values, from low to high
- If Sort On = ALL, Rows will be sorted before columns.
- Column values will be sorted on the TOTAL column.
Value Descending:
- Results will be sorted by values, from high to low.
- If Sort On = ALL, Rows will be sorted before columns.
- Column values will be sorted on the TOTAL column
Percent Type
Default option = None
Note: This option is another way of configuring “SHOW”
None
If no percent type is selected, the values shown in each cell will be counts or the result of function calculations.
Total
If Total is selected, the value in each cell will be the value for the cell as a percentage of the GRID total:
(Cell Total/Grid Total) * 100
So if Grid Total is 5000, and the cell total is 500, the cell is 10.00 ((500/5000)*100).
The sum of each cell in the grid will be 100.
Row
ROW can only be selected as percent type if the results of a crosstab are being displayed (i.e.,, if there is a pivot on one of the dimensions).
If Row is selected, the sum of each row will be 100, and each cell in a row will be:
(Cell Total/Row Total) * 100
Column
If Column is selected, the value in each cell will be:
(Cell total/Column Total) * 100
The sum of each column will be 100.
Z-Score
Default = OFF
ON
The value in each cell will be the Z-score for the cell’s record set (where z-score reflects the standard deviations from the mean)
TODO: How is z-score calculated in a crosstab?
OFF
Always show null field value
If selected, the null value row (and column if calculating a crosstab) will be shown in the result grid.
The value will be shown even if the null field value has a count of 0.
Show empty/null rows
If selected, rows which have no records in them will still be displayed in the result set.
This can be useful if needing to keep a consistent axis across multiple reports as axis values which have no data will still be included. The default is to omit these values from the result set, which results in axes that change as filters and data change.
Show empty/null columns
If selected, columns that have no records in them will be displayed in the result set. This is only applicable when displaying crosstab results (i.e., profiles that have one of the dimensions pivoted).
Count at
Another way of configuring “Resolve At”. Determines which records will be counted.
Display Precision
The number of decimal places to display.
Favor Integer
If selected, decimal columns will display as integer if the decimal parts are all 0.
e.g., 123,234.00 would be displayed as 123,234
However, 123,234.43 would still be displayed as 123,234.43
(NOTE: To force all decimals to display as integer, set "asint" in the Post-Functions)
Hide Totals
If selected, no totals will be displayed in the profile result set.
Hide Null Category
If selected, the NULL category will not be displayed in the result grid (i.e., the row "null" will be missing).
This setting DOES NOT over-ride "Always show null field value", but DOES over-ride "show empty/null rows" and "show empty/null columns"