A Venn diagram is a visualisation used to show the overlap between two or more datasets or segments. It uses overlapping circles to illustrate the commonality of records between segments, giving an instant understanding of inclusion and exclusion for the different possible combinations.
Report Overview
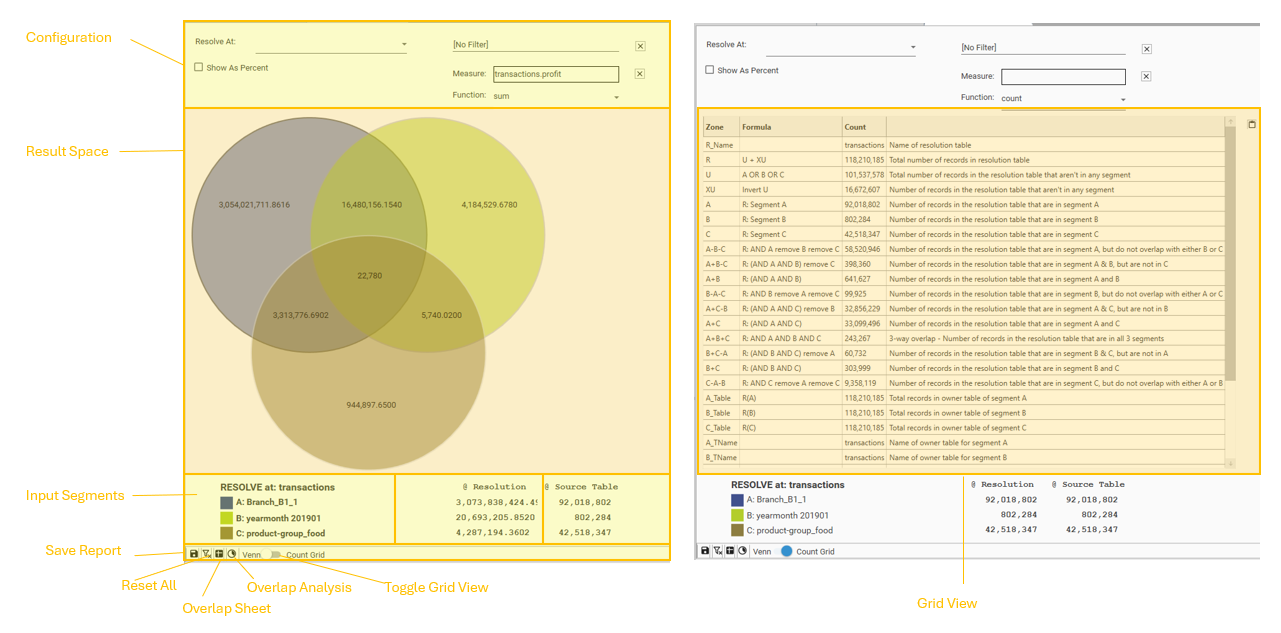
The Venn Report consists of the following areas:
- Configuration - determines what is being counted
- Result Space - this is where segments are dropped and counts are displayed
- Input Summary - Details current report inputs
- Grid View - a detailed breakdown of all the data points provided by the calculation
Purpose and Use Cases
The primary purpose of the Venn Report is to analyse and visualize the relationships and shared memberships among distinct groups or categories within a larger dataset.
The Venn Report aids in:
- Comparison of Datasets: Visually highlights overlaps and differences between segments, simplifying the identification of records that meet specific inclusion or exclusion criteria.
- Deeper Analysis: Enables selection of records from one or more intersections for detailed examination, uncovering deeper insights into data patterns.
- Communication: Provides a simple yet powerful visualization to effectively communicate complex relationships and segment interactions to stakeholders.
Common Use Cases
Typical uses of the Venn report include:
- Customer Overlap Analysis: Identifies customers interacting with multiple products, services, or marketing channels (e.g., frequent buyers who also engage with email campaigns).
- Fraud Detection: Detects suspicious patterns by visualizing overlaps in potentially fraudulent transactions across datasets or systems.
- Market Segmentation: Reveals shared behaviours or characteristics across demographic, psychographic, or behavioral groups to refine marketing strategies.
- Analysing Probabilities: Depicts the likelihood of events occurring together or independently, aiding in risk assessment or forecasting.
Key Concepts
- Dataset (or Segment or Set): The result of a "select" query, representing a group of records defined by specific criteria. See Datasets and Collections for further details on defining and managing datasets.
- Overlap (or Intersection): The subset of items that are members of two or more datasets simultaneously, represented by the overlapping regions of the Venn diagram.
- Exclusive Intersection Count: The number of items that belong exclusively to the specified datasets within a combination set and not to any other datasets included in the analysis. This is the primary count displayed for each combination row in the Venn Report.
- Set Size Count: The total number of records in each individual input dataset.
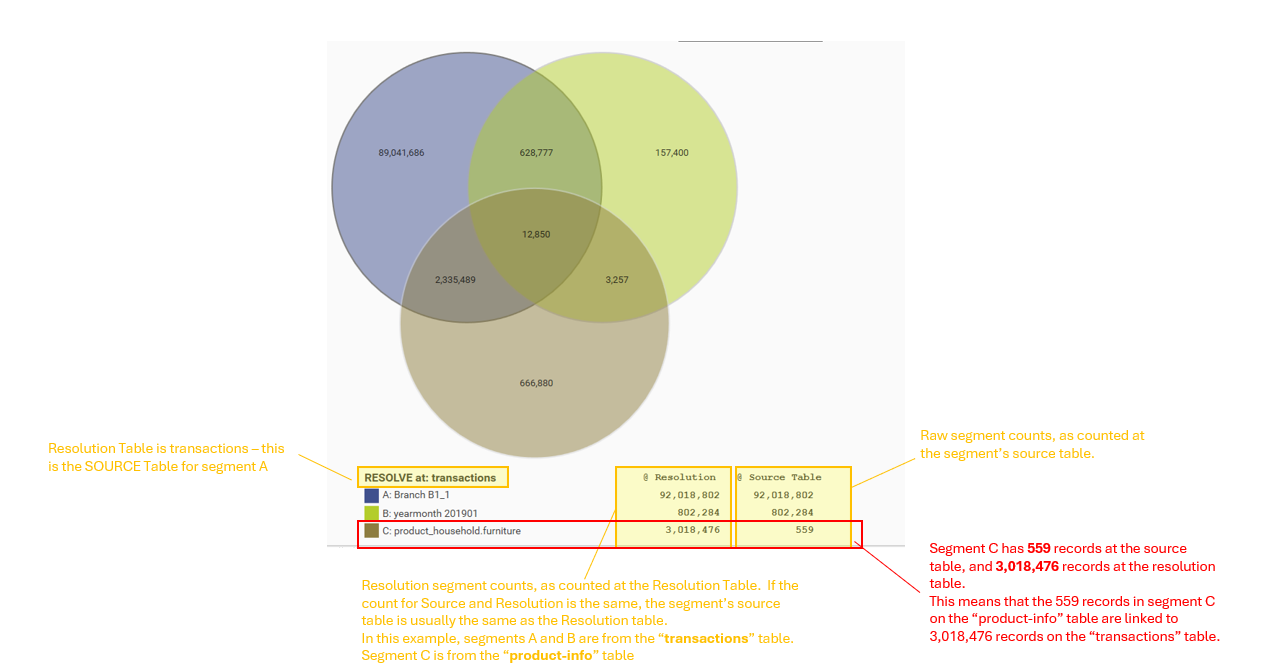
- Resolution Table: The table providing the records which are being counted.
- Source (or owner) Table: The table from which a segment is taken.
- Base Filter: A preliminary filter applied to the entire dataset before generating the Venn Report, used to restrict the universe of data to a specific subset (e.g., excluding inactive users or records outside a date range).
- Measure: A metric or attribute used to quantify the records in the Venn Report, such as count, sum, or average (e.g., number of transactions, total revenue, or average purchase value). The measure defines what is being calculated for each dataset or intersection.
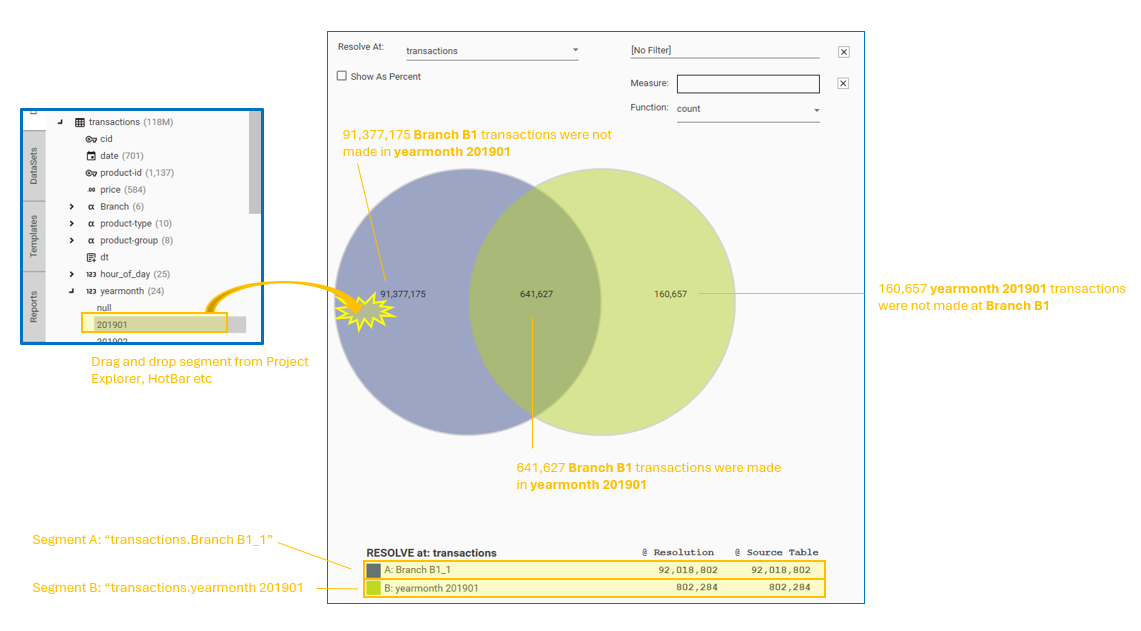
How to Create a Venn
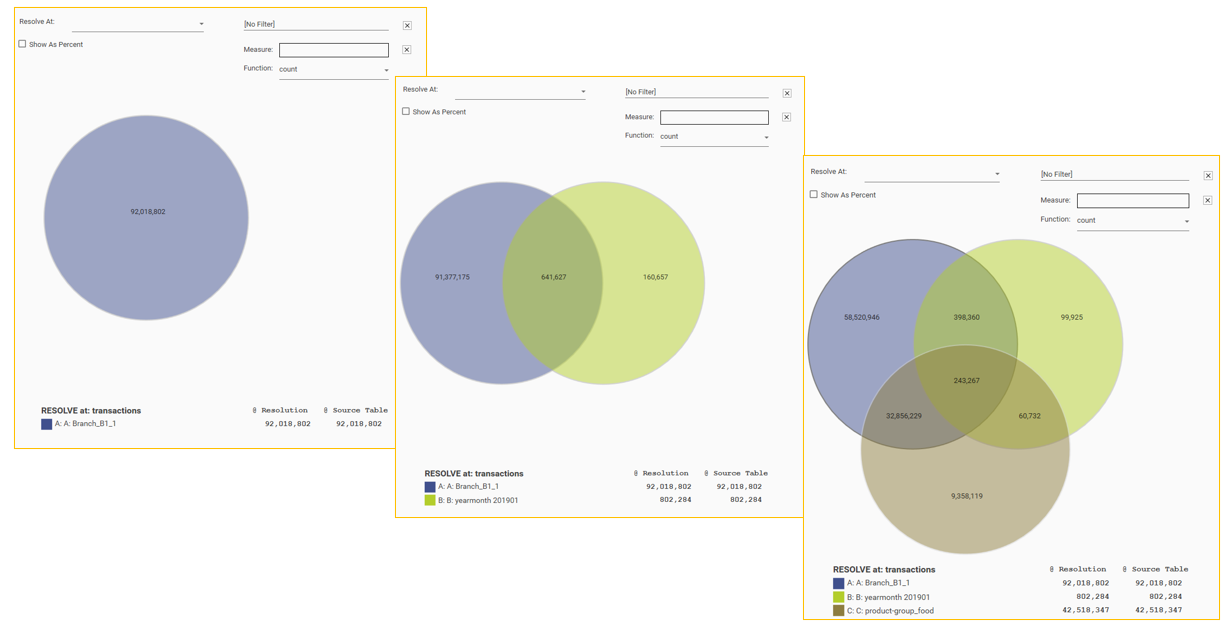
To create a Venn diagram, drag and drop 1 to 3 segments from the Project Explorer or HotBar onto the Report Display area. The report will instantly calculate the intersections and display a set of one or more overlapping circles:
Resolve At
The resolution level or table of the Venn is critical because it determines WHAT is being counted. By default the resolution level of the calculation will be the source table of segment A. This means that the counts in the Venn diagram represent records in the segment A source table. The resolution table is displayed above the segments.
If all segments are coming directly from the same resolution table, a Venn report is easy to understand because all counts at all stages of the calculation are referring to records from the same table.
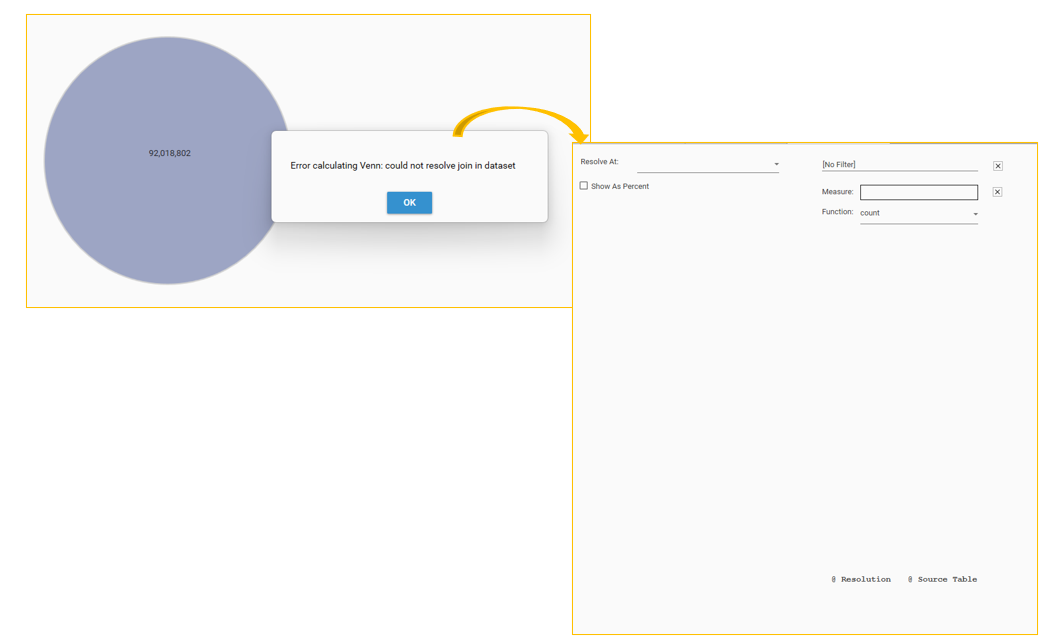
If either segment B or C is NOT linked to segment A's source table, an error will be generated when that segment is dropped onto the report and the report will be blanked out:
- Drag Table 1 from the Project Explorer and drop into the hotbar to create a dataset.
- Drag Table 2 from the Project Explorer and drop on top of the Table 1 dataset
If the tables are joined, the count of Table 1 records that are also in Table 2 will be displayed. If the tables are not displayed a "..." symbol will be displayed.
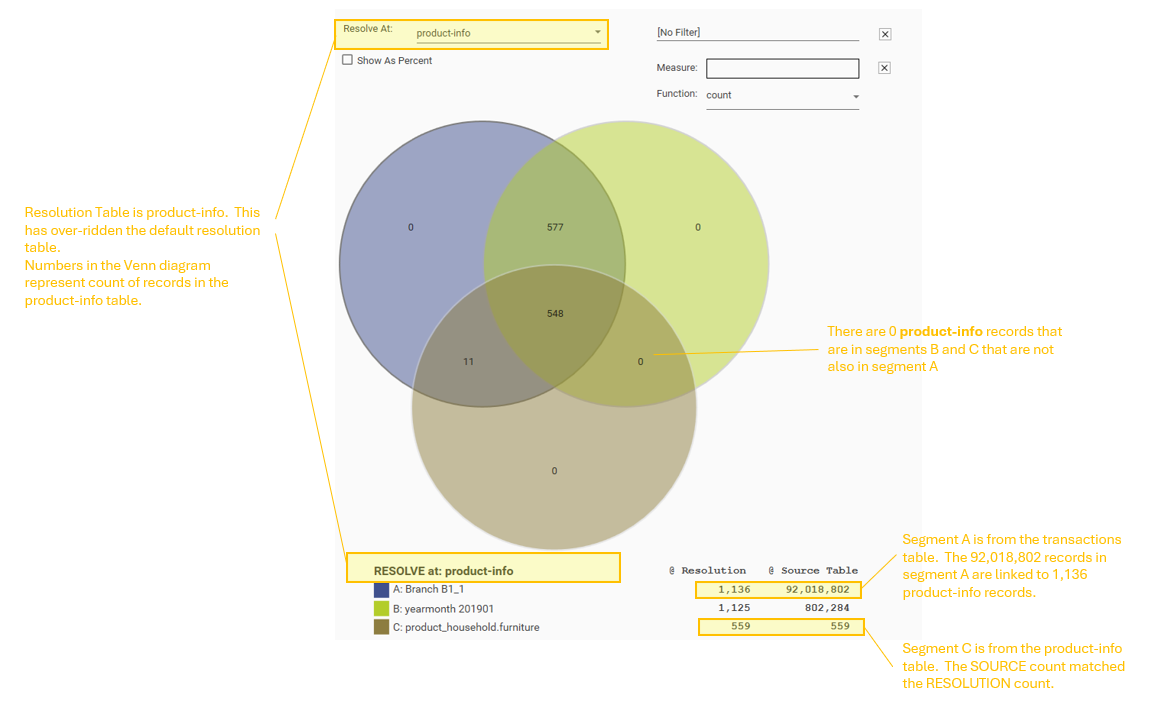
The resolution table can be changed using the Resolve At drop-down:
Although a Venn diagram is simple to look at, care must be taken to understand exactly what the counts mean, especially if:
- simple segments have been taken from different tables,
- a base filter has been applied
- the resolution table has been explicitly set
- individual input segments have been built by combining segments from different tables - this is the scenario where the results given by the Venn are the most likely to be misinterpreted because the user is not always conscious that what is being counted has been expanded by changing resolution levels.
The order of calculation for a Venn is always this:
- Start with the resolution table (if this is not explicitly specified, it will be the source table of the first segment)
- AND in the base filter (if specified). This will reduce the base population accordingly.
- AND in the individual segments
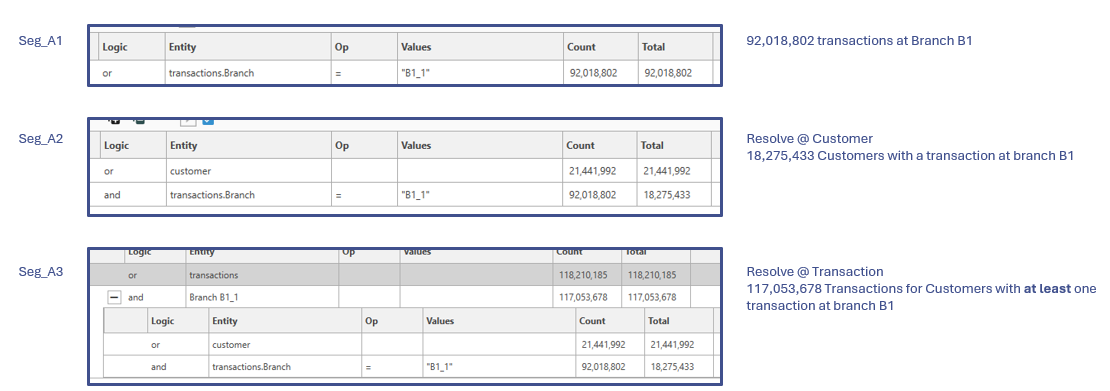
The following shows how changing resolution levels in a dataset can make a big difference to what is being counted. It might be expected that because the segment resolution level is going from Transaction to Customer and back to Transaction the query would give the same count at the end as there was at the start. This can be the case, but is not always what happens, depending on the relationship between the tables. It is possible to change resolution levels in such a way that what is actually being counted expands.
- Working with just one Segment (A1) from the transaction table, we start with a count of 92,018,802 transactions
- Changing the resolution level to Customer gives a count of 18,275,433 customers with at least one transaction at branch B1
- Changing the resolution level back to Transaction does not take us back to 92,018,802. Instead it gives us the 117,053,678 transactions for customers with at least one transaction at branch B1.
This same principle can be at work in a Venn calculation, especially if input segments are cross-table queries. When working with a Venn diagram and changing resolution levels, it's important to pay attention to what is being counted at each step of the process. The following walks through interpreting what is being counted as different resolution levels are applied.
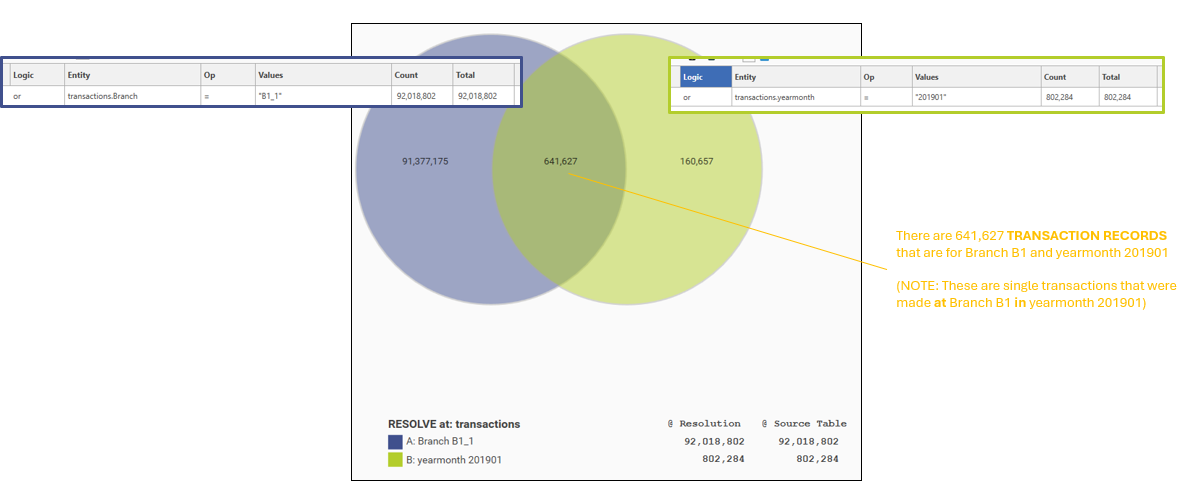
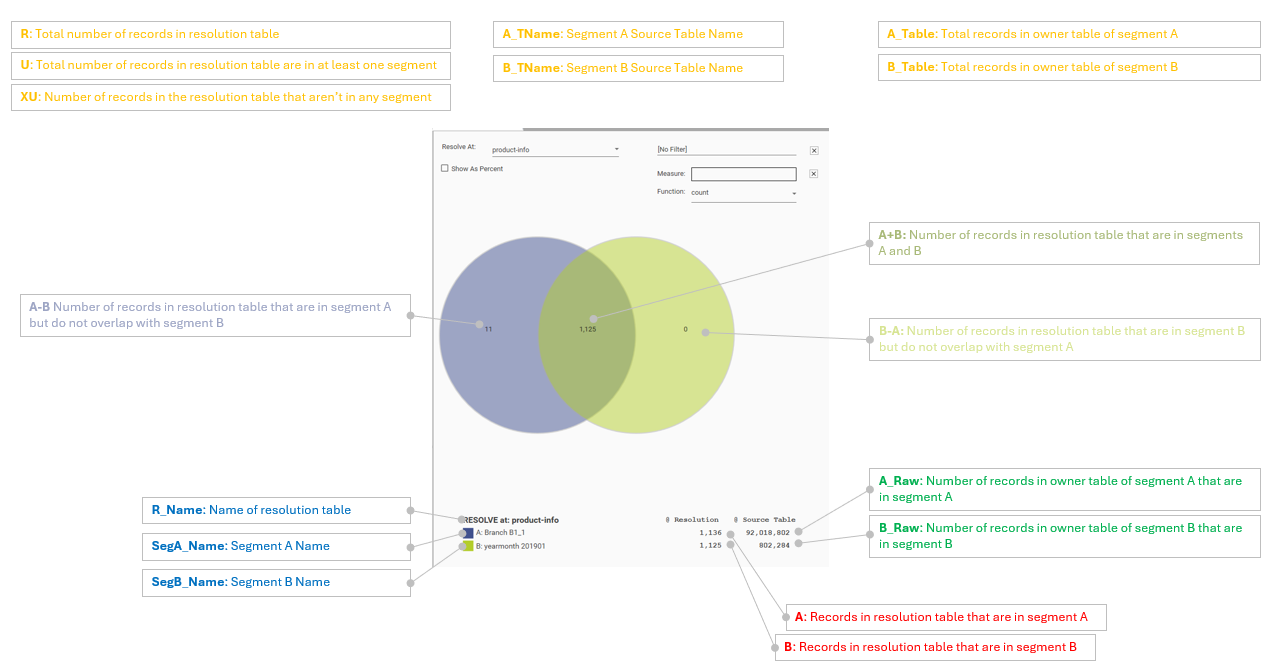
Step 1 - Transaction Segments @ the Transaction Level
This is the simplest kind of Venn and is straightforward to understand. All segments are from the Resolution Table, and so the intersection is counting transaction records that are in both segments A and B. i.e., transactions that were made at branch B1 in yearmonth 201901.
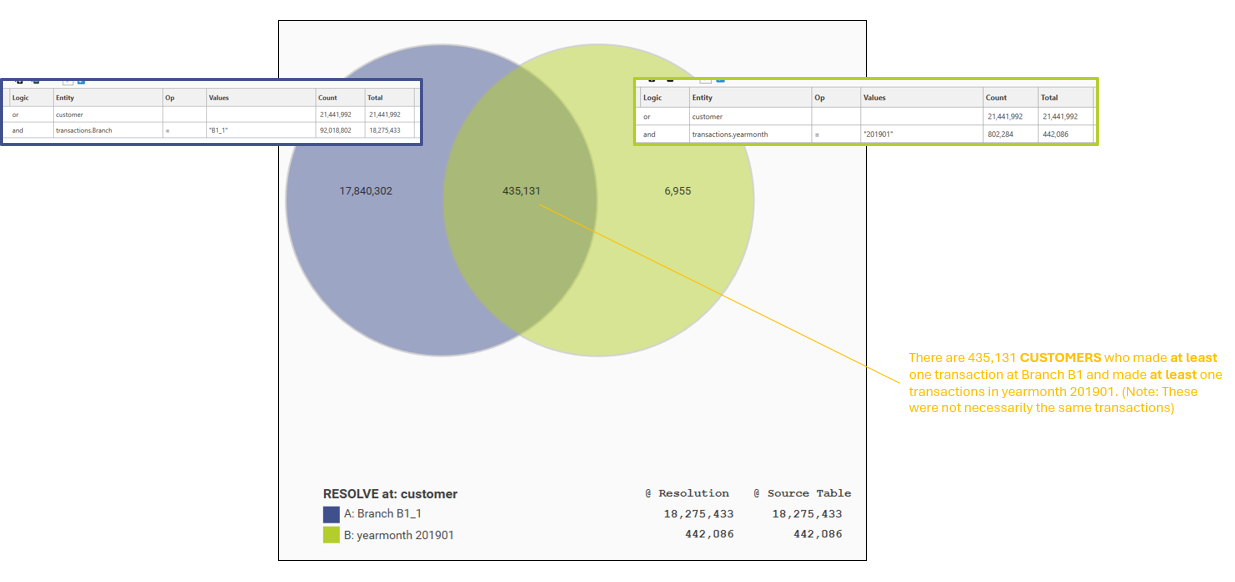
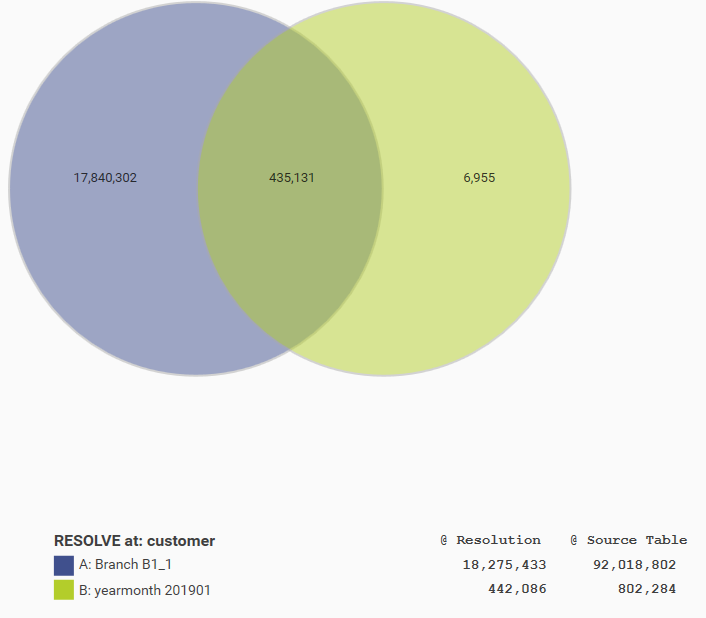
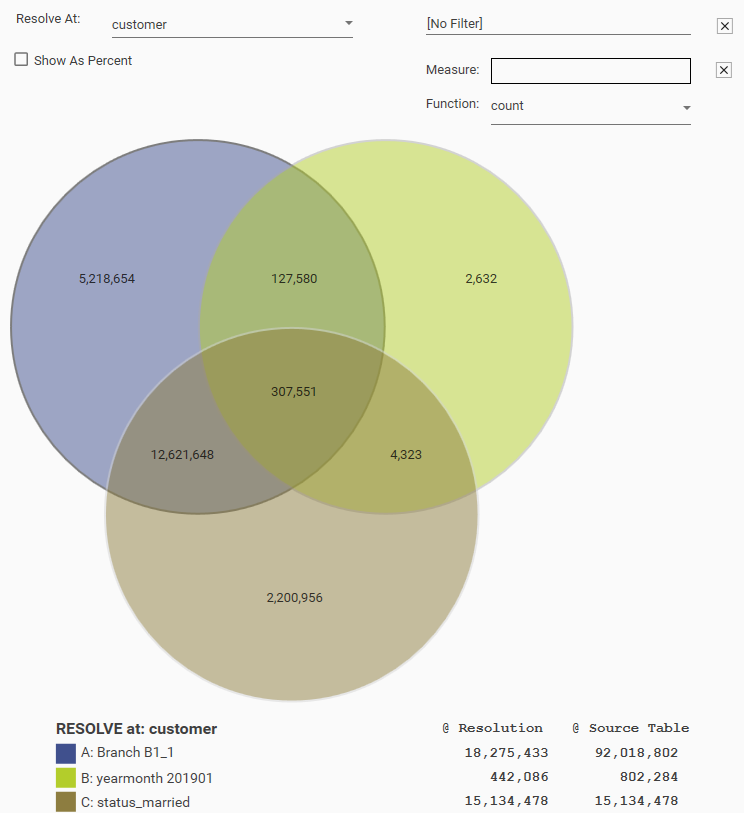
Step 2 - Transaction Segments @ the Customer Level
By taking the transaction segments to the customer level, we are now counting Customers instead of transactions. So we are counting all customers who made at least one transaction at Branch B1, and all customers who made at least one purchase in Jan 2019. Note that the concept of "at least" has now been included in the understanding of what is being counted.
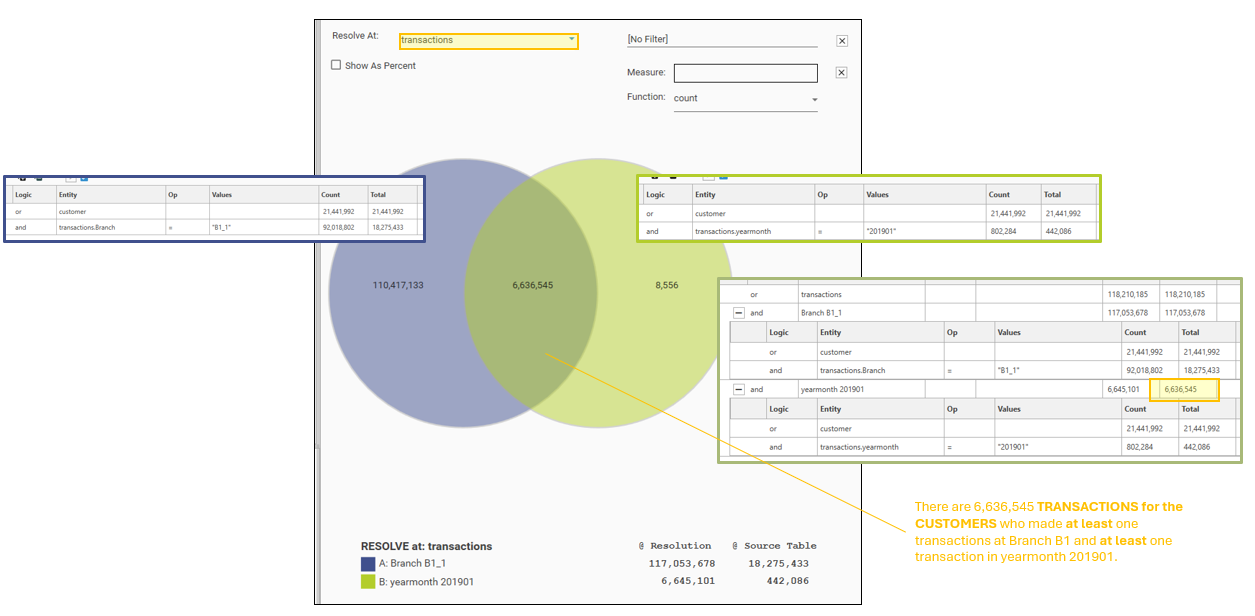
Step 3 - Customer Level Transactions Segments counted @ the Transaction Level
The resolution level is now changed back to Transactions, and this can become complex to understand. The original transaction segment was expanded in step 2 to find the customers associated with those transactions. Now we want to find the transactions associated with those customers, and so we have expanded the calculation to count the transactions for customers with at least one transaction for criteria A (Branch = B1) and at least one transaction for criteria B (Yearmonth = 201901)
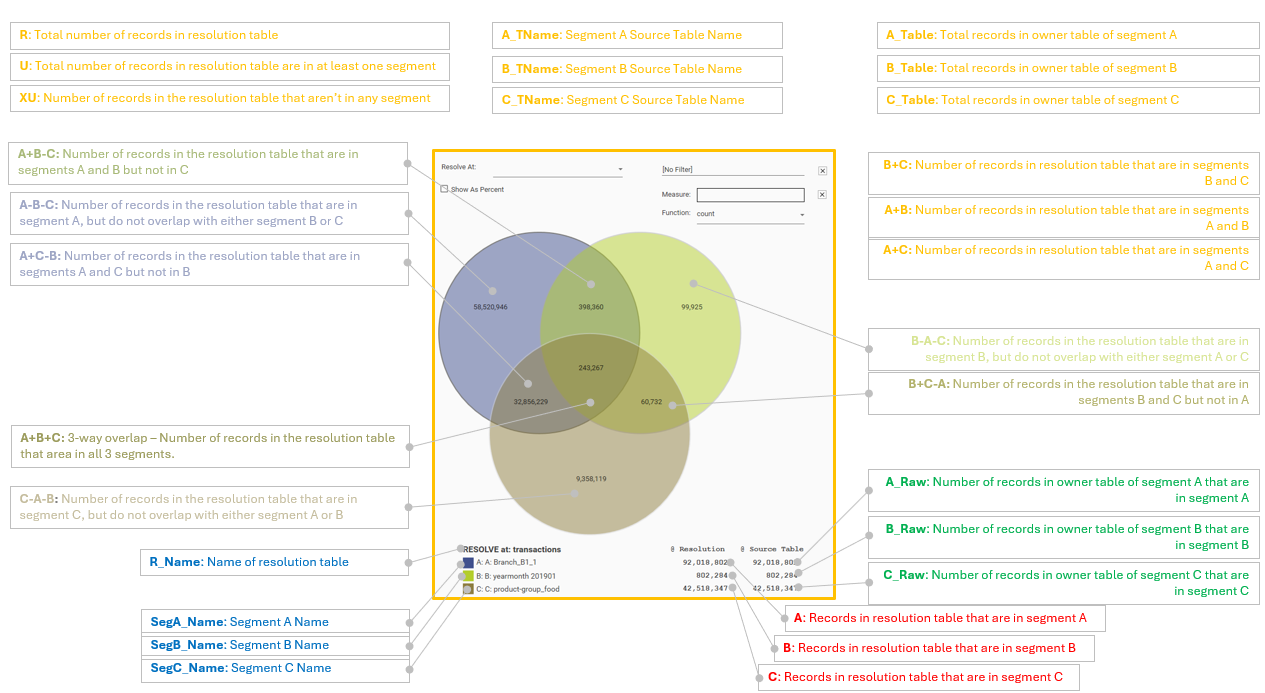
Grid Display & Key
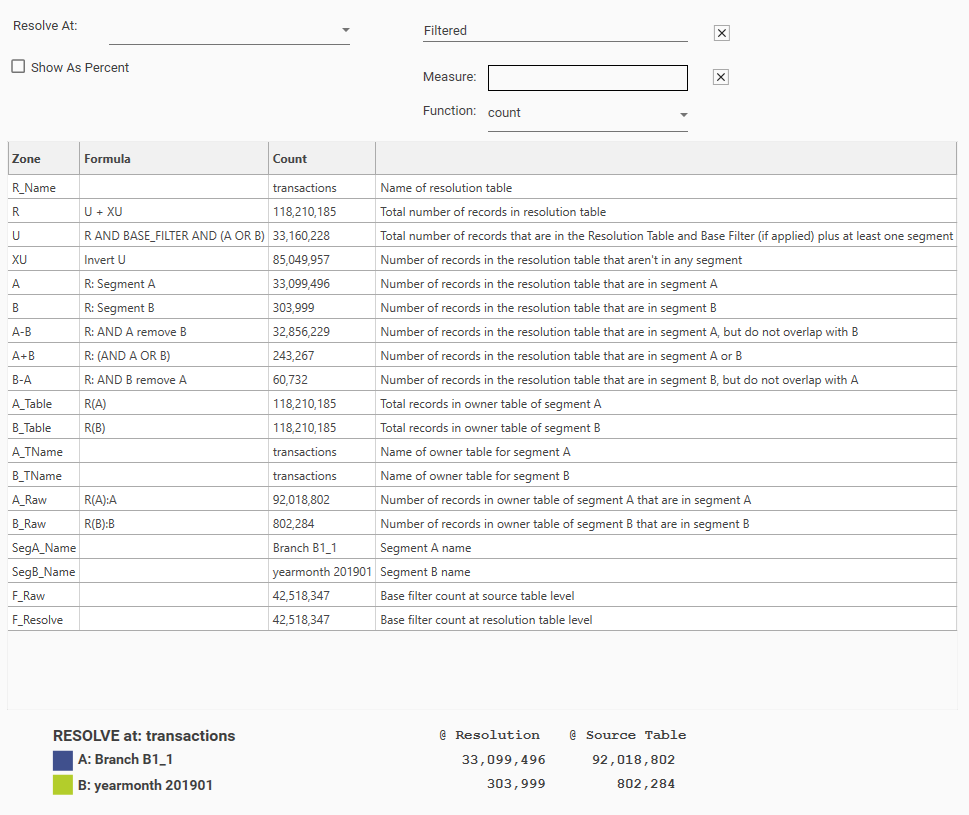
Toggling the grid display will show a full set of data points for the Venn. This can be copied to the clipboard using the clipboard icon. The grid displayed will depend on the number of segments in the Venn.
2 Segment Venn
| Section | Name | Example | Description | Formula | Zone |
|---|---|---|---|---|---|
 | Resolution Table | customer | Name of resolution table | - | R_Name |
 | Resolution | 21,441,992 | Total number of records in resolution table | U + XU | R |
 | Universe | 18,282,388 | Total number of records in the resolution table that are in at least one segment | R:(A or B) | U |
 | Excluded | 3,159,604 | Total number of records in resolution table that aren't in any segment | Invert U | XU |
 | Segment A | 18,275,433 | Number of records in the resolution table that are in segment A | R: Segment A | A |
 | Segment B | 442,086 | Number of records in the resolution table that are in segment B | R: Segment B | B |
 | A No Overlap | 17,840,302 | Number of records in the resolution table that are in segment A, but do not overlap with B | R: AND A remove B | A-B |
 | A or B | 18,282,388 | Number of records in the resolution table that are in segments A or B | R: (AND A OR B) | A+B |
 | A Overlap | 435,131 | Number of records in resolution table that are segments A and B | R: (AND A AND B) | (A+B) |
 | B No Overlap | 6,995 | Number of records in the resolution table that are in segment B, but do not overlap with A | R: AND B remove A remove C | B-A |
 | A_Table | 118,210,185 | Total records in owner table of segment A | - | - |
 | B_Table | 118,210,185 | Total records in owner table of segment B | - | - |
 | A_TName | transactions | Name of source table for segment A | - | - |
 | B_TName | transactions | Name of source table for segment B | - | - |
 | A_Raw | 92,018,802 | Number of records in source table of segment A that are in segment A | A | R(A):A |
 | B_Raw | 802,284 | Number of records in source table of segment B that are in segment B | B | R(B):B |
 | SegA_Name | Branch_B1_1 | Segment A Name | - | - |
 | SegB_Name | yearmonth 201901 | Segment B Name | - | - |
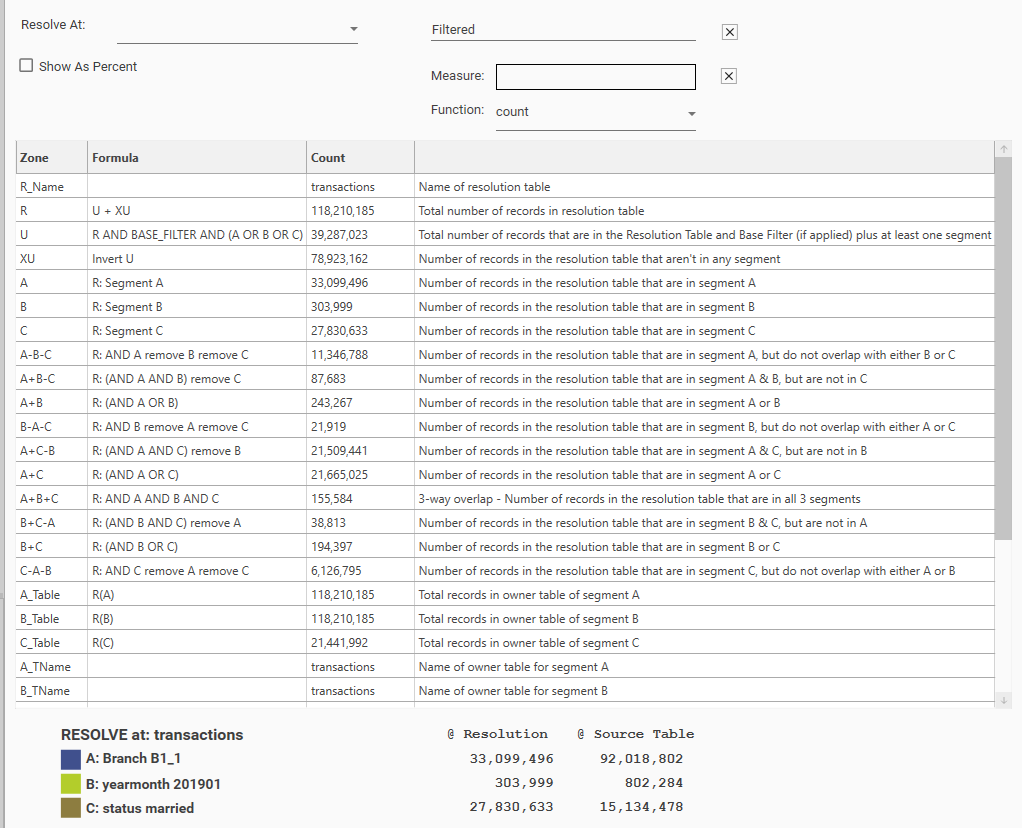
3 Segment Venn
| Section | Name | Example | Description | Formula | Zone |
|---|---|---|---|---|---|
| Resolution Table | customer | Name of resolution table | - | R_Name |
| Resolution | 21,441,992 | Total number of records in resolution table | U + XU | R |
 | Universe | 20,483,344 | Total number of records in the resolution table that are in at least one segment | R:(A or B or C) | U |
 | Excluded | 958,648 | Total number of records in resolution table that aren't in any segment | Invert U | XU |
 | Segment A | 18,275,433 | Number of records in the resolution table that are in segment A | R: Segment A | A |
 | Segment B | 442,086 | Number of records in the resolution table that are in segment B | R: Segment B | B |
 | Segment C | 15,134,478 | Number of records in the resolution table that are in segment C | R: Segment C | C |
 | A No Overlap | 5,218,654 | Number of records in the resolution table that are in segment A, but do not overlap with either B or C | R: AND A remove B remove C | A-B-C |
 | A B Overlap No C | 127,580 | Number of records in the resolution table that are in segment A & B, but are not in C | R: (AND A AND B) remove C | A+B-C |
 | A or B | 435,131 | Number of records in the resolution table that are in segments A or B | R: (AND A OR B) | A+B |
 | A and B | Number of records in resolution table that are segments A and B but not in C | R: (AND A AND B) | (A+B) - C | |
 | A Overlap | Number of records in resolution table that are in Segment A and at least one other segment. | R: (A AND B) OR (A AND C) | (A+B) + (A+C) | |
 | B No Overlap | 2,632 | Number of records in the resolution table that are in segment B, but do not overlap with either A or C | R: AND B remove A remove C | B-A-C |
 | B C Overlap No A | 4,323 | Number of records in the resolution table that are in segment B & C, but are not in A | R: (AND B AND C) remove A | B+C-A |
 | B or C | 311,874 | Number of records in the resolution table that are in segments B or C | R: (AND B OR C) | B+C |
 | B and C | Number of records in resolution table that are segments B and C but not in A | R: (AND B AND C) | (B+C) - A | |
 | B Overlap | Number of records in resolution table that are in Segment B and at least one other segment. | R: (A AND B) OR (B AND C) | (B+A) + (B+C) | |
 | C No Overlap | 2,200,956 | Number of records in the resolution table that are in segment C, but do not overlap with either A or B | R: AND C remove A remove B | C-B-A |
 | C A Overlap no B | 12,621,648 | Number of records in the resolution table that are in segment A & B, but are not in C | R: (AND C AND A) remove B | C+A-B |
 | C or A | 12,929,199 | Number of records in the resolution table that are in segments C or A | R: (AND C OR A) | C+A |
 | C and A | Number of records in resolution table that are segments C and A but not in B | R: (AND C AND A) | (C+A)-B | |
 | C Overlap | Number of records in resolution table that are in Segment C and at least one other segment. | R: (C AND A) OR (C AND B) | (C+A) + (C+B) | |
| A_Table | 118,210,185 | Total records in owner table of segment A | - | - |
| B_Table | 118,210,185 | Total records in owner table of segment B | - | - |
 | C_Table | 21,441,992 | Total records in owner table of segment C | - | - |
| A_TName | transactions | Name of source table for segment A | - | - |
| B_TName | transactions | Name of source table for segment B | - | - |
 | C_TName | customer | Name of source table for segment C | - | - |
| A_Raw | 92,018,802 | Number of records in source table of segment A that are in segment A | A | R(A):A |
| B_Raw | 802,284 | Number of records in source table of segment B that are in segment B | B | R(B):B |
 | C_Raw | 15,134,478 | Number of records in source table of segment C that are in segment C | C | R(C):C |
| SegA_Name | Branch_B1_1 | Segment A Name | - | - |
| SegB_Name | yearmonth 201901 | Segment B Name | - | - |
 | SegC_Name | status_married | Segment C Name | - | - |
As percent
If As Percent is selected, instead of displaying counts, the Venn will display section counts as a percentage of the resolution table: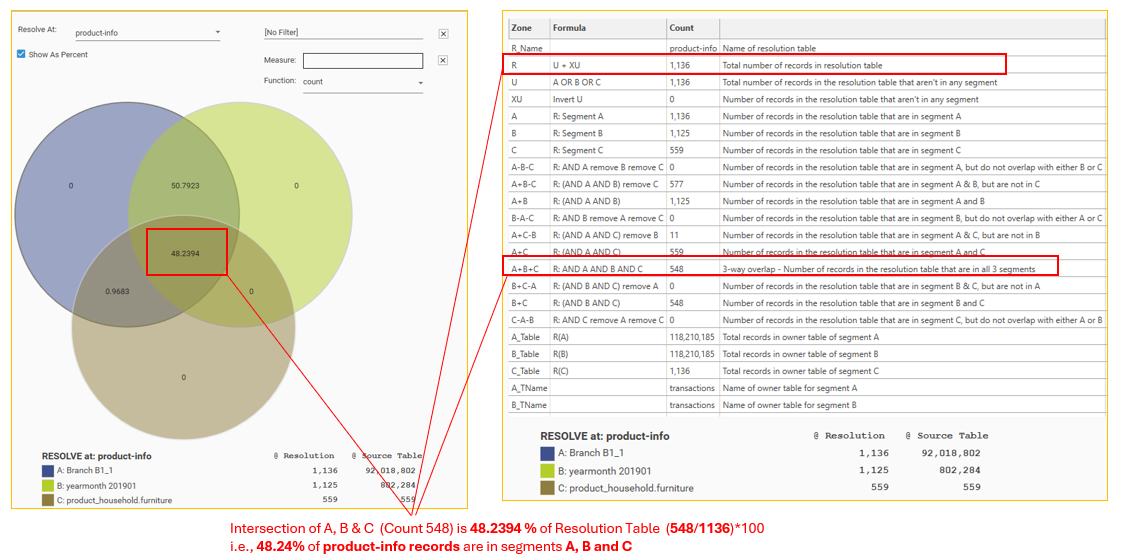
Base Filter
Apply a preliminary filter (usually referred to as a base filter) to the entire dataset before generating the Venn Report in order to restrict the universe of data to a specific subset (e.g., excluding inactive users or records outside a date range).
Drag and drop a dataset from the Project Explorer or HotBar and drop onto the filter box:
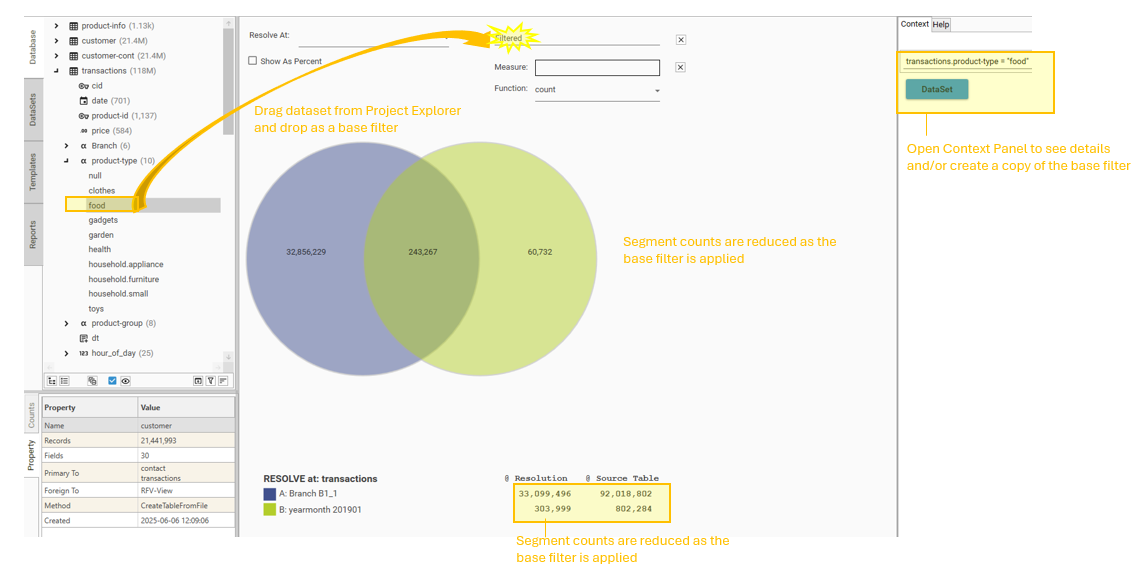
To delete the filter, click the [X] icon.
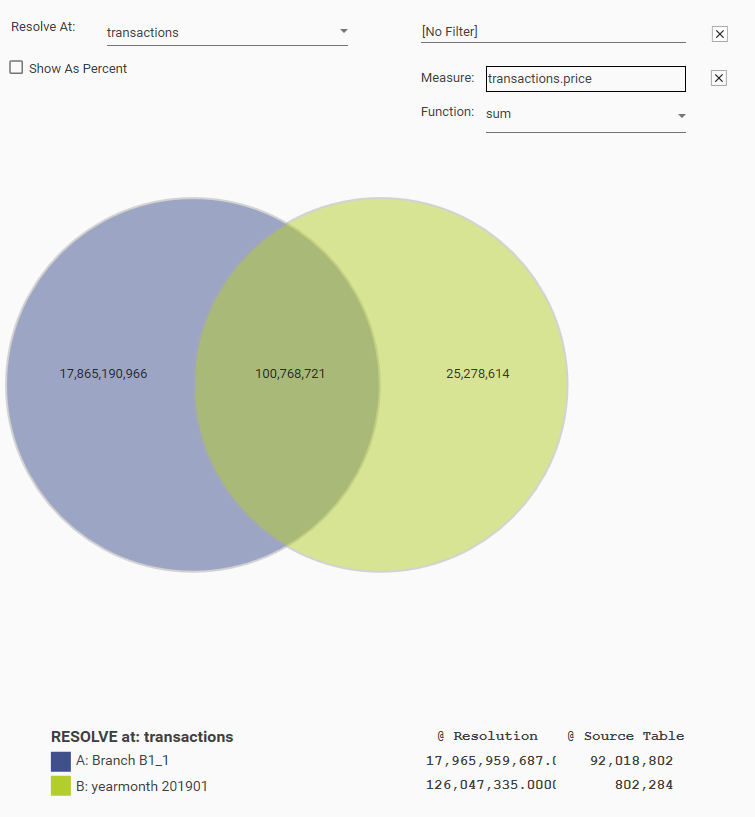
Measure
Usually a Venn diagram will be showing counts of records. However, assuming the data model allows, it may be desirable to display a calculated metric - for example, Total Sales.
To apply a measure, drag a numeric field (from the resolution table) and drop into the Measure box. Then select a function.
Extracting Data
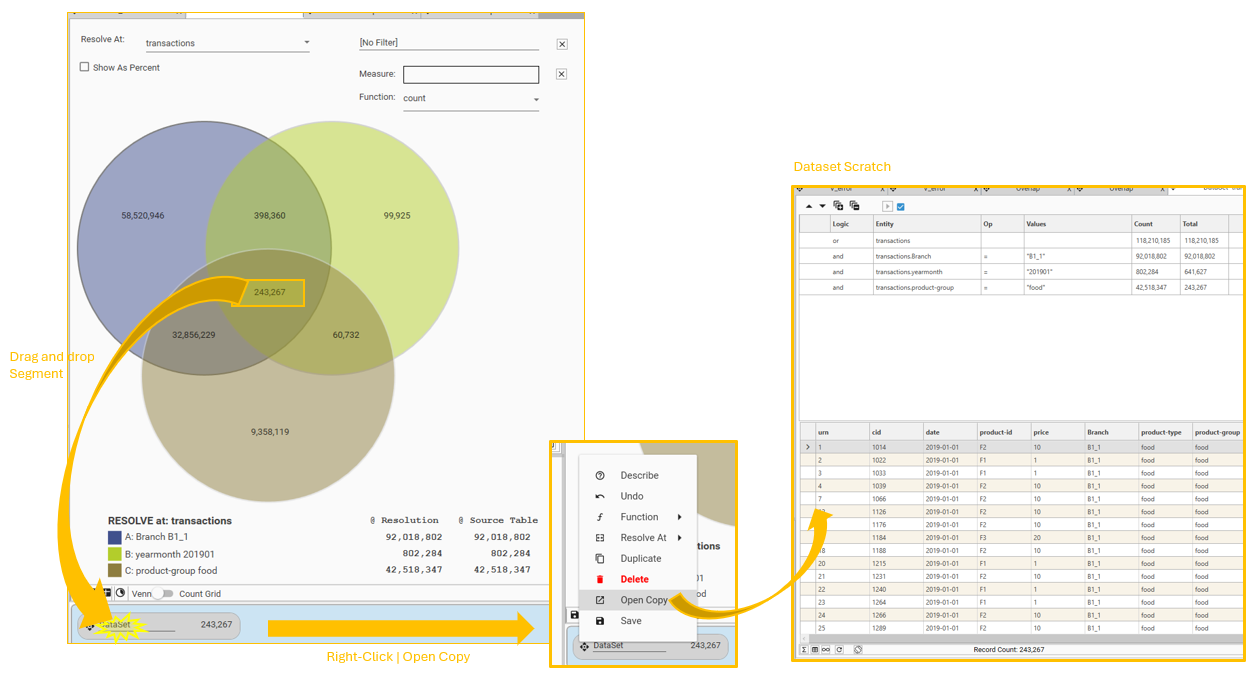
One of the most useful features of the Venn report is the ability to easily extract the underlying records from the calculation. To select records, drag from the intersection of interest and do one of the following:
- drop onto the workspace header bar:
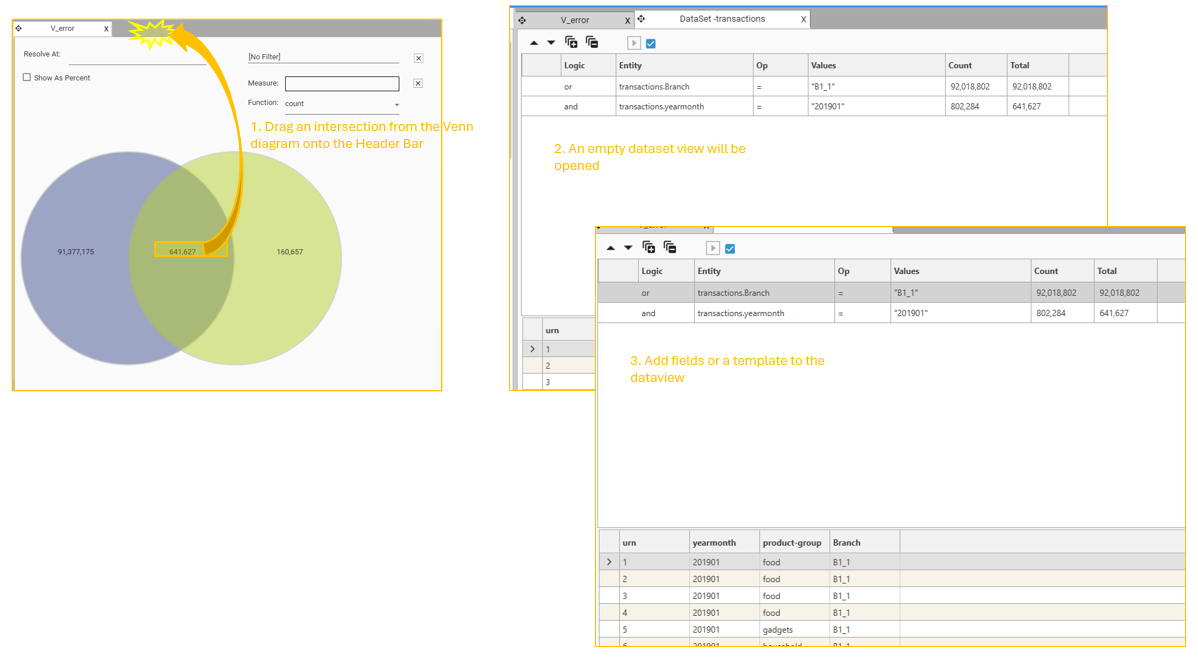
- drop into the hotbar:
From here, the segment can be:
- Inspected in Dataset Scratch (right-click, open copy)
- Dropped onto another analytical report as a filter - e.g., index profile, profile
- Dropped onto a dashboard
- Exported to file
- Saved as a dataset or a dataset field
Overlap Analysis
Select the "Overlap Analysis" button to display the current Venn in the Overlap Analysis Report. This is useful if intersectional counts need to be calculated for more than 3 segments. Up to 19 segments can be added to the Overlap Analysis report.
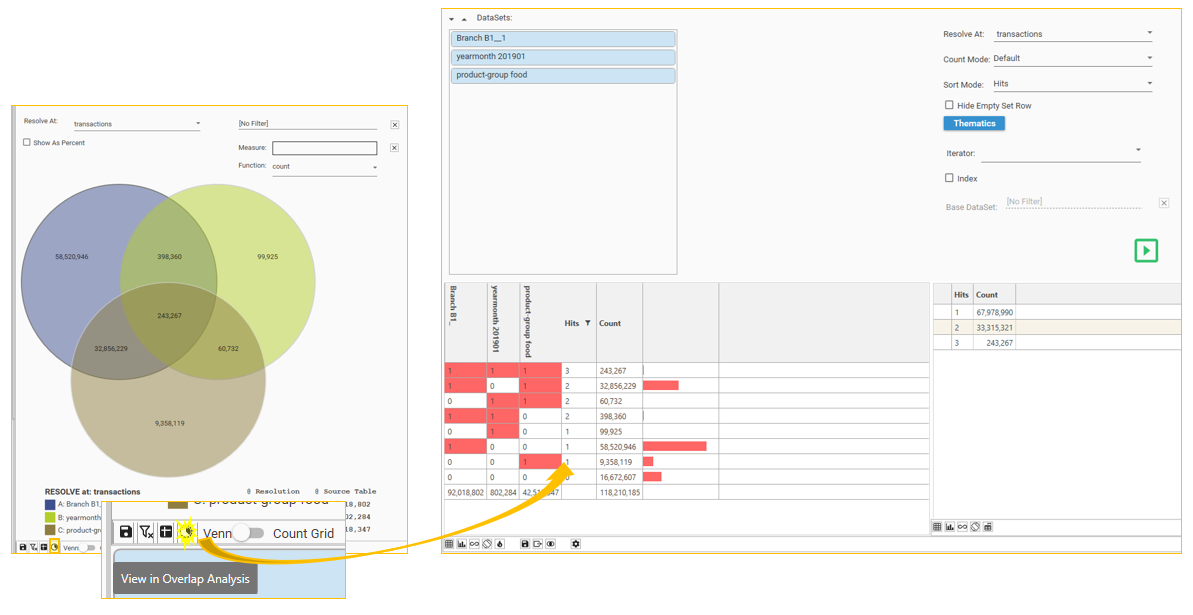
Overlap Grid
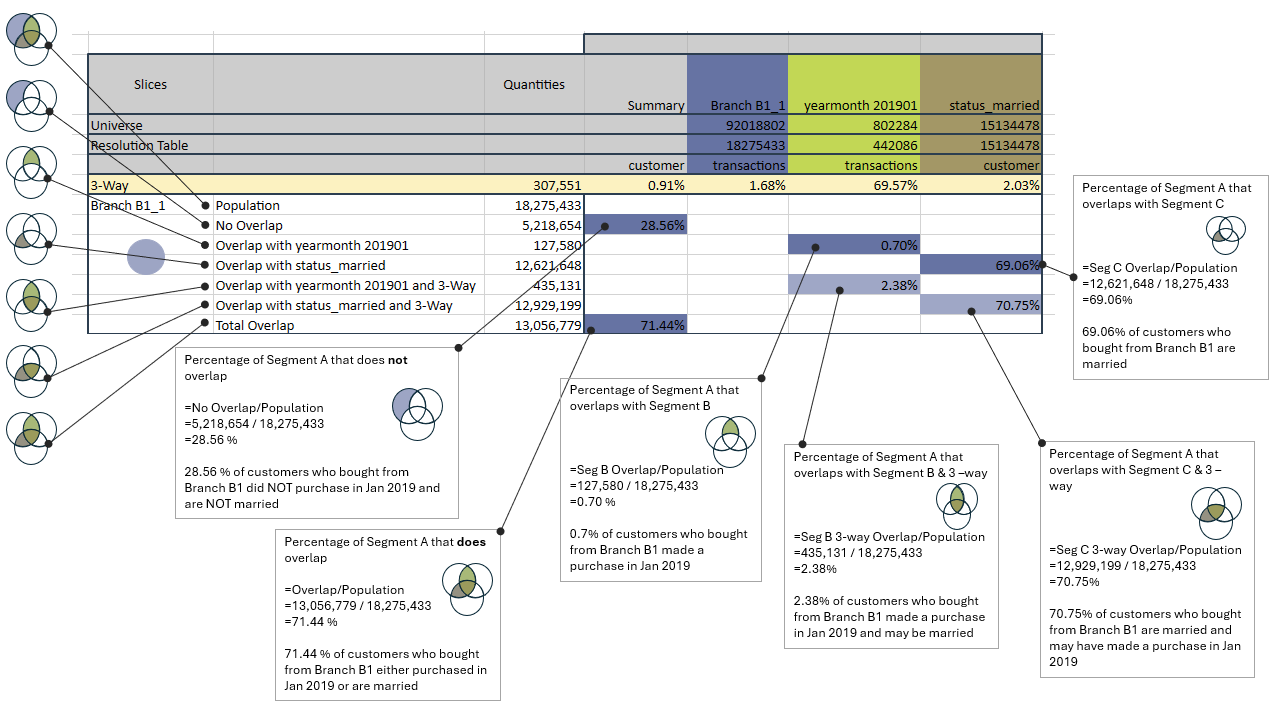
For a 3 way Venn, an Overlap Grid is available that shows different overlap combinations as percentages of the POPULATIONS they are taken from.
Select the overlap grid icon to open a Venn Overlap Sheet:
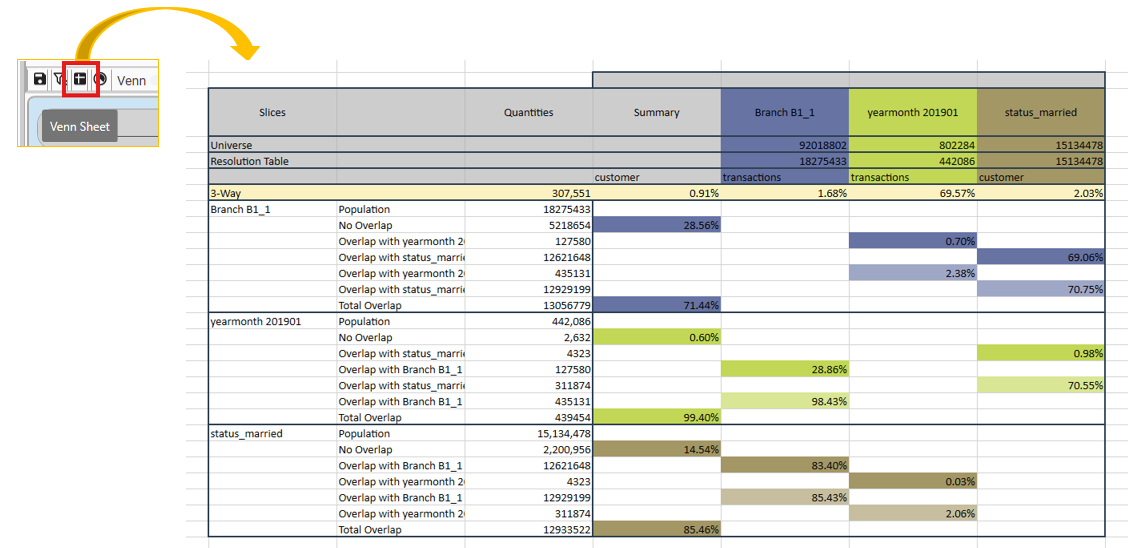
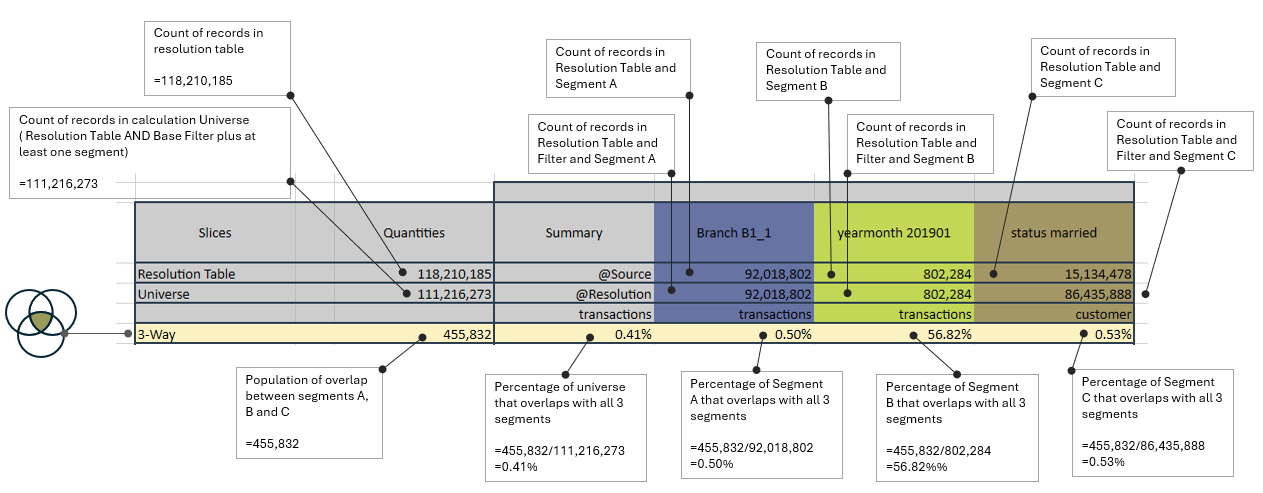
Interpretation of header and summary
The header section of the the Overlap Grid gives a quick summary of percentage overlaps for the 3-way overlap. These percentages are given at the following levels:
- overlap as a percentage of the universe (e.g., 0.41% of the universe records are present in all 3 segments)
- overlap as a percentage of segment A (e.g., 0.50% of segment A records are present in all 3 segments)
- overlap as a percentage of segment B (e.g., 56.82% of segment B records are present in all 3 segments)
- overlap as a percentage of segment C (e.g., 0.53% of segment C records are present in all 3 segments)
These percentages allow the user to quickly see what proportion of records in an individual segment overlap with all other segments.
The header also contains various data points that are used in the percentage calculations of the rest of the Overlap grid, including:
- Count of records in the Resolution Table
- Count of records in the calculation universe (Note - this refers to records in the resolution table and includes the filter if it has been applied)
- Segment counts at their source tables
- Segment counts at the resolution table (note, this will have the filter applied if one has been specified)
Interpreting the Overlap Grid - Segment A
Overview
Each horizontal section of the overlap grid calculates overlap ratios for a specific segment. The example below details the overlaps between segments A, B and C from the perspective of the segment A population (purchases made in Branch B1). This gives an insight into the proportions of segment A that correlate to the other segments in the calculation. Note that the summary table is the customer table. In this instance, the grid details how Branch B1 transactions correlate with Jan2019 purchases and married customers.
Insights
- Strong A-C Correlation: The high overlap between Segment A (Branch B1) and Segment C (married) suggests that a majority of customers purchasing from Branch B1 are married.
- Limited B-C Overlap: The low overlap between Segment B (January 2019) and Segment C (married) at 0.70% indicates that marital status is not a strong predictor of January 2019 purchases.
- Transaction Distribution: Segment C has the highest transaction count (1,513,478), followed by Segment A (920,188) and Segment B (802,284), reflecting higher activity among married customers or those buying from Branch B1.