Statistics
Used for:
- Calculating basic statistics for numeric fields
- View auto-banded frequency distribution for numeric fields
- Create new Bandings for numeric fields
Quick Start:
- Select a Numeric Field in the Database Tree and drop onto the Statistics report
- Drag a Field value or a DataSet from the Database tree or DataSet HotBar and drop into the Filter Box
- Click Band to create a new field that puts records into groups of equally spaced values
- Right-click a field in the Database Tree and choose Statistics
Functional Overview:
- View basic statistics for a numeric field by dropping the field onto the report
- Calculate statistics for a subset of records by dropping a dataset or field value into the Filter Box
- Use Selection Range to create a DataSet from a manually specified minimum and maximum
- Create a new banded field, by clicking Band and accessing the Banded Field Dialog
- Export Statistics to excel by clicking Export To Excel
Quick reference:
| Statistic | Example Value | Description |
|---|---|---|
| unique | 941 | The number of unique values in the field |
| count | 1,680,736 | The number of records in DataSet |
| nulls | 0 | The number of records in the DataSet with null data |
| min | 16,000.00 | The minimum value in the Dataset |
| max | 110,000.00 | The maximum value in the Dataset |
| range | 94,000.00 | Max – Min |
| avg | 66,294.86 | Sum of Values / Count of Values |
| sum | 111,424,157,800.00 | Sum of values for all records in Dataset |
| median | 70,900.00 | Middle value of the Dataset |
| trimean | 68,325.00 | (Q1 + Q2 + Q3) / 3 |
| midhinge | 65,750.00 | (Q1 + Q3) / 2 |
| iqmean | 68,713.36 | (Sum of Values from Q1 to Q3) / (Count of Values from Q1 to Q3) |
| q1 | 44,200.00 | Middle value of first half of Dataset |
| q3 | 87,300.00 | Middle value of second half of Dataset |
| iqrange | 43,100.00 | IQR = Q3 – Q1 |
| stdev | 25,762.33 | Square root of variance Square Root of [(Sum of square of differences from mean) / (number of data points -1) ] |
Quartiles
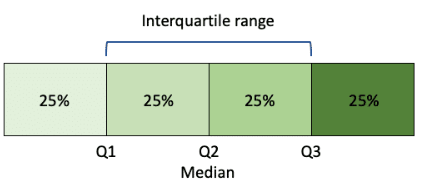
Where:
- Q1 = First Quartile
- Q2 = Second Quartile
- Q3 = Third Quartile
The exclusive method is used to calculate the Interquartile range
Standard Deviation
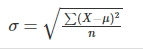
Where:
- σ = population standard deviation
- X = data point
- µ = population mean
- n = population count
Selecting a field
The following Statistics are available for different data types:
| Statistic | Double, Integer | Date | DateTime | String |
|---|---|---|---|---|
| unique | YES | YES | NO | YES |
| count | YES | YES | YES | YES |
| nulls | YES | YES | YES | YES |
| min | YES | YES | YES | NO |
| max | YES | YES | YES | NO |
| range | YES | NO | NO | NO |
| avg | YES | YES | YES | NO |
| sum | YES | NO | NO | NO |
| median | YES | YES | NO | NO |
| trimean | YES | NO | NO | NO |
| midhinge | YES | NO | NO | NO |
| iqmean | YES | NO | NO | NO |
| q1 | YES | NO | NO | NO |
| q3 | YES | NO | NO | NO |
| iqrange | YES | NO | NO | NO |
| stdev | YES | NO | NO | NO |
Filter
Dropping a dataset into the Filter Box will recalculate the report using the records in the dataset as the new population.
The Dataset filter must come from a table that has a relationship to the Active field, or the message “Cannot make universe or resolve query” will be displayed along with a blank statistics report.
Selection Range
The Box-Whisker plot – if available for the selected field type – is interactive. Hovering over the chart will put min and max values into the Selection Range Box.
Mouse down sets the Min value. Mouse Up sets the Max value. Once Min and Max have been set, the DataSet Drag Icon can be used to obtain a copy of the records within the specified range.
Apply this DataSet as a filter to effectively “zoom in” on a range of values.
Band
Clicking the Band Button will display a dialog asking how many bands are required for the new field. Choose a value between 4 and 128. The Banded Field dialog will be displayed.
For Banded Fields for details on how to set up a new banding.
Exporting Data
Data can be exported from the Statistics report in the following ways:
• Use Export To Excel function
• Use CTRL + A and CTRL + C to select the contents of the grid and copy to the clipboard