Overview
Calculates the basic statistics for numeric fields

A more limited number of stats for date or datetime fields
To Open:
- Right-click context menu in database tree or list
- From the pop up menu when dropping a field onto the main tab bar
- Via the main menu
Once opened, the current field can be replaced by dropping a different field onto the main stats grid.
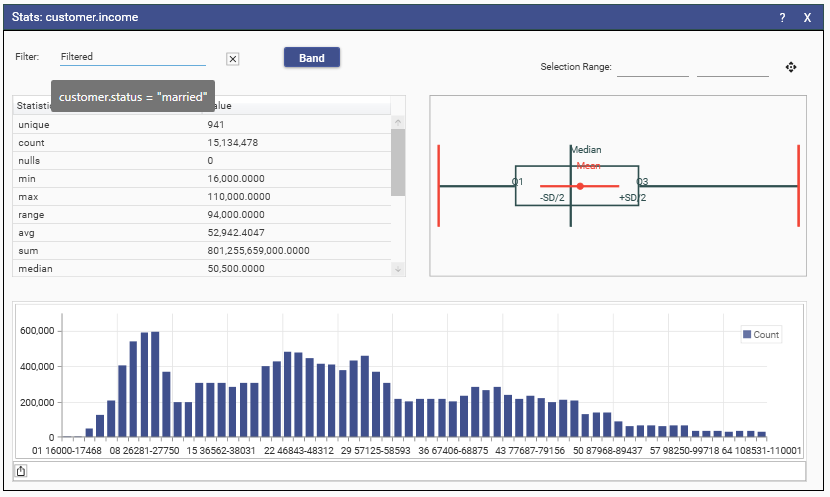
The display shows:
- A basic statistical summary of the field.
- A (potentially banded) profile of the field
- A box whisker-like visual representation of the statistics
By default, the stats are for all records in the chosen field
Use the filter box to calculate stats for a specific subset of records.
Hold the mouse down and draw left-right on the box-whisker graphic to select an upper and lower
range of values that form a dataset source via the drag icon.
A shortcut to numeric band creation using the chosen field and dataset is available through the Band button
Tip:
Use the box whisker selection/drag source to 'zoom' into a region of the data
The content of the grid can be selected with ctrl-A ctrl-C for pasting into another app