Instead of using Discrete Statistics to create the report, use the Set As Measure and Category option in the Multi Field Statistics report.
Consider the following table: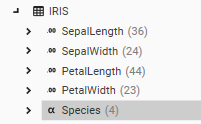 It has 2 fields:
- PetalWidth
- Species
An instant box plot of PetalWidth by Species can be created by dragging and dropping PetalWidth on top of Species. This will bring up the context menu, from which Discrete Statistics can be selected. A Multi-Field Statistics Chart will open up, with a row entry created for each value in Species.
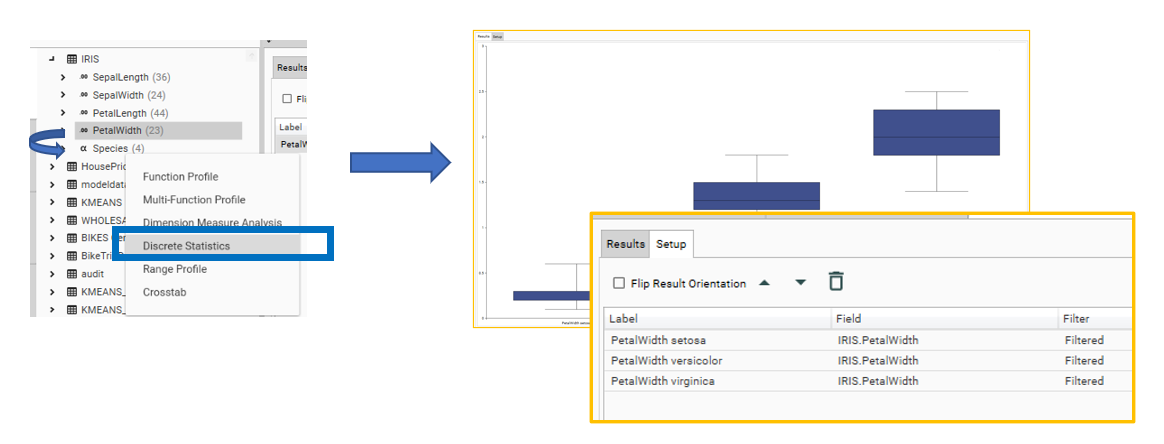
However, this report cannot be recreated in script if the number of values or value names in Species or PetalWidth could change.
To create a report that will dynamically respond to changing data in the source fields, use the following method:
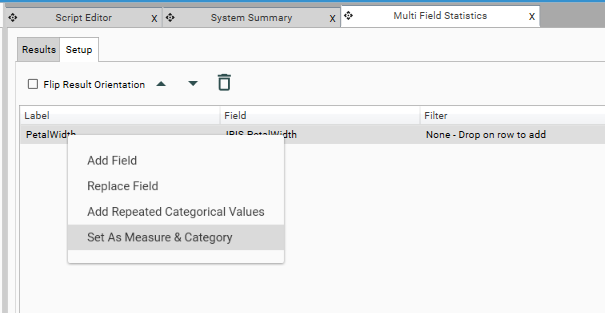
- Open the Multi Field Statistics report
- Drop PetalWidth onto the setup grid and choose Add Field
- In the setup grid, drop Species on top of PetalWidth, and choose Set as Measure and Category.
- Click the green Run arrow
- The existing rows will disappear from the setup grid, but a result grid and chart will be created.
This report can now be added to script, and will dynamically recreate for the contents of the two fields that have been analysed.
"measure": "IRIS.PetalWidth",
"categoryField": "IRIS.Species",
"flip": false