Profile
Used for:
- Summarizing
- Visualizing
- Counting, Frequency, Grouping, Aggregating, Cross-tabulating
Quick Start:
- Drag a Field from Database Tree and drop into Dimension box
- Drop a Dataset onto the grid to use a subset of records
- Add more Dimensions by dragging and dropping more fields
- Change what is calculated by dragging a measurable field into the Measures box
- Use IconBar to control graphs, views, sort order etc
- Click cells, segments, bars and columns to select data and drag to DataSet HotBar
Functional Overview:
- Produce a profile of a discrete field (a count of the number of records for each discrete value in that field).
- Display results as count or percentage of total
- Drop a dataset onto the grid or graph to profile the field for that subset or records
- Display results as a grid, graph or split view, selectable via the lower icon bar left 3 buttons.
- Multiple graph types, selectable by the lower icon bar right hand side graph selection combo
- Sort the results by label or value, selectable via icon bar sort combo or via settings icon
- Use the heat-map icon to colorize the grid background to reflect the relative values in the cells.
- Count at the number of records from another suitably joined table by selecting that table from the Resolve at combo box.
- Export Result grids into tables, excel or file
See Profile - Introduction for a full functional overview of the Profile report
Function Profile
Drop a field into the Measure box to calculate stats for that field, by each unique value in the dimension.
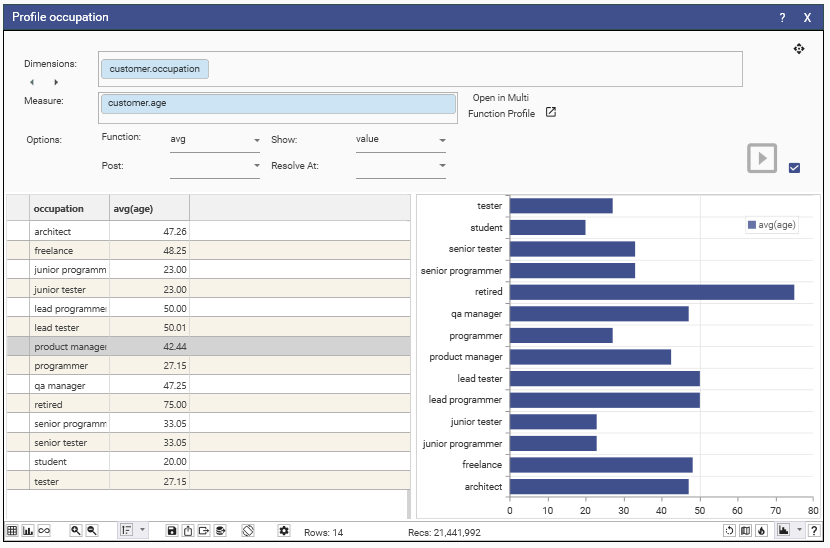
Available Functions are:
- Count
- Sum
- Min
- Max
- Average
- Standard Deviation
When Count is selected, the result is the number of non-null records for that measure.
There are a number of Post Functions available.These function will be applied to the results of the profile before it is displayed. See the section on Profile Post Functions for more details
If analysis of multiple measures is required, use Multi Function Profile
Multiple Dimensions
One of more fields can be dropped into the dimension box to produce a multi-dimensional profile
A multi-dimensional profile contains the counts for each combination of unique values in the table or dataset.
The position of the fields in the dimension box, and therefore the result grid, can be changed via the left and right arrow icons.
Right-click on a field in the dimension box to remove it from the profile
One of the field in a multi-dimensional profile can be pivoted across the x-axis, right click a field in the dimension box and select pivot.
Named Datasets
Dropping a Dataset Collection onto the grid will add a combo box to the form. This will contain each entry in the collection and allows the user to filter the profile by each of the named values in the collection
Persistence and Export
Click the Save button to save a report, enter a name, description and any tags required.
Once saved, the report will appear in the Report Tab of Solution Explorer.Once saved the profile will appear with the given name in the solution explorer report tab.
Drag a profile from the report tab tree or list onto a the Script Editor to add its creation to a script.
Drag an open profile from the Main Tab Bar to script editor to add the execution and output of that profile to a script.
To Excel
Click the lower icon bar Export To Excel button to save the profile as an Excel file. Once saved, Explorer will prompt to view the file in Excel.
By default, the profile result grid data will be exported at Sheet1 Cell A1.
The profile can have an Excel template assigned (and persisted with its definition).
- Right click on the grid, select Template->Set Row Offset and set a suitable offset at which Explorer will start the profile data in Excel
- Export the profile
- Edit the exported file in Excel and format the grid / add graphs as required; then save.
- Save this file and the profiles template from right-click Template->Set
- Save or (re-save) the profile to add the persist this template definition
To File
Hit the export to File button to save the result grid from a profile on the server
Tip: hold down Ctrl when pressing the File button export you tour local machine.
To Table
Hit the export to Table button to dump the content of the result grid into a new project table.
Enter the table name when prompted. Each column in the grid will be a field in the new table.
Profile Options
Right click on the grid and select Options, or click on the Options icon in the lower icon bar
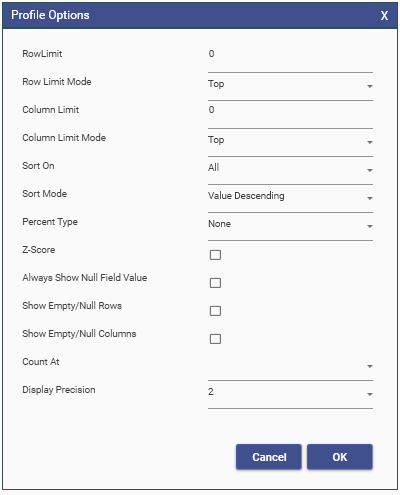
RowLimit | The maximum number of rows that will be displayed in the profile. Zero (0) indicates all rows should be displayed |
Row Limit Mode | Determines if the RowLimit is applied to the first (Top) or last (Bottom) 'n' rows of the profile |
ColumnLimit | The maximum number of columns that will be displayed in a profile that has a pivot field. Zero (0) indicates all columns should be displayed |
Column Limit Mode | Determines if the ColumnLimit is applied to the first (Top) or last (Bottom) 'n' columns of the profile |
Results
Choose to display as a Grid , Chart or Split view
In Split view, the Orientation of the grid and chart can be changed.
The grid's rows/column orientation can be Flipped if visible and of the correct form.
Set the Chart Type as appropriate for the data
And any additional Chart Options
Grid displays can also be optionally colored as HeatMap
Sorting
The grid, and therefore the graph, can be sorted by
- Selecting from the Sort Combo
- Clicking on grid headers
- Settings in the Option dialog