Introduction
This article provides a quick overview of Profile functionality. For a detailed reference of all Profile functionality, view the Profile - Functional Overview section.
Overview
At its simplest, a profile contains a count of records for each unique value of a discrete field.
They can be extended to include multiple dimensions, with pivoting for crosstabulations. Through joins they can resolve counts at other table levels and they can count only the unique values of a discrete fields. A measure and function can be applied instead of counts and post functions perform various calculations on the initial cell values. All of these operations can be applied with or without a filter.
Profiles can be exported to files and workbooks; or form the source of a new table.
They are one of the components used to construct Dashboards and other Report.
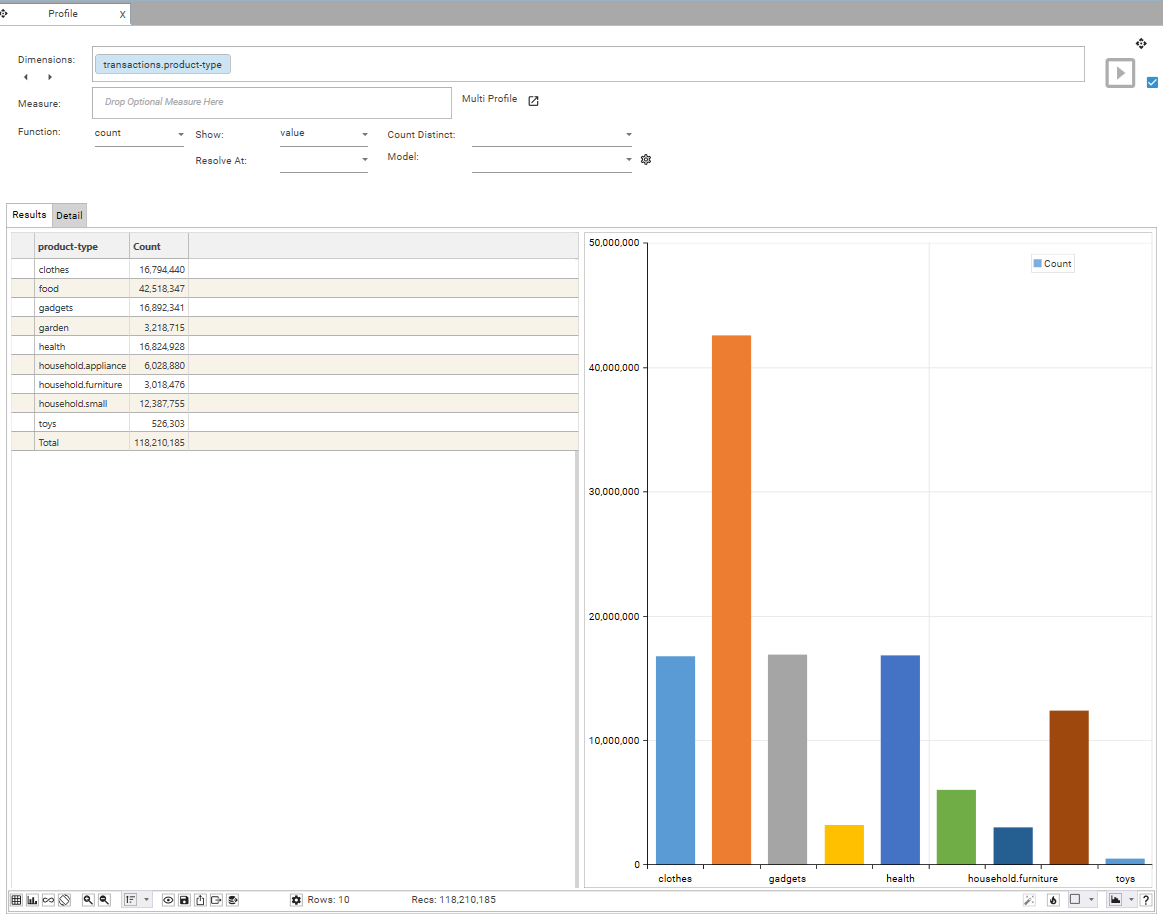
Simple Profile
Produce a profile of a field, a count of the number of records for each discrete value in that field.
Display results as count or percentage of total
Drop a dataset onto the grid or graph to profile the field for that subset or records
Display results as a grid, graph or split view, selectable via the lower icon bar left 3 buttons.
Multiple graph types, selectable by the lower icon bar right hand side graph selection combo
Sort the results by label or value, selectable via icon bar sort combo or via settings icon
Use the heat-map icon to colorize the grid background to reflect the relative values in the cells.
Count at the number of records from another suitably joined table by selecting that table from the Resolve at combo box.
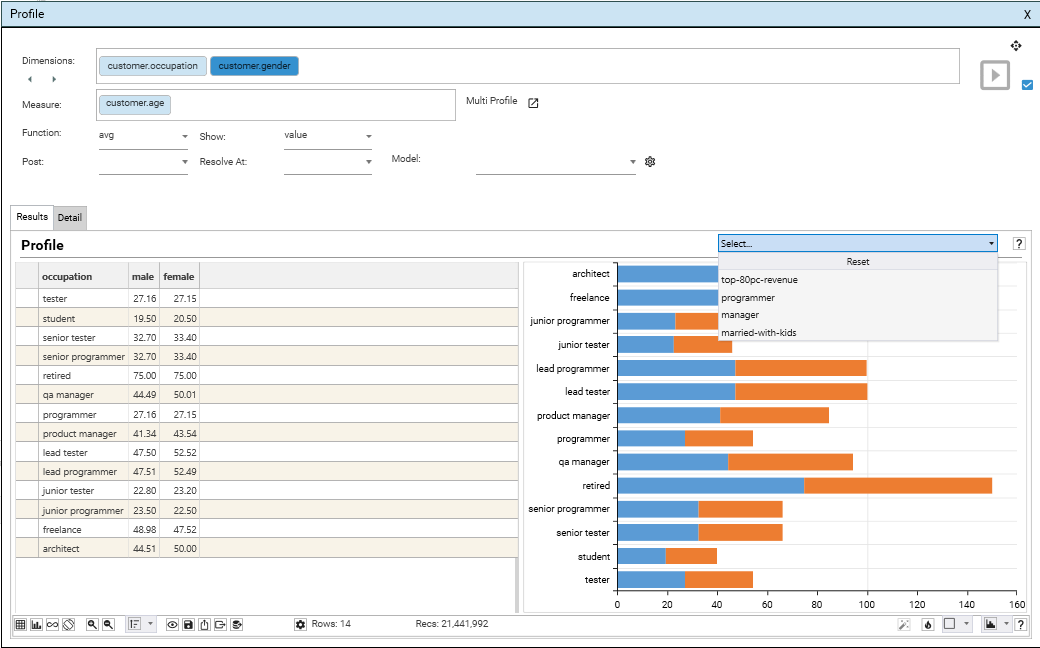
Function Profile
Drop a field into the measure box to calculate stats for that field, by each unique value in the dimension.
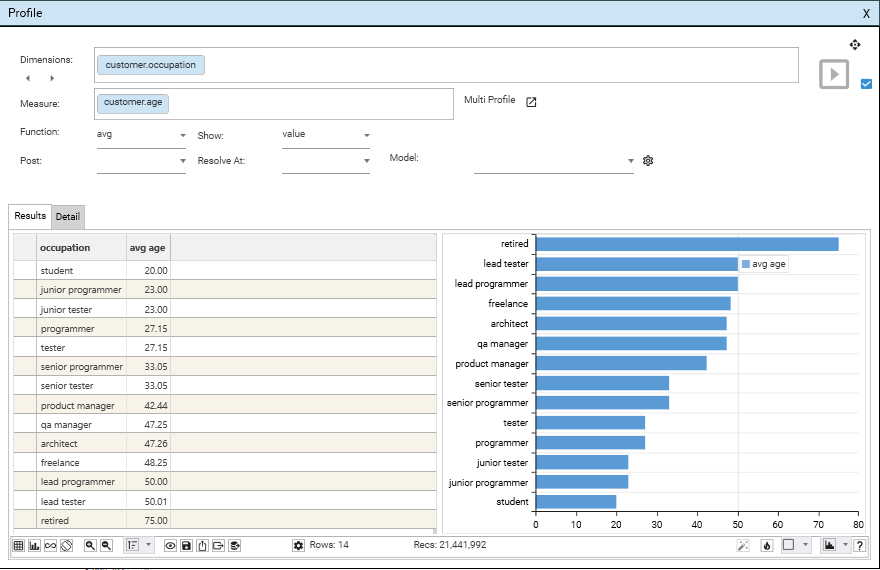
Available functions are:
- Count
- Sum
- Min
- Max
- Average
- Standard Deviation
When Count is selected, the result is the number of non-null records for that measure.
There are a number of post-functions, available from the Post combo box. These function will be applied the the results of the profile before it is displayed. See the section on Profile Post Functions for more details
If analysis of multiple measures is required, use Multi Function Profile
Multiple Dimensions
One of more fields can be dropped into the dimension box to produce a multi-dimensional profile
A multi-dimensional profile contains the counts for each combination of unique values in the table or dataset.
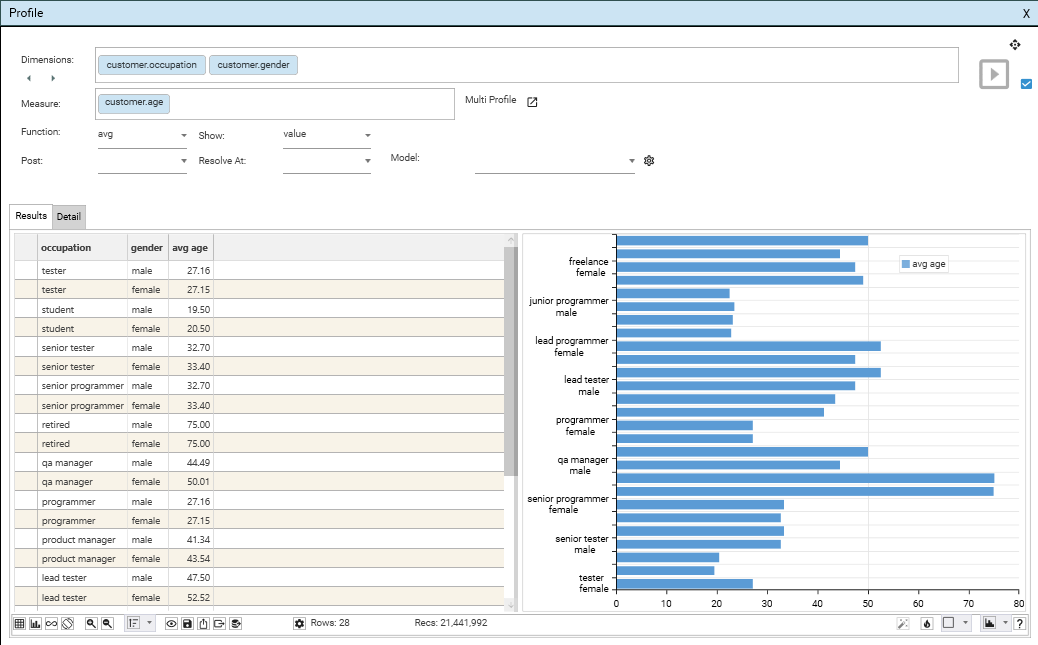
The position of the fields in the dimension box, and therefore the result grid, can be changed via the left and right arrow icons.
Right-click on a field in the dimension box to remove it from the profile
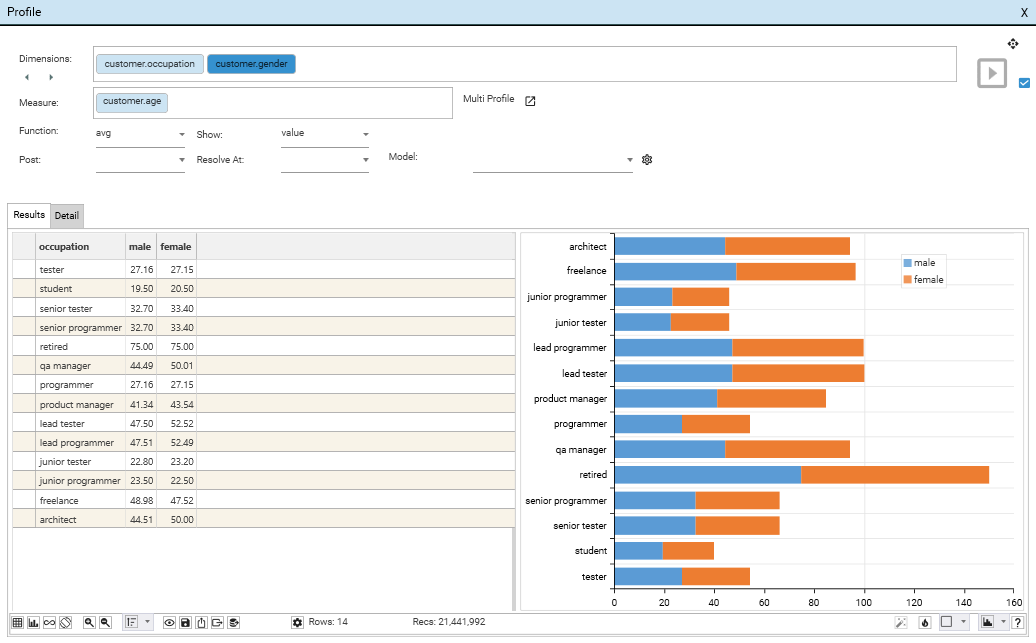
One of the field in a multi-dimensional profile can be pivoted across the x-axis, right click a field in the dimension box and select pivot.
Named Datasets
Dropping a Dataset Collection onto the grid will add a combo box to the form. This will contain each entry in the collection and allows the user to filter the profile by each of the named values in the collection
Persistence and Export
The profile can be saved, along with all its configuration and any applied dataset, by clicking on the lower icon bar save button.
Once saved the profile will appear with the given name in the solution explorer report tab.
Drag a profile from the report tab tree or list onto a the Script Editor to add its creation to a script.
Drag an open profile from the Main Tab Bar to script editor to add the execution and output of that profile to a script.
To Excel
Click the lower icon bar Export To Excel button to save the profile as an Excel file. Once saved, Explorer will prompt to view the file in Excel.
By default, the profile result grid data will be exported at Sheet1 Cell A1.
The profile can have an Excel template assigned (and persisted with its definition).
- Right click on the grid, select Template->Set Row Offset and set a suitable offset at which Explorer will start the profile data in Excel
- Export the profile
- Edit the exported file in Excel and format the grid / add graphs as required; then save.
- Save this file and the profiles template from right-click Template->Set
- Save or (re-save) the profile to add the persist this template definition
Profile Options
Right click on the grid and select Options, or click on the Options icon in the lower icon bar
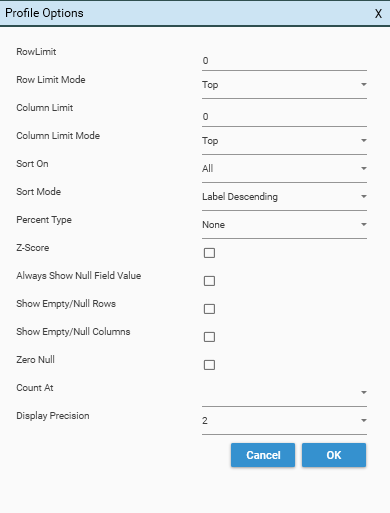
RowLimit | The maximum number of rows that will be displayed in the profile Zero (0) indicates all rows should be displayed |
Row Limit Mode | Determines if the RowLimit is applied to the first (Top) or last (Bottom) 'n' rows of the profile |
ColumnLimit | The maximum number of columns that will be displayed in a profile that has a pivot field Zero (0) indicates all columns should be displayed |
Column Limit Mode | Determines if the ColumnLimit is applied to the first (Top) or last (Bottom) 'n' columns of the profile |
selecting
add a post function
shows count of rows and underlying dataset
more than one dimension
pivot a dimension
pivot multiple dimension (when count)
resolve counts at other tables
select from grid and/or graphs to extract dataset (shift for top)
export to excel format
assign an excel template
export as raw file
export to new datajet table
drop into script for server execution workflow
options
row and column limits
display precision
show empty rows and/or null values