Overview
Calculates and visualizes inclusion and exclusion counts and metrics across all combinations of user supplied dataSets simultaneously
Overlap Analysis visualises intersections and overlaps among multiple datasets. Standard visualization techniques like Venn diagrams become impractical and visually complex when comparing more than three or four sets. Overlap Analysis addresses this limitation through a structured report suitable for analysing up to 19 datasets, identifying the unique and shared elements across those datasets.
Purpose and Use Cases
The primary purpose of the Overlap Analysis feature is to understand the relationships and shared memberships between multiple distinct groups or categories within a larger universe of data. Common use cases include:
- Customer Analytics: Identifying customer groups that belong to multiple segments (e.g., frequent shoppers, loyalty program members, clicked specific ads).
- Market Research: Analysing survey respondent segments based on multiple demographic or behavioural criteria.
- Data Quality: Identifying records present in multiple databases or data feeds.
Key Concepts
- Dataset (or Set): The result of a "select" query. See Datasets and Collections
- Overlap (or Intersection): The subset of items that are members of two or more datasets simultaneously.
- Combination Set: A specific grouping of datasets being considered for an intersection. For N datasets, there are 2^N - 1 possible non-empty combination sets.
- Exclusive Intersection Count: The number of items that belong only to the specified datasets within a combination set and not to any other datasets included in the analysis. This is the primary count displayed per combination row.
- Hits (Degree of Overlap): The number of datasets an item belongs to, or the number of datasets involved in a specific intersection combination.
- Set Size Count: The total number of records in each input dataset.
- Resolution Table: The table providing the records which are being counted.
Input Requirements and Model Configuration
- Dataset List: Drag and drop datasets or dataset collections from the dataset HotBar or Project Explorer into the Dataset panel
- Up to 19 datasets can be added
- All datasets must come from the same table, or all be linked to the same Resolution Table (see Resolve At).
- Note: If no resolution table is specified, and datasets come from different tables, the resolution table will be that of the FIRST dataset in the list
- Dataset names cannot be longer than 64 characters - rename the dataset as it is dropped onto the panel - shorter names are better for display purposes
- Tip: To drop the records NOT in the dataset, hold the SHIFT key when dropping the dataset
- Tip: To quickly select all datasets from a dataset collection, click the "..." icon and choose "select all"
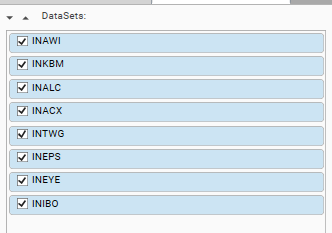
- Dataset Selection: Select the datasets to include in the analysis from the available datasets in the Dataset Listbox by checking and unchecking individual datasets .
- Configuration Options:
- Resolve At: Determines the table at which intersection counts are calculated. All datasets is the Dataset List must be linked to this table.
- Filter: To reduce the set of records included in the analysis, drop the dataset of required records onto the result grid. The filter details are visible in the context pane of the Info Panel (open the info panel by selecting the info panel icon)

- Execution: An execution button (the 'play' icon) initiates the analysis based on selected datasets and configurations. Turn off auto-calculate if working on large datasets and calculate the report once the configuration is complete.

Processing Logic
Upon execution, Overlap Analysis performs the following steps:
- Identify Universe: Determines the set of all unique items present across all selected input datasets, (optionally resolved at a specific table level)
- Generate Combinations: Systematically generates all valid combination sets involving the selected datasets.
- Calculate Intersection Counts: For each possible combination set, calculates the exclusive intersection count – the number of unique items that are members of all datasets within that specific combination, but not members of any other selected datasets. It also determines the number of 'Hits' (degree) for each combination.
- Aggregate Results: Compiles the detailed intersection counts and aggregates counts based on the number of 'Hits' for reporting.
Output Components
The following outputs are generated:
- Thematic Grid - A detailed table listing intersection combinations and counts
- Aggregated Hits Count Table - A summary table that shows how many items are unique to 1,2,3...N datasets
- Aggregated Hits Count Plot - A visual summary of the hit counts table
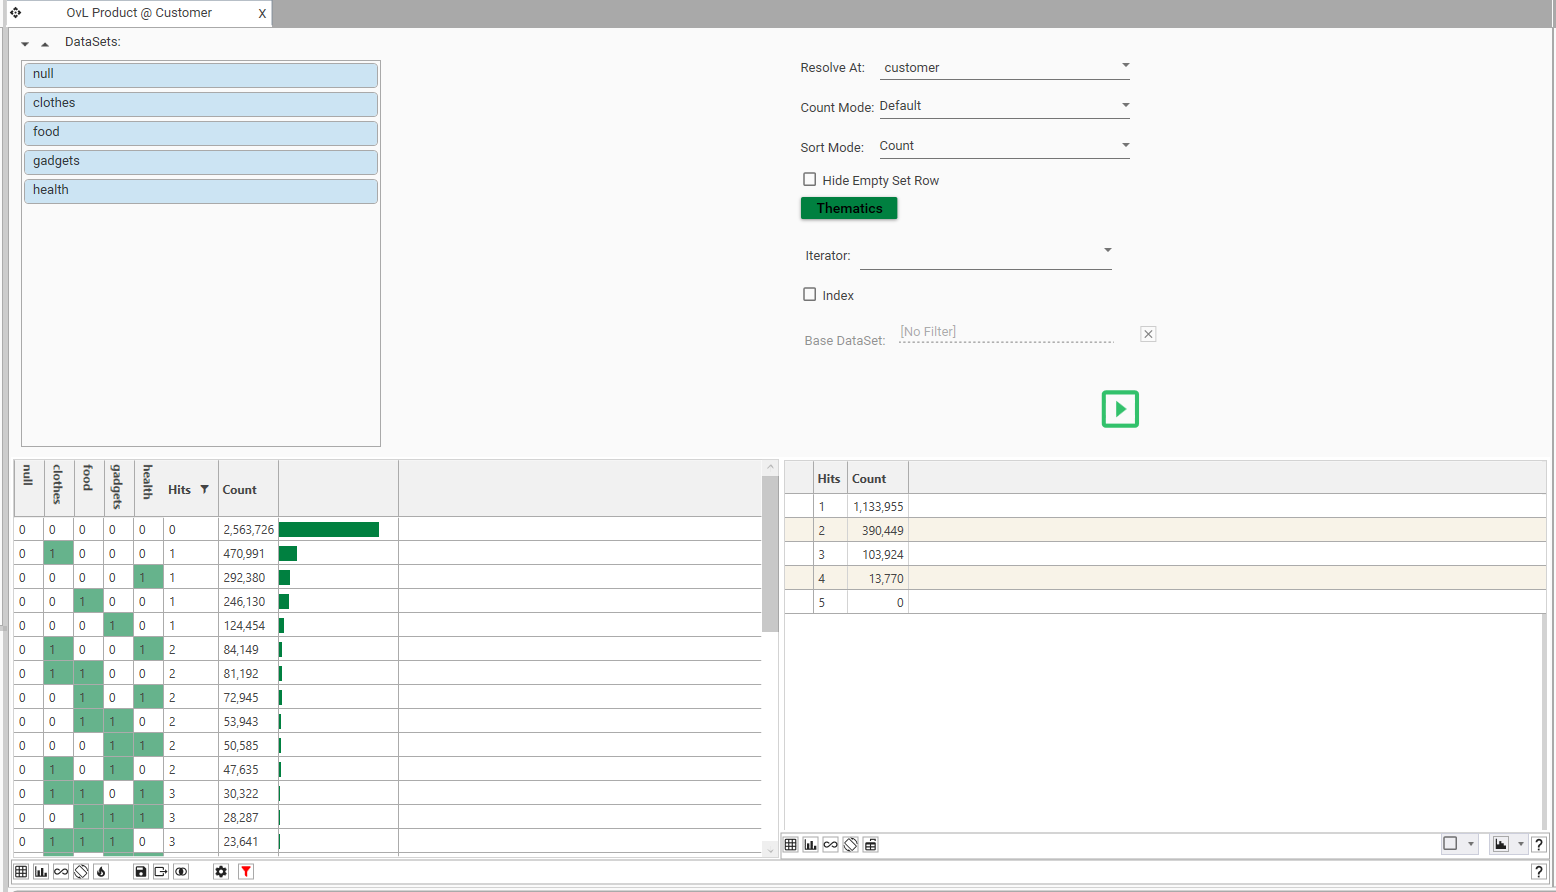
Thematic Grid (Combination Matrix Detail)
A detailed table listing the calculated exclusive intersection combinations. This table provides the most granular view, visualising the exact composition and size of every unique membership pattern found across the selected datasets.
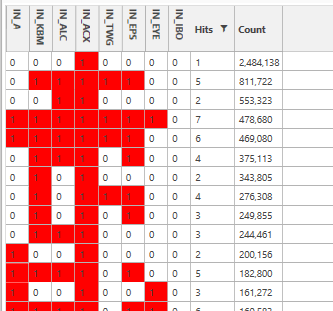
- Dataset Columns(e.g., IN_AWI, IN_KBM...): Columns representing each selected input dataset. Cells contain 1 if the dataset is included in the specific intersection for that row, and 0 if it is not.
Turn on thematic highlighting using the heat map icon
- Hits Column: Displays the number of datasets included in the intersection for that specific row (the degree of overlap).
- Count Column: Displays the result of the aggregation function (e.g., the number of unique items) belonging exclusively to that specific intersection combination.
Available Actions
- Sorting: The table is typically sorted by the "Count" column in descending order by default, showing the largest intersection combinations first. Sort also by Hit Count.
- Selection: Select underlying records from row(s) by selecting the cell and dragging to the Hotbar.
- Display: Change display options to alter chart placement. See Profile - Micro Toolbar for details of display options.
Aggregated Hits Count Table
A summary table that aggregates the counts based on the number of 'Hits'. Provides a high-level summary of the overall overlap distribution – how many items are unique to single datasets, how many are shared between exactly two, exactly three, etc.
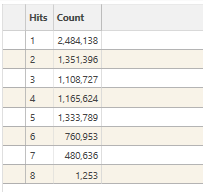
- Hits Column: Lists the number of datasets (from 1 up to the maximum number selected).
- Count Column: Shows the total count of items (or sum of measures) that belong to exactly that many datasets. For example, the row with "Hits" = 1 shows the total count of items found in only one dataset (across all datasets). The row with "Hits" = 2 shows the total count of items found in exactly two datasets (across all possible pairs), and so on.
Aggregated Hits Count Plot
A bar chart visualizing the data presented in the "Aggregated Hits Count Table". Offers a quick visual summary of the overlap distribution shown in the adjacent table. Helps identify if items are predominantly unique (high bar at Hits=1) or highly overlapping (significant bars at higher Hits values).
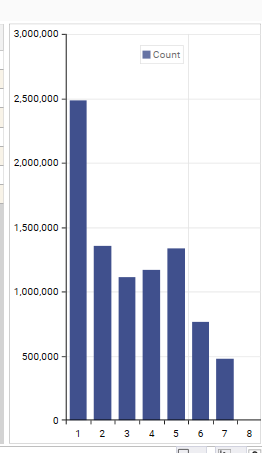
- X-axis: Represents the number of 'Hits' (number of datasets an item belongs to).
- Y-axis: Represents the total "Count" corresponding to each 'Hits' number.
- Legend: Indicates the measure being plotted (e.g., "Count").
Data Model
To generate a stored DataModel from the Overlap report use the Export...Save Model option from the Export menu
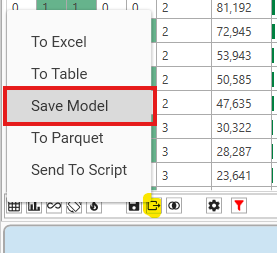
Export Options
Export Thematic grid to:
- To Excel - Creates an excel workbook
- To Table - Creates a Datajet Table
- Save Model - Saves model to Reporting | Data Table Viewer (Note, the model will not be hot)
- To Parquet - Saves model in parquet file format
- Send to Script - adds the current configuration to a new method in the open script in script editor
Limitations and Considerations
- Dataset Limit: Strictly limited to analysing a maximum of 19 datasets per run.
- Computational Complexity: Analysing many datasets, especially with large item counts, can be computationally intensive.
- Identifier Matching: Analysis accuracy depends on consistent identifiers across datasets.
- Configuration Impact: The choice of "Resolve At" can significantly alter the results and interpretation. Understanding this setting is crucial.
- Dataset Relationship: All datasets must be directly linked to the resolution table. This is either the owner of the first dataset in the list, or the specific resolution table, if set.