Dimension
The dimension determines the category being used to group data. For example, Months, Sales regions, Cities, Products, Ages, Sizes, Colors…
.PNG)
A dimension is usually a database field – it can be thought of as a column of data in a spreadsheet.
Any discrete field can be added to a profile as a dimension.
A dimension can be thought of as a rows field in an excel pivot table.
Multiple dimension fields can be added - all fields must come from the same table.
Discrete or Continuous
A discrete field is a field that has a limited number of unique values, as opposed to continuous. DateTime fields are always continuous fields, and key fields are often continuous fields.
Adding a continuous field as a dimension to a profile will generate a warning message saying that it cannot be calculated.
For example, the field Months is a discrete field with 12 discrete values.
The field Countries is a discrete field with up to 195 discrete values.
The field Session_Start_Time is a continuous DateTime field with an unspecified number of values.
Single and Multi Dimensions
Multi-Function profiles can be single or multi-dimensioned, but cannot be pivoted to create Crosstabs. This is because the Column data for a Multi-Function Profile is controlled via the report measures.
A single-dimension multi-function profile has 1 dimension and simply summarizes the applied measures by the specified grouping:
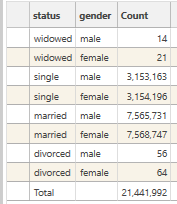
.PNG)
A multi-dimensioned multi-function profile has more than 1 dimension and splits out the results for the first dimension by the second and so on:
Dimensions are analogous to the Rows Fields of an excel pivot table.
Order and Sorting of Dimensions
The order in which the dimensions are calculated will affect both display and results. Dimension order can be changed by moving dimensions left and right. Sort order will also affect the display and potentially the results depending on other settings - this can be controlled by clicking on the result grid, or by using the sort options in the micro-toolbar.