Measures
A measure refers to what is being calculated and is analogous to the value option in an excel pivot table. The Multi-Function profile report allows multiple measures or calculations to be executed within the same report.
Each measure that is added to the Multi-Function Profile report has parameters that can be individually configured.
Selecting a measure
To configure the parameters for a measure, first select a suitable field by one of the following methods:
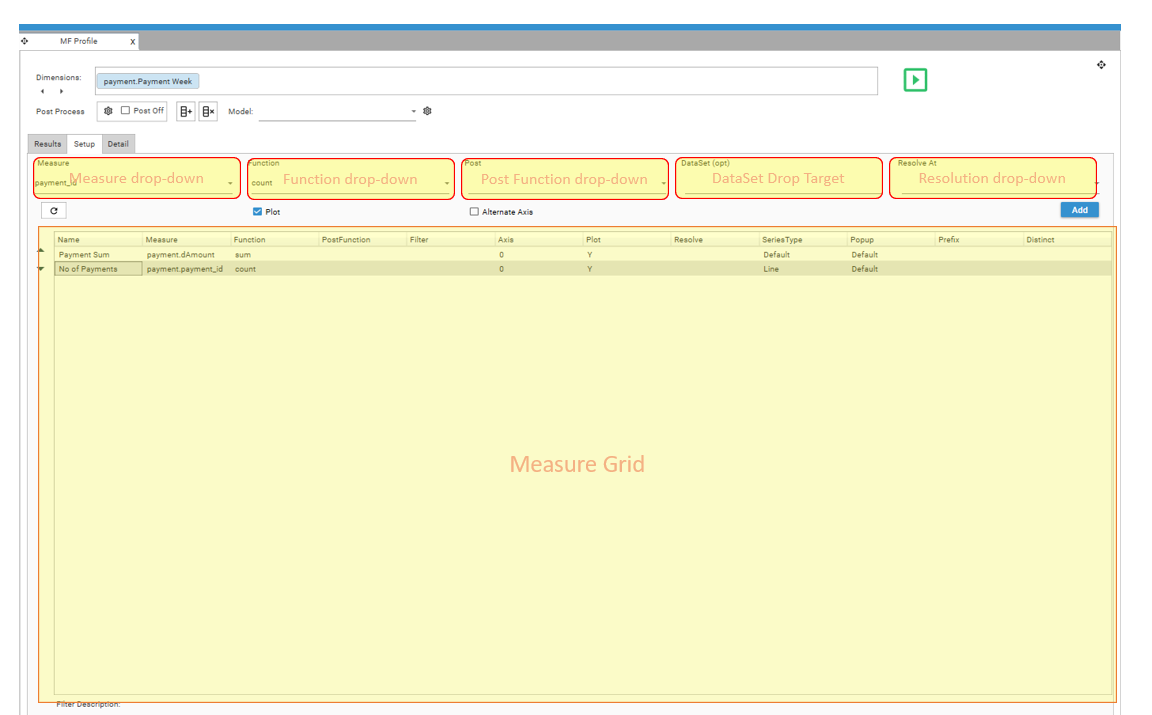
- Drag field from Database tree and drop onto the Measure drop-down
- Drag field from Database tree and drop onto Measure Grid
- Select field from Measure drop-down
Parameters
Name
The Name to be displayed as the Column Header in the result grid for the measure. Dropping a field directly onto the Measure Grid will display the function menu. The measure name will then be automatically populated with the format {FUNCTION FIELDNAME}
Measure
The field to be used in calculating the result column.
In general, numeric fields should be added as measures – this is because various mathematical functions can be applied to measures - for example, Sum, Min, Max, Avg, StDev. A measure can be discrete or continuous (i.e., there is no limit on the number of discrete values in the field).
Adding a field of a non-numeric data-type will mean that there are some limitations on the calculations that can be performed. Non-numeric measure fields are not supported when calculating crosstabs, and only the COUNT function is supported for single and multi-dimensional profiles.
Date and DateTime fields are treated as numeric fields when added as measures.
For more information on measures, see Profile - Measure
Function
The function determines the type of calculation that is performed.
By default, the function is COUNT, which means what is counted are either the non-null records in the table (when there is no measure) or the number of non-null records for the provided measure.
Other statistical functions can be applied to numeric dimensions or measures:
| Count | Returns the count of the set of records |
| Sum | Sums the measures for the set of records |
| Min | Returns the minimum measure value for the set of records |
| Max | Returns the maximum measure value for the set of records |
| Avg | Returns the measure sum/count for the set of records |
| StDev | Returns the dispersion of data relative to the Avg for the set of records |
Post-Function
Post Functions allow inter-row calculations to be carried out on the rows returned from a raw multi-function profile result set, including calculating cumulative totals, deltas etc.
Use Post Functions to;
- format data
- plot cumulative graphs
- calculate logarithms
- calculate multi-row averages
- calculate figures for Month-on-Month, Year-on-Year and Year-To-Date
- calculate deltas between rows
For more information on post-functions, see the detailed section on post-function calculations.
Dataset / Filter
Optional. Filter to apply when evaluating the measure. Only records in the Filter Recordset will be included in the measure calculations.
The DataSet must come from same table as DIMENSION/MEASURE or be linked to the Dimension table.
Axis
Use the Axis parameter to select which Y axis to use when plotting data and to control the relative scale used to plot the measure data
Default = 0
- 0 - measure will be plotted on left axis
- 1 - measure will be plotted on right axis
Plot
Y / N. Specifies whether measure’s output column should be plotted on the graph. Default = Y
Resolve
Optional.
Specifies the resolve level for the measure. If blank, Resolve = Dimension Table, which means records in the dimension table are being counted.
For further details on resolution levels, see Profile - Calculation Options
Series-Type
Default / Bar / Stacked Bar / Line / Spline / RangeLow / RangeHigh / CSLow / CSHigh / CSOpen / CSClose
Determines the graph style for the measure.
Popup
Default / None / Extended
Controls the popup window that is displayed when a charting segment is selected or passed over.
Prefix
$ / £ / E / %
Controls the prefix that is used in the popup window.
Distinct
Determines what is counted. If a field has been selected, the counts in cells will refer to the number of distinct values of the selected field.
For example, if sales.region was selected, the counts in a cell would refer to the number of distinct regions within the underlying cell segment.