DataJet allows data to be analysed from many different angles, quickly generating visual representations, segments, queries and derived data.
Analytics in DataJet
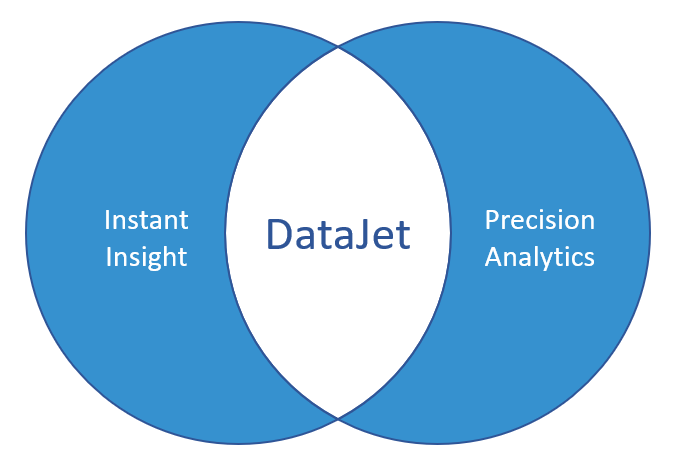
As soon as data is loaded, Instant Insights are available via basic analysis such as Profiles, querying and inspection. Precision Analytics - targeted and specific questions that may require some engineering or customisation - can be calculated using more advanced features such as multi-function profiles, post processing, post functions, modelling, user-defined fields, aggregates, keytables etc. Both Instant Insights and Precision Analytics can be scripted and automated
{instant insights video}
{precision analytics}
The following key features support the analysis of data:
- HotBar
- Drag and Drop Interface
- Data Profiling
- Field Analysis
- Auditing
- Reporting
- Dataset and Queries
- Engineering
- Modelling
HotBar
The HotBar is an integral part of the desktop application. It is an interactive area, always available for managing Datasets and doing quick calculations. It gives access to frequently used Dataset functions and also serves as a temporary repository for records and segments of interest.
Datasets placed in the HotBar will remain accessible throughout the duration of the active session.
More information on the Dataset Hotbar (including information on how to use it's logic operators and intrinsic functions) see DataSet HotBar - Functional Overview
Drag and Drop Interface
The 'drag and drop' interface allows querying and manipulation of data without the need to write code or SQL. Objects are selected in the project explorer and can then be dropped into other areas of the application.
For a quick overview of using drag and drop with a profile report, take a look at Creating simple profiles and Tab navigation. Or for a more in depth overview, see Profile - Drag and Drop.
See Shortcuts for examples of how the DataJet drag and drop paradigm works in practice.
Data Profiling
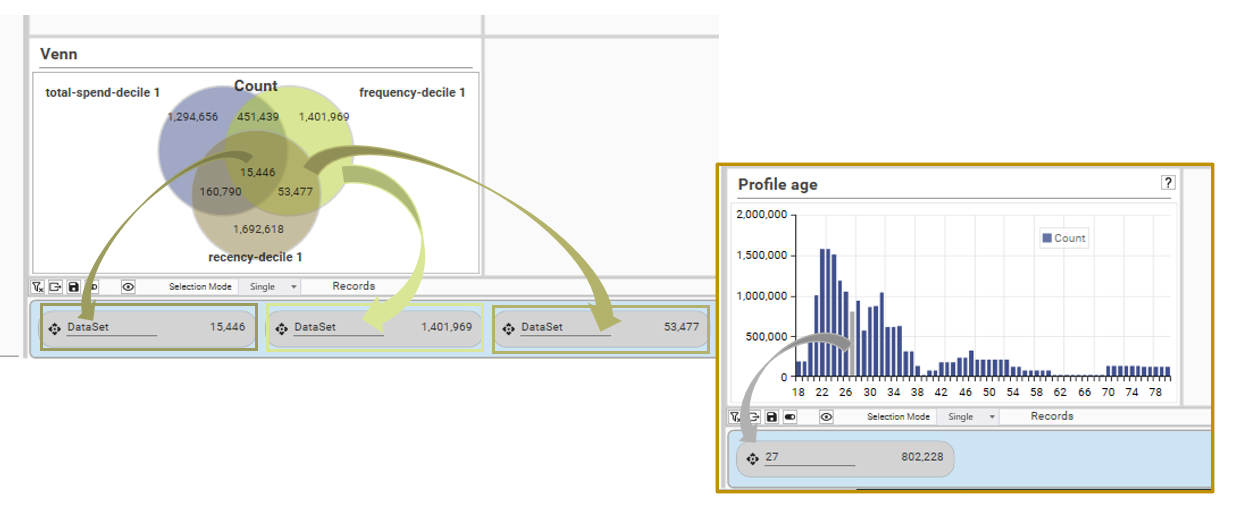
Data profiling is the systematic process of determining and recording the characteristics of data sets and is a key part of the DataJet paradigm. Discrete data can be quickly and easily profiled, regardless of the number of records in the underlying table.
Profiles allow for the creation of interactive charts and result sets, and are a key tool when engaging in data-discovery or exploration. A profile can be thought of as a tabular or visual representation of grouped data:
.png)
Various types of profiles are available, such as:
For an overview on the different types of data profiling, see, Profiles.
Field Analysis
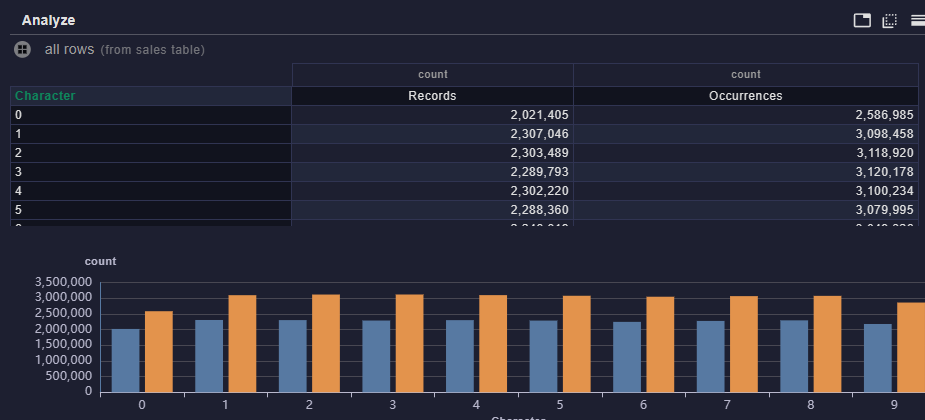
Field Analysis allows for individual character analysis of a field. The following field analyzer functions are available:
| CharDiscrete | Counts how many times a character appears in the list of discrete values |
| CharRecords | Counts the number of records that contain a character |
| CharOccurrences | Counts the total number of occurrences of the character in the field |
| CharSummary | Calculates CharRecords and CharOccurrences and displays in same grid |
| SLenDiscrete | Calculates the number of field values that have a particular length |
| SLenRecords | Calculates the number of records that have a particular length |
| WordsDiscrete | Counts the number of field values that have a particular word length |
| WordsRecords | Counts the number of records that have a particular word length |
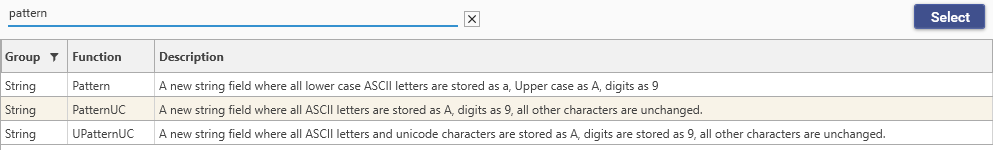
Field Analysis is often combined with Pattern Matching functions:
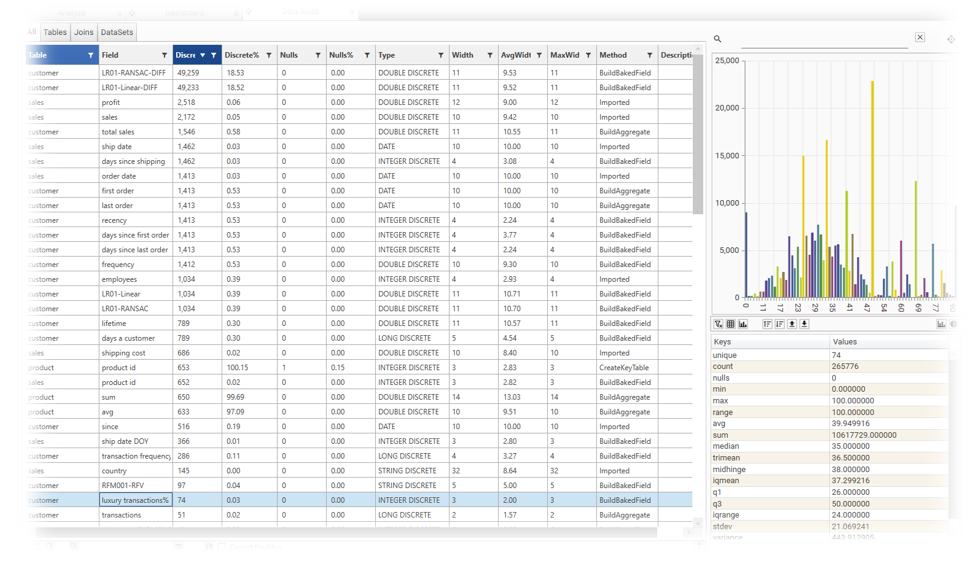
Auditing
The Data Audit Report provides a detailed overview of project data, and is accessed from the Analytics | Data Audit menu. It summarizes information about tables and fields, including data types, unique values, null data, and more. Users can filter, sort, and inspect data, create custom inspection dashboards, and export to Excel. Data Audit tables can be incorporated into scripts using the Script Editor. To find out how to use data auditing see the Data Audit page.
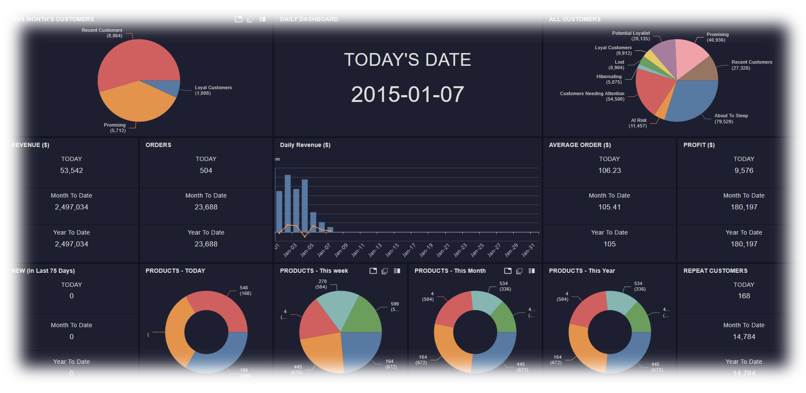
Reporting
DataJet allows reports and dashboards to be created and shared amongst users of the Desktop application, as well as via the web. It also supports the production and automation of Excel spreadsheets
For information on how to report data in DataJet see: Introduction to Reporting.
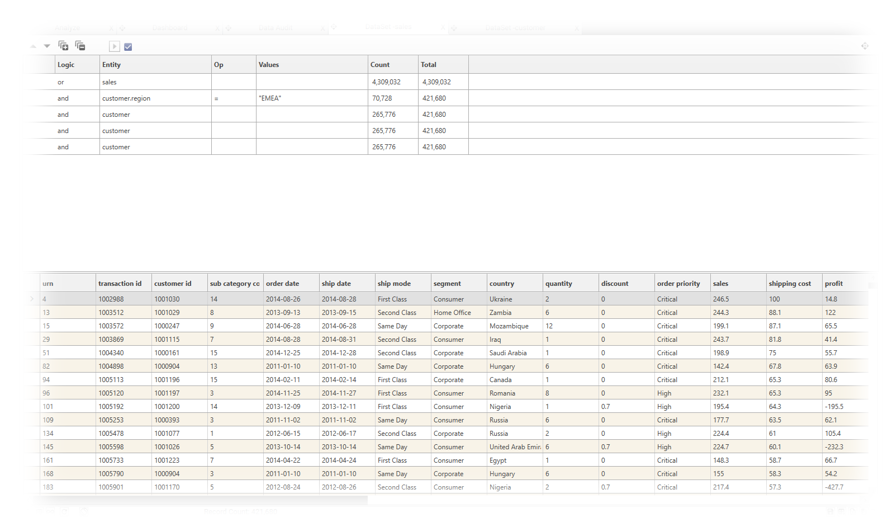
Datasets and Queries
Datasets are groups of records, and are created by executing Query Rules.
Datasets and queries can be viewed and edited through DataSet Scratch.
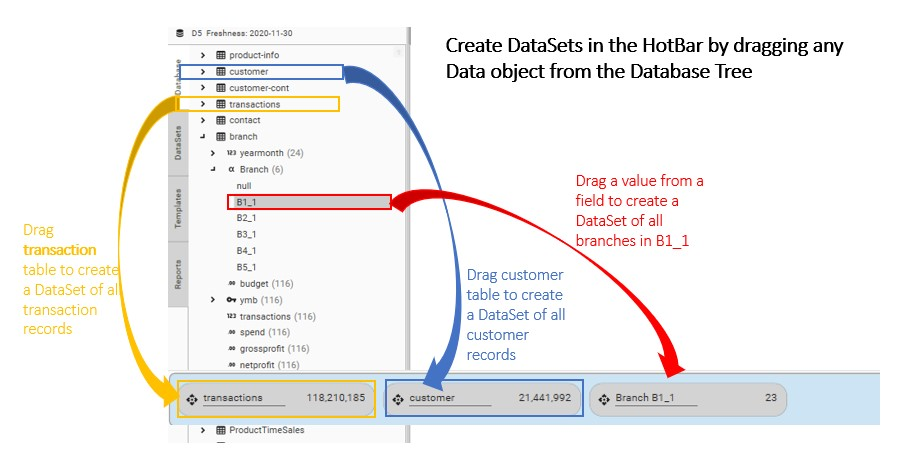
Datasets can also be created and modified via the interaction between the Project Explorer and the HotBar:
Engineering
Data almost always needs to be transformed in some way to get it ready for reporting, segment creation, modelling etc. As such, engineering is a key element of the analytical process. Data can be engineered using "train of thought" analysis via the application's desktop user interface, or via scripting. These methods complement each other and most analytics involves a combination of the two.
User Interface
Key functional areas for engineering are:
Scripting
Every action taken through the user interface that results in a change to the project data is permanently and automatically recorded via the Project History. This history can be used to construct a script that repeats useful actions each time the data is loaded. It also gives the analyst an insight into the underlying scripting methods that sit beneath the Desktop Tools. Objects can also be dragged from the Project Explorer and added to existing scripts.
As well as capturing and repeating desktop activity, many scripting methods are available from script editor allowing for the precise manipulation of records and fields.
For more information on Engineering, see:
Modelling
There are several approaches to modelling in DataJet:
- Rapid preparation of data sets for export into other systems
- Integrated Model Processing - within various profile reports
- Statistics, Correlation, Principal Component Analysis
- Plugins - RFM, Linear regression, basic clustering
For more details see Introduction to Modelling