The Data Audit Report gives an overview of the project data. It is accessed from either:
- Analytics | Data Audit .
- Project Explorer | Table Object | Right-Click | Audit
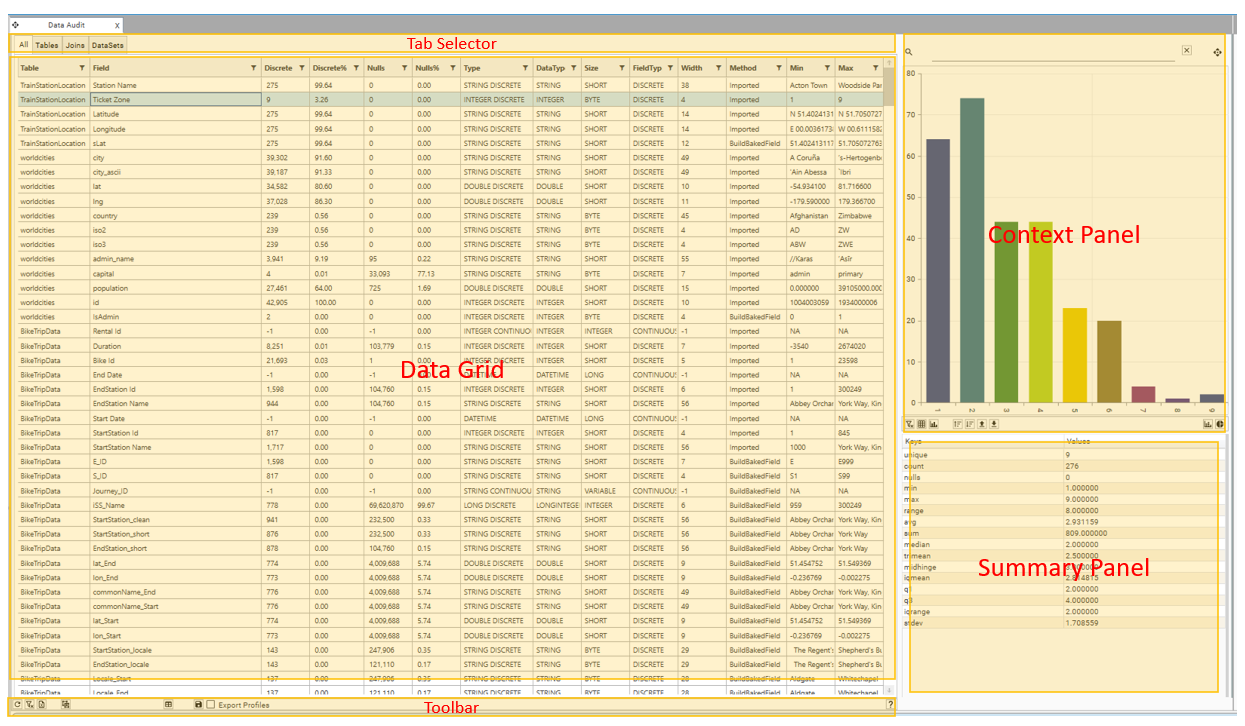
Data Grid
All
The All tab displays summary data for the current project schema. The following summary information is provided for each field in the current project:
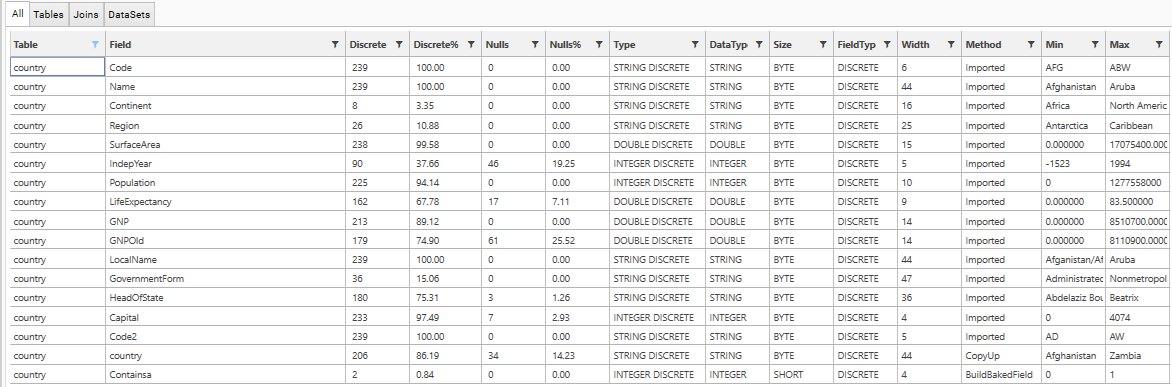
| Column | Description |
|---|---|
| Table | The shortname of the table to which the field belongs |
| Field | The shortname of the field |
| Discrete | The number of different (or discrete) values stored in the field |
| Discrete% | The percentage of records which contain unique values for the field |
| Nulls | The number of records with null data stored for the field |
| Null% | The percentage of records which contain null data for the field |
| Type | The field (string, integer, double) and data type (continuous, discrete). See Data Types |
| DataType | The field type, e.g., string, integer, double. See Data Types |
| Size | The Data Size. See Data Types |
| FieldType | The data type, e.g., Continuous, Discrete. See Data Types |
| Width | Maximum width of the field |
| Method | Method used to create the field:
|
| Min | Minimum value stored for field |
| Max | Maximum value stored for field |
Filter
Each column header in the DataGrid has a filter icon. Click this to bring up the filter dialog:
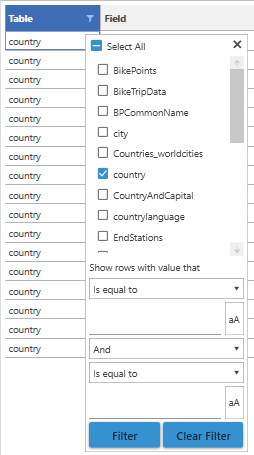
If a filter has been applied for that column, the filter icon will be highlighted in blue.
- filter the grid by the table if a table is dropped
- highlight the relevant field
Sort
Click on a column header to sort the column. Click again to reverse sort direction.
Select Row
Clicking on a row in the DataGrid will select it. This will cause the Context Panel and the Summary Panel to update for the selected field.
Right-Click
Right-clicking a row in the grid will bring up the Data Audit Context menu:
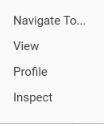
The items available on the menu will depend on what kind of field has been selected.
| Item | Description |
|---|---|
| Navigate To... | Navigates to the selected field in the Database Tree |
| View | Opens a DataView for the selected field |
| Profile | Opens and calculates a profile for the selected field |
| Inspect | Opens and calculates an inspection report for the selected field |
Inspection
Inspecting fields opens a dashboard that provides some detailed analysis of the field.
Default dashboards are provided with DataJet, but custom inspection dashboards can be created either at the individual field level, or for each Data Type. Custom dashboards over-ride standard dashboards.
See TODO: QQ - How do I inspect fields in DataJet?
Tables
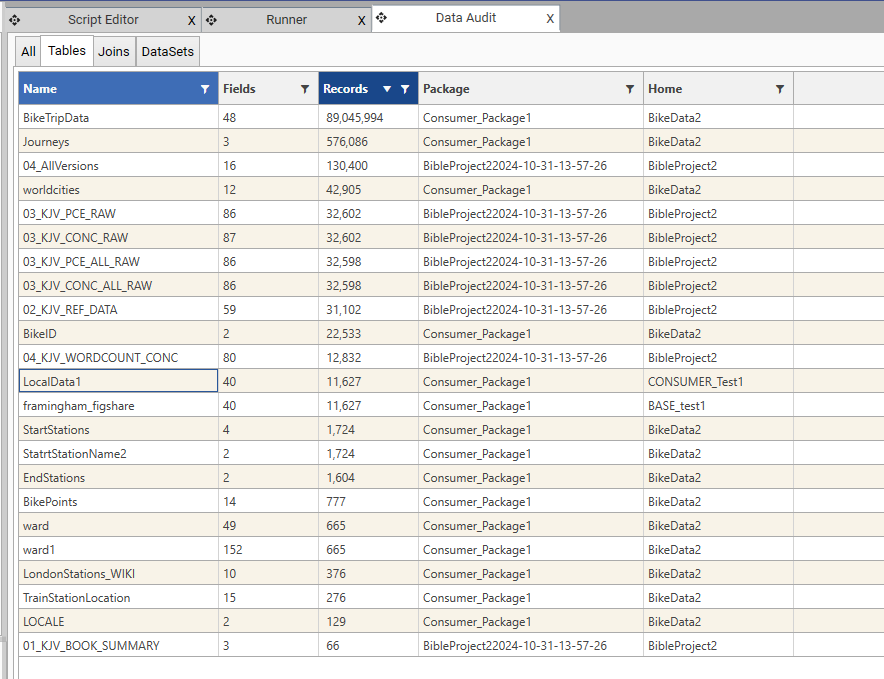
| Column | Description |
|---|---|
| Name | The short tablename |
| Fields | Number of fields in the table |
| Records | Number of records in the table |
| Package | If the table is injected, the source package name will be displayed |
| Home | If the table is injected, the name of the project that owns the data will be displayed |
Joins
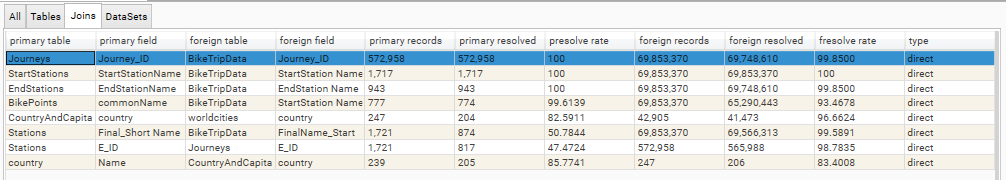

| Column | Description |
|---|---|
| primary table | Shortname of Primary Table (One side of One to Many Join) |
| primary field | Shortname of join field on the primary table |
| foreign table | Shortname of Foreign Table (Many side of One to Many Join) |
| foreign field | Shortname of join field on the foreign table |
| primary records | Total records on the primary table |
| primary resolved | Number of primary records that are in the join |
| presolve rate | Primary solve rate - percent of primary records that are joined |
| foreign records | Total records in the foreign table |
| foreign resolved | Number of foreign records that are in the join |
| fresolve rate | Foreign solve rate - percent of foreign records that are joined |
| Added in Version 7.1.30 | |
| type | Join type - can be direct or compound |
| layers | number of layers applied to the join |
| accel | whether or not an accelerator file has been applied (see ExtendIndexing) |
| package | Name of package from which join was injected (see Introduction to Data Injection) |
DataSets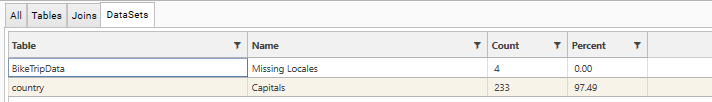
| Column | Description |
|---|---|
| Table | Shortname of owner table for the dataset - counts relate to this table |
| Name | Dataset name |
| Count | Count of records IN the Dataset (i.e., where fieldvalue = 1) |
| Percent | Percentage of table records that are in the Dataset |
Context Panel
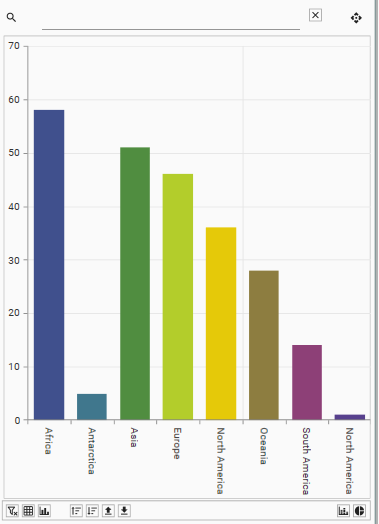
See Context Panel - Getting Started for more details on Context Panel functionality.
Summary Panel
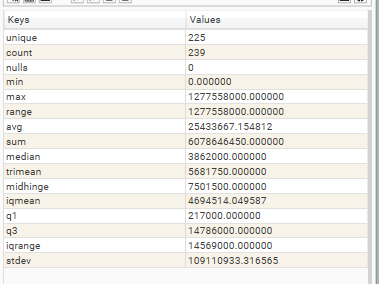
See Statistics - Quick Reference for details of summary statistics
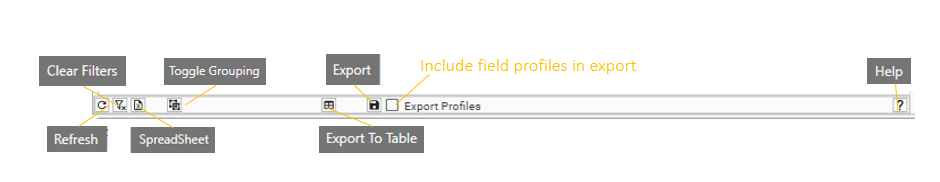
Toolbar
| Action | Description |
|---|---|
| Refresh | Re-runs the data audit and updates display with any changes to the project schema and data |
| Clear Filters | Clears all filters from all columns |
| Spreadsheet | Copies grid data into a DataJet Spreadsheet - from here data can be copied using the clipboard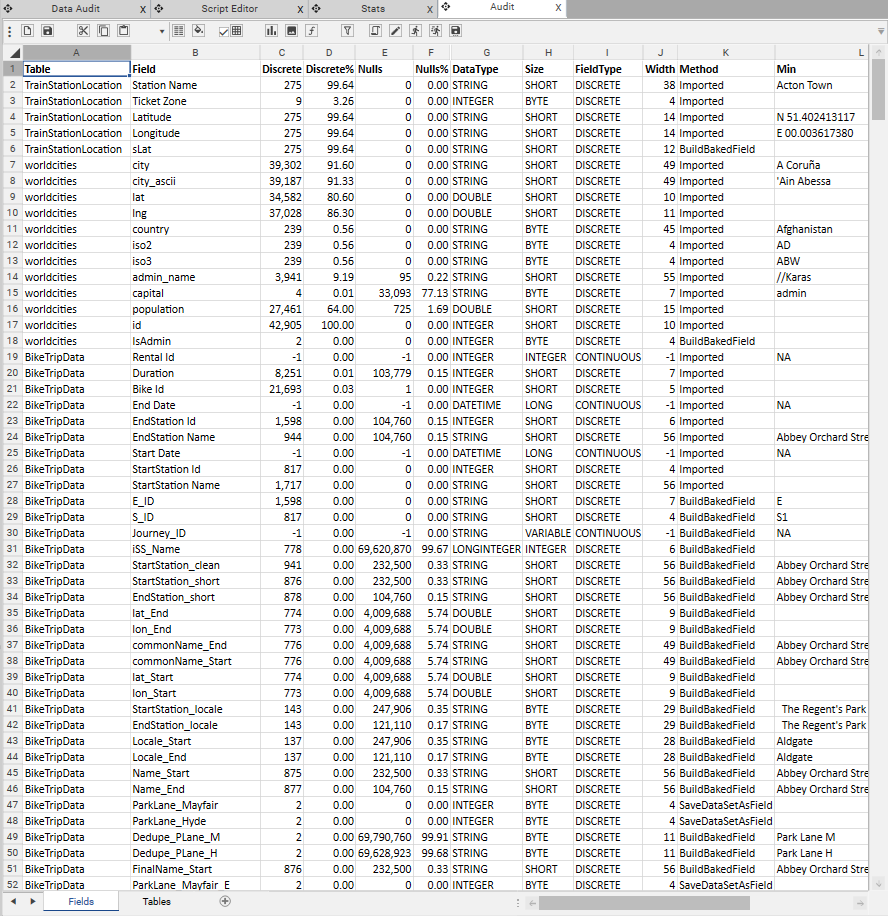 |
| Toggle Grouping | Drag a Table column header and drop on the groupby dropbox to group the data by Tables: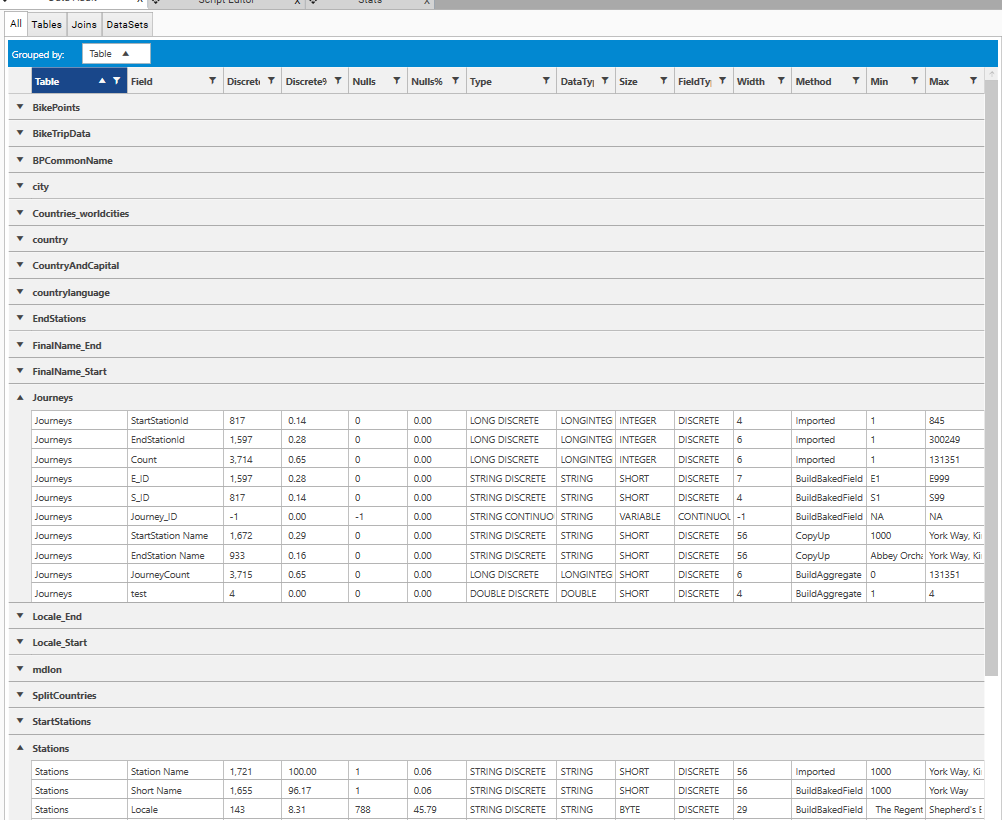 |
| Export To Table | Click to export Data Grid to a DataJet Table: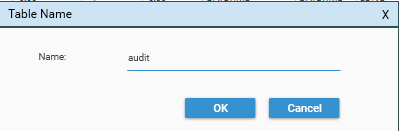 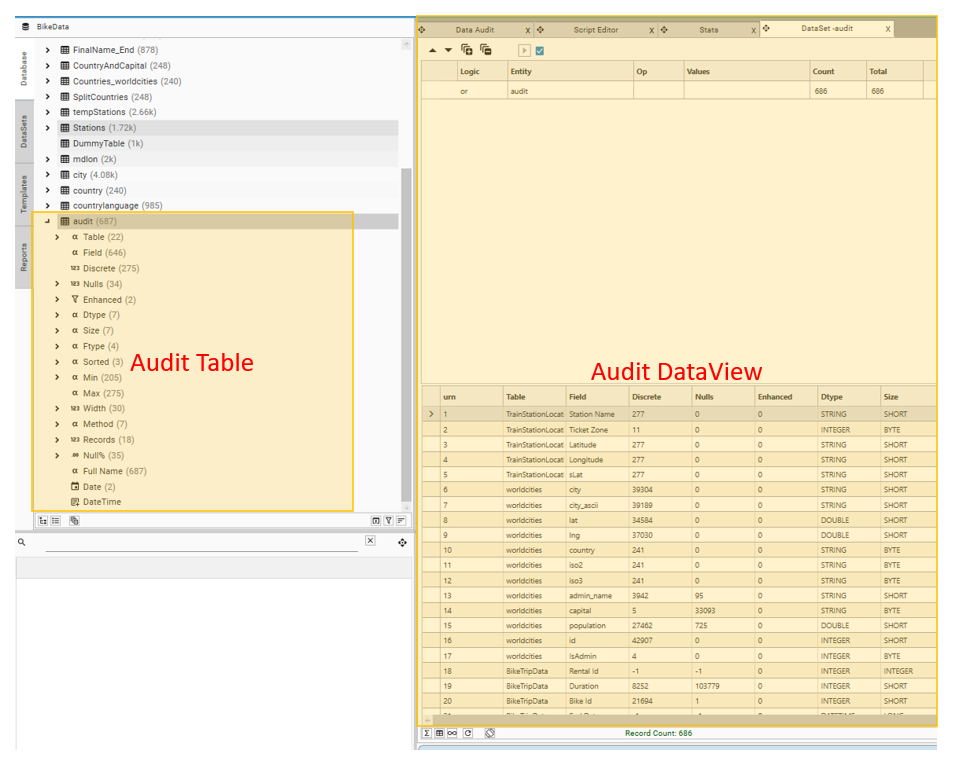 |
| Export | Exports Data to a local copy of Excel (Note - requires excel on the client machine) |
| Export Profiles | If selected, when exporting data to Excel, creates a worksheet for a profile of each field. Use the Indexworksheet to locate a field. Note All fields in the schema will be profiled 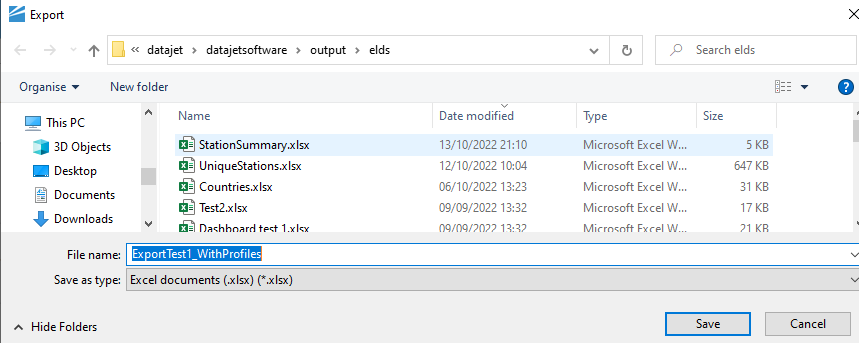  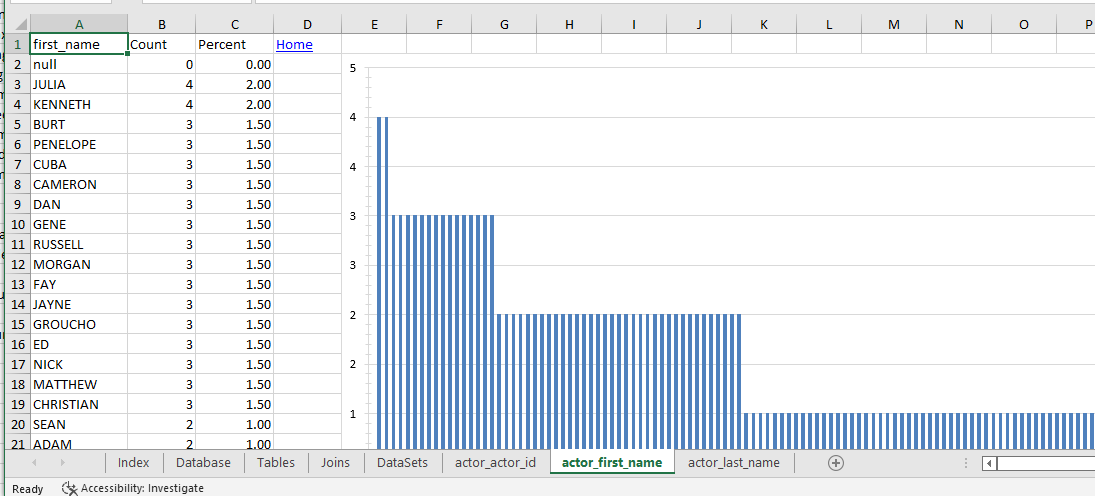 |
| Help | Opens the info panel and displays the context-sensitive help |
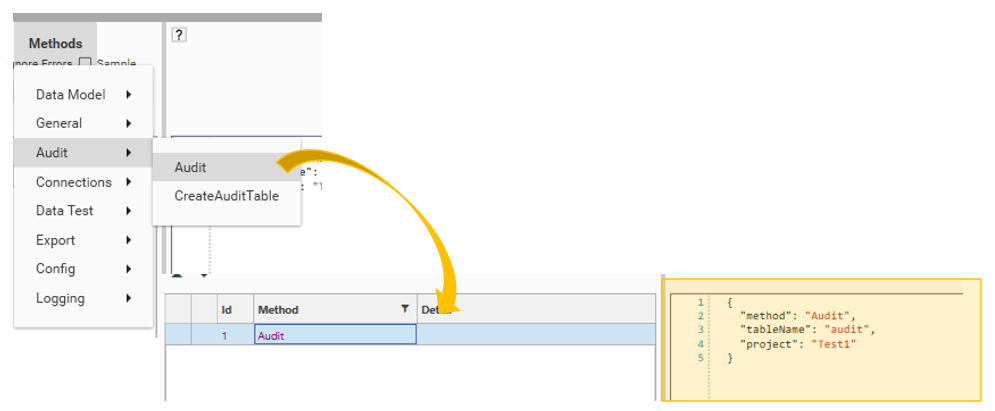
Scripting
Data Audit tables can be added to script by the following methods:
- Use the Script Editor | Methods | Audit command
- Create the Audit table from the Data Audit | Export option, and then drag the created table into the Script Editor window