Various options are available for auto-generating dashboards:
Mass Profiling Dashboard
A mass profiling dashboard is a dashboard that repeats the same profile report multiple times, changing a single parameter of interest with each iteration. The following reports support mass profiling:
- Single Dimension
- 2 Dimension
- Multi-Function Profile scatter plots - dataset only is iterative
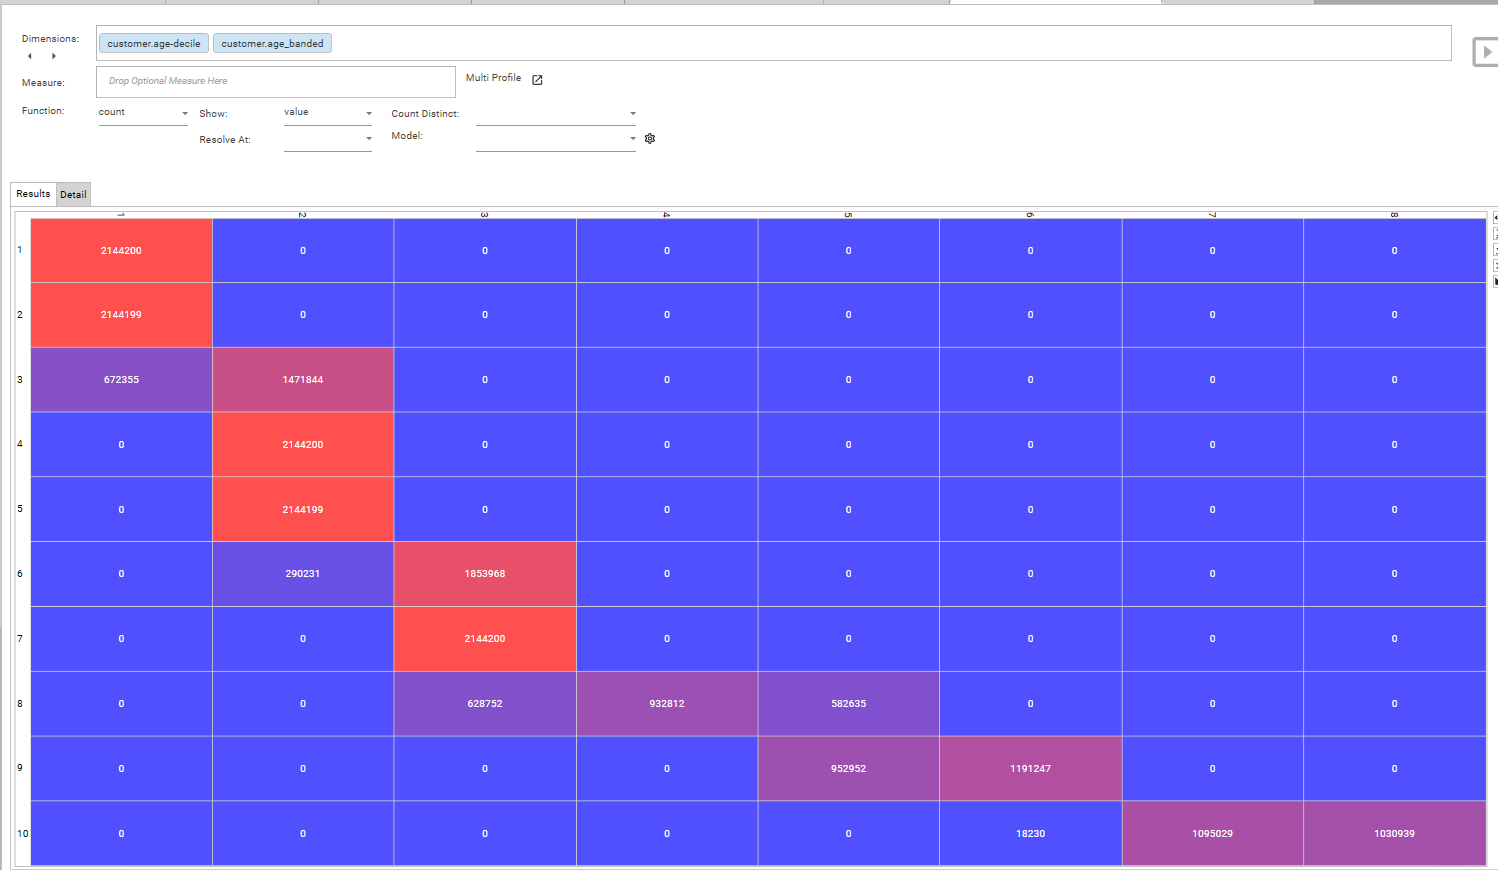
- 2 dimensional profile (crosstab/pivot) - pivot dimension is iterative
For each of these report types it is possible to iteratively change one of the following at a time:
- dimension - changed by dropping a field template onto the result grid
- dataset- changed by dropping a dataset collection onto the result grid
Iterating by Dataset
Iterating by dataset repeats the starting profile for each dataset in a collection, applying each dataset as a base filter. So for example, take a simple profile of marital status:
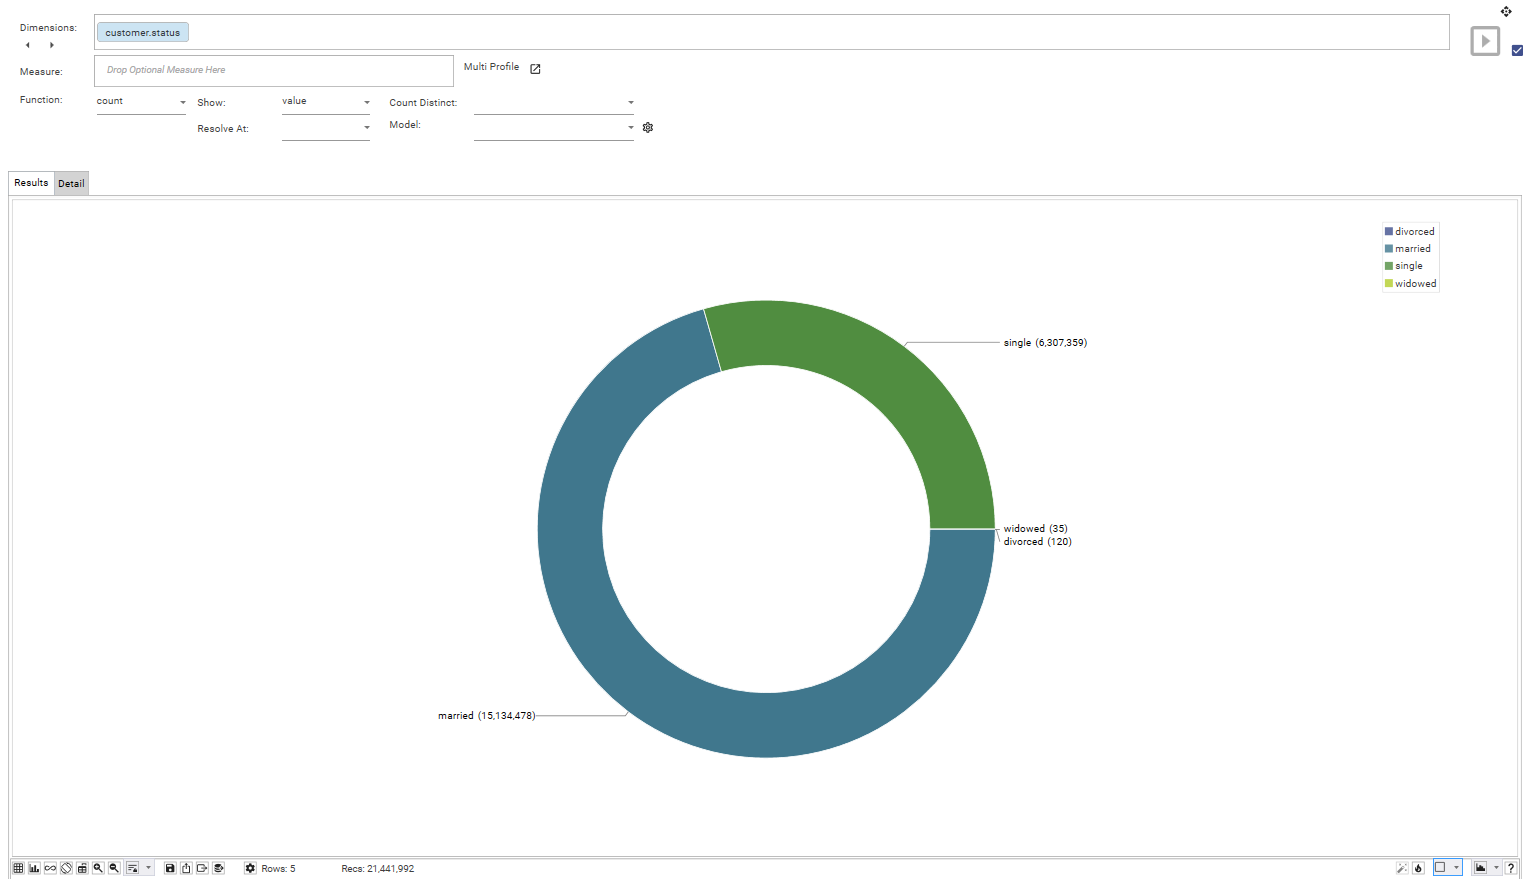
Perhaps there is a need to see this profile split out by age band.
To do this a dataset collection of the age bands of interest is created:
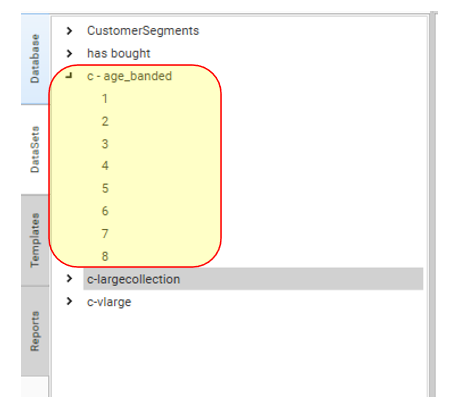
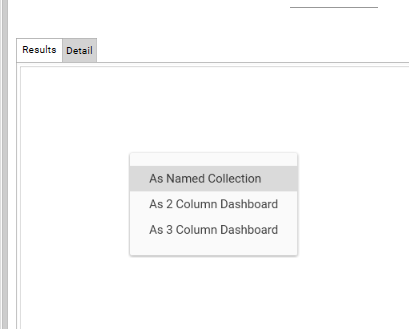
The dataset collection is then dropped onto the profile report.
Select either
- 2 column dashboard
- 3 column dashboard
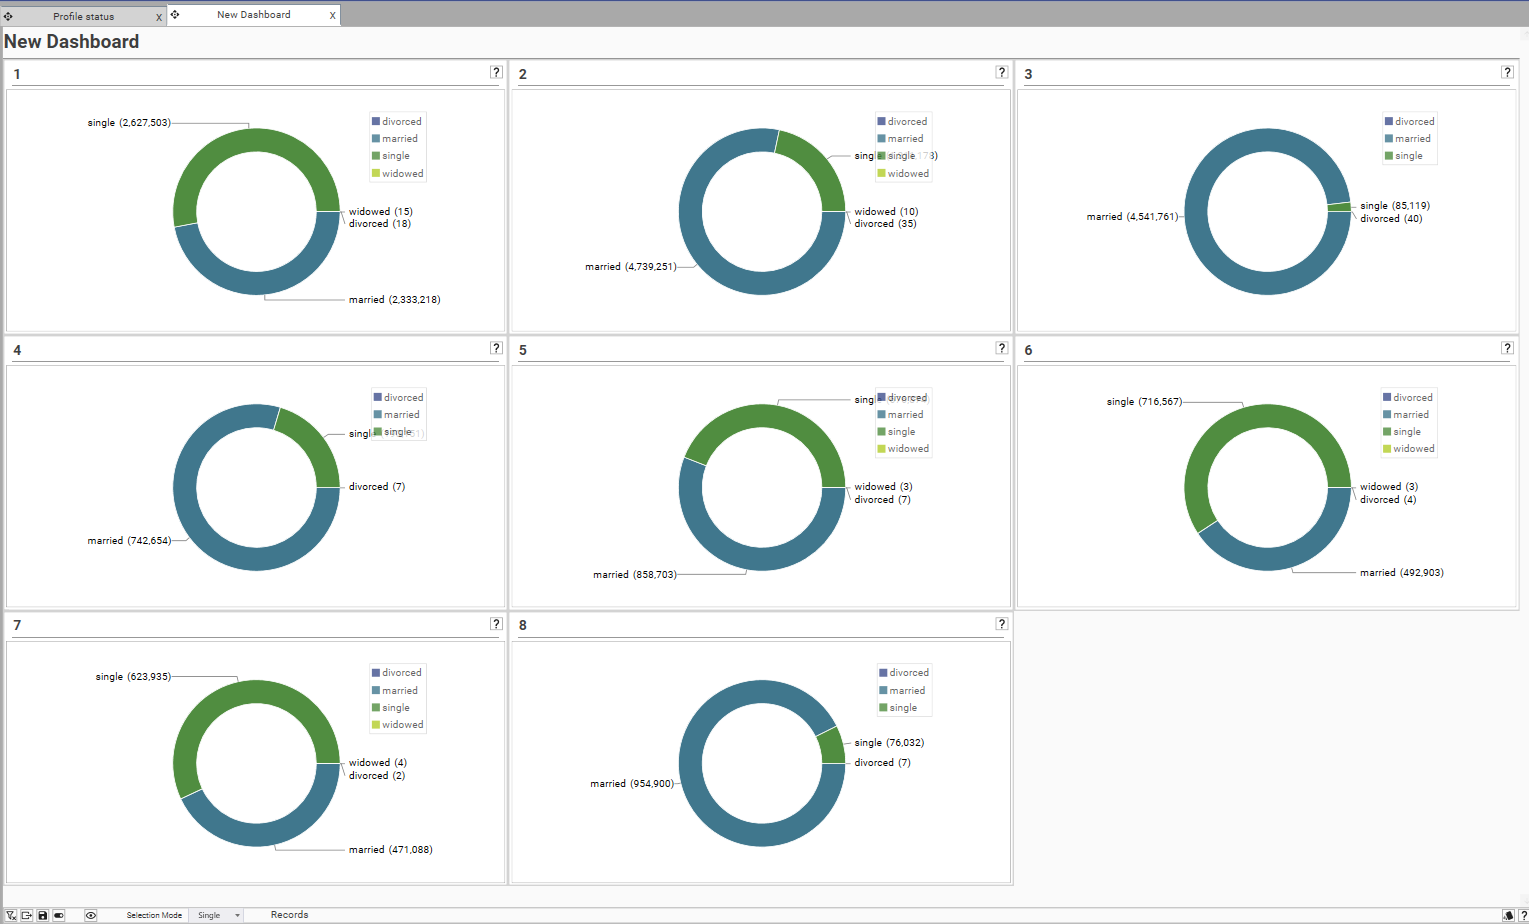
A dashboard is created, iterating through the datasets in the collection:
Iterating by Dimension
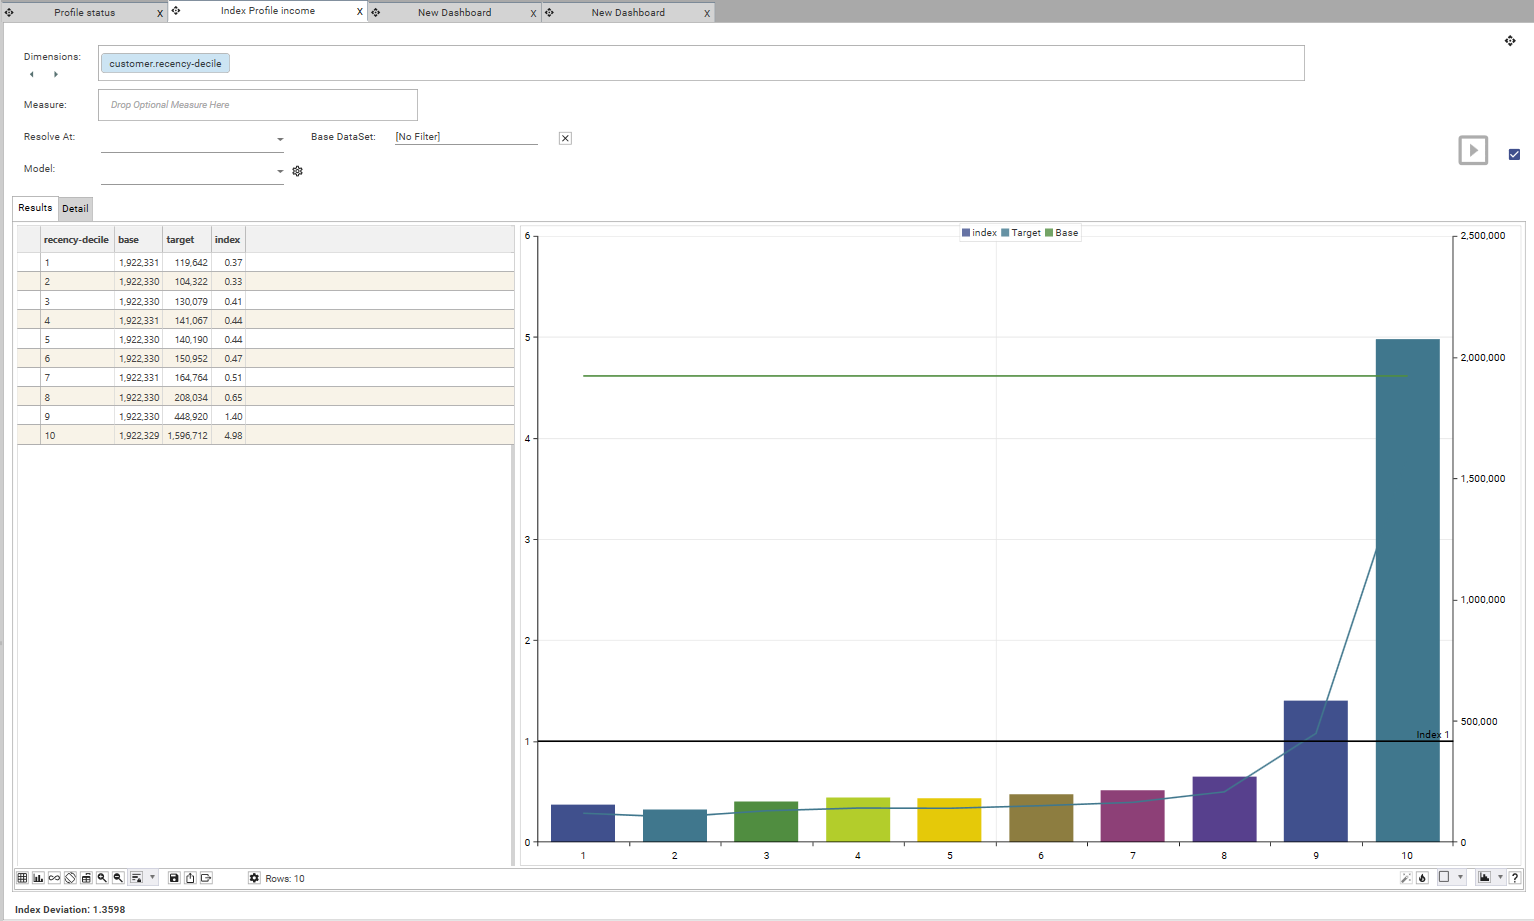
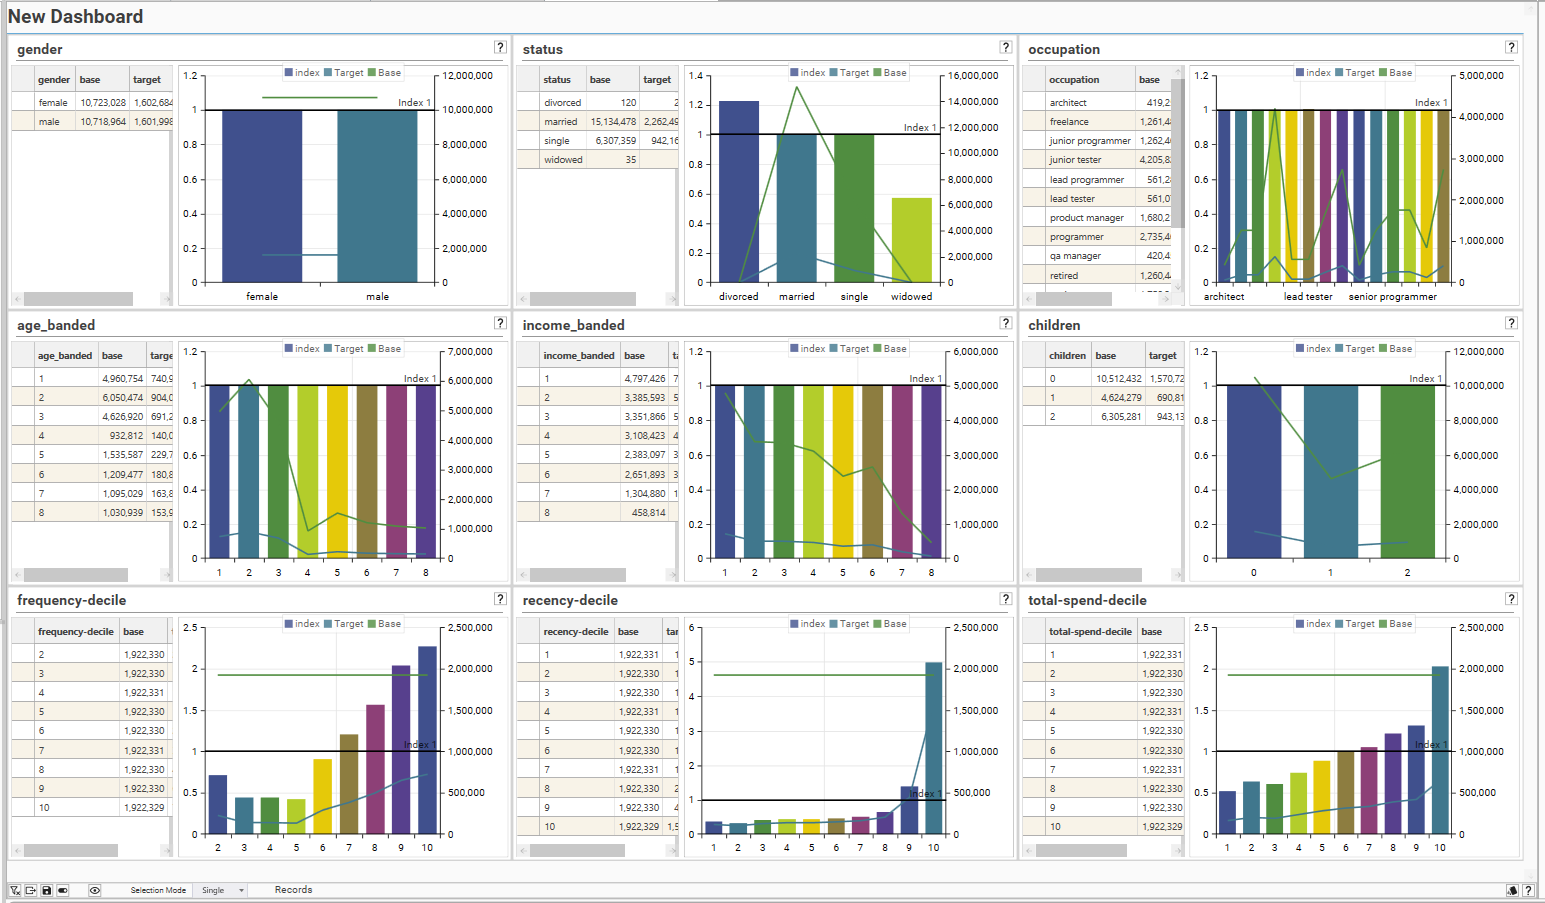
Iterating by dimension repeats the starting profile for each field in field template, applying each field as a dimension. So for example, take an index profile of customer-recency-decile with target filter of first transaction before 2020-0101:
Create a template of dimensions to profile (make sure they are Discrete Fieldfields)
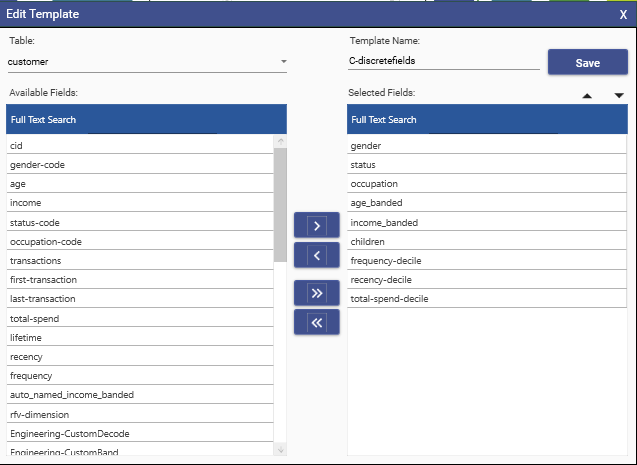
Drop the field template onto the index profile and a dashboard will be produced with an index profile for each dimension in the field template.
Limits
- A maximum of 24 iterations can be added to a single dashboard.
- A maximum of 64 iterations can be processed in a single calculation - if more than 24 iterations are specified, multiple dashboards will be produced
- Mass Profiling dashboards cannot be auto-generated in script from a dataset collection or template - as part of the script development process, automate the production of the dashboards, and then add the dashboards to the script.
Table Auto Dashboard
When first looking at data, especially unfamiliar data, it can be helpful to see a quick summary visualisation of a table and it's fields and columns.
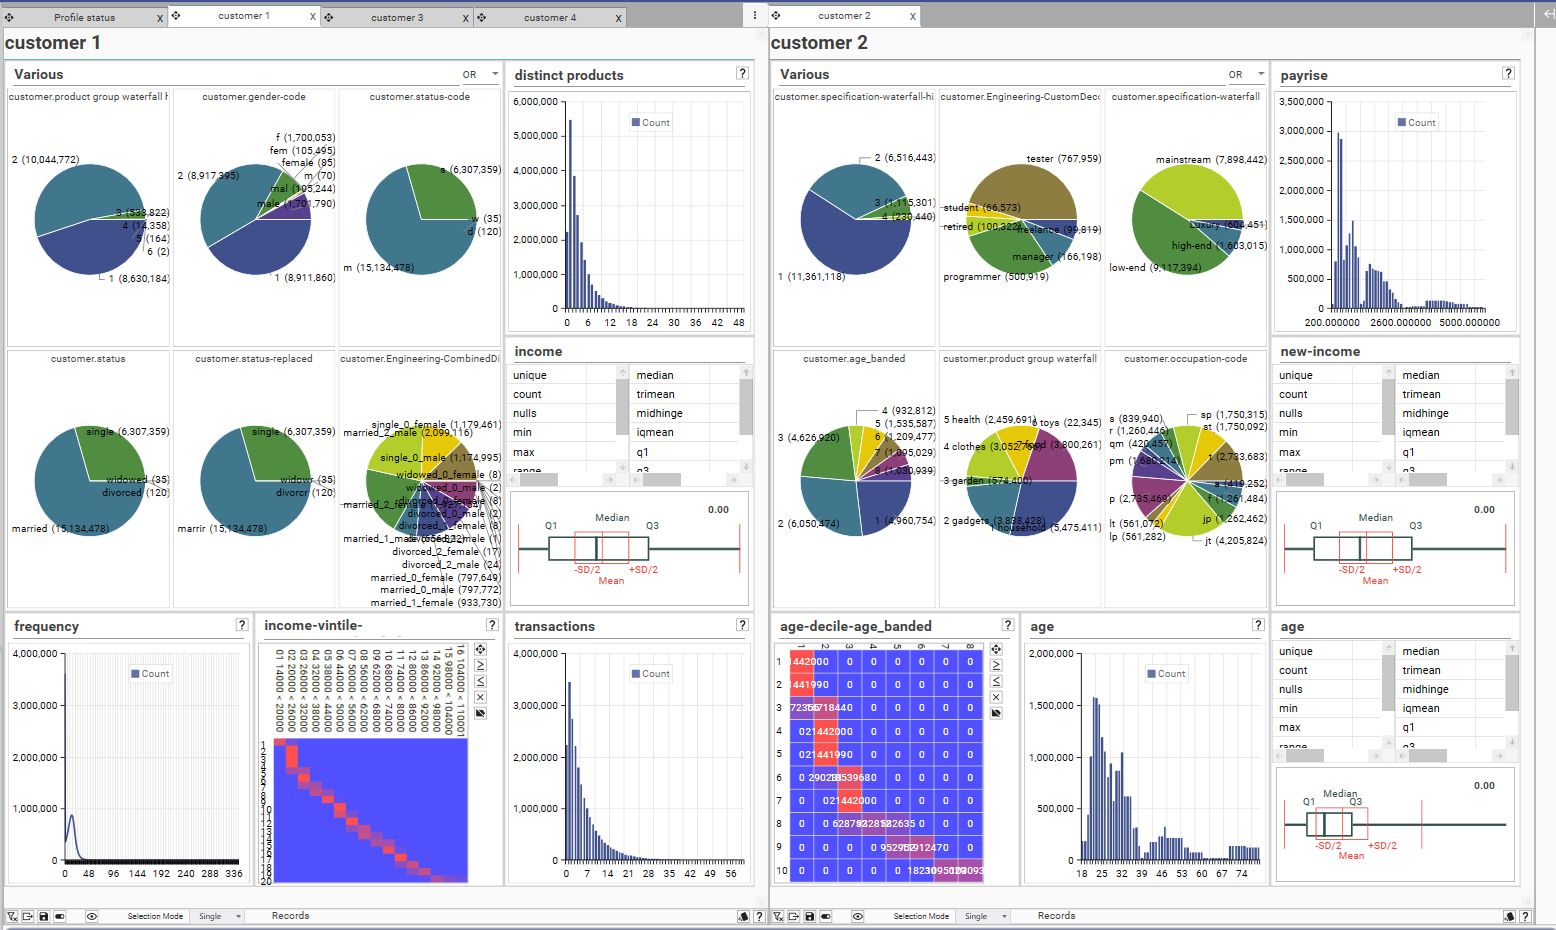
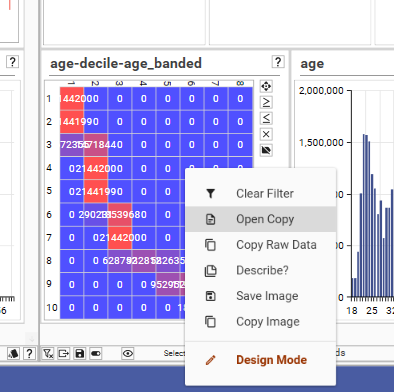
Right-click and open as copy any individual visualisations of interest:
Open as Dashboard
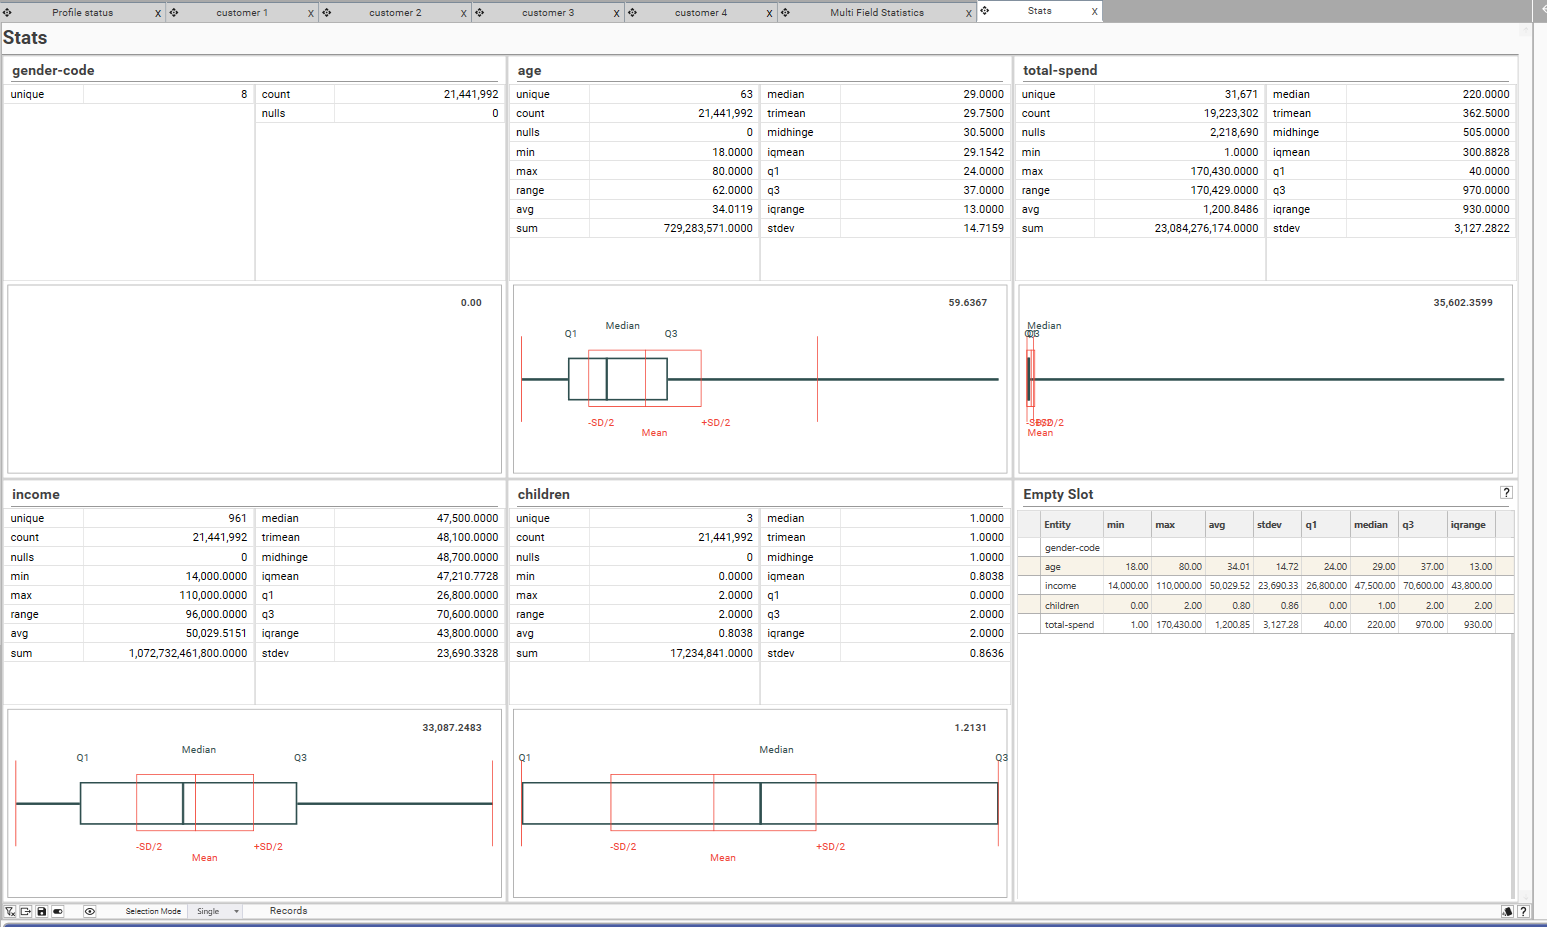
Available for the multi-field statistics report.
- Add fields to Setup grid.
- Select "open as dashboard" from the toolbar
- A new dashboard will be created, adding each field as a separate statistics report.
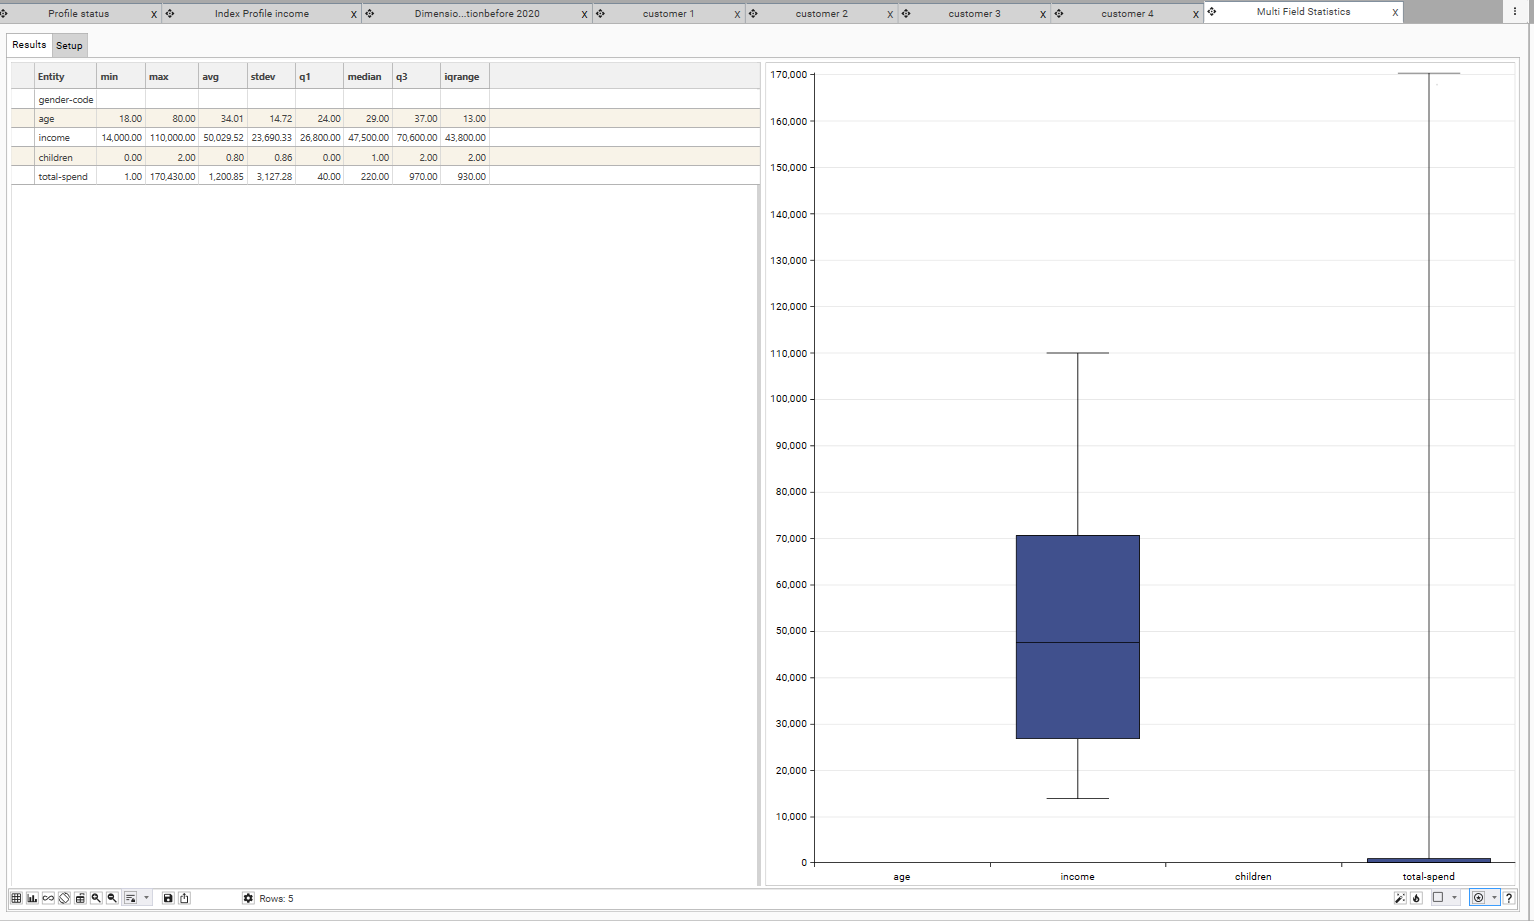
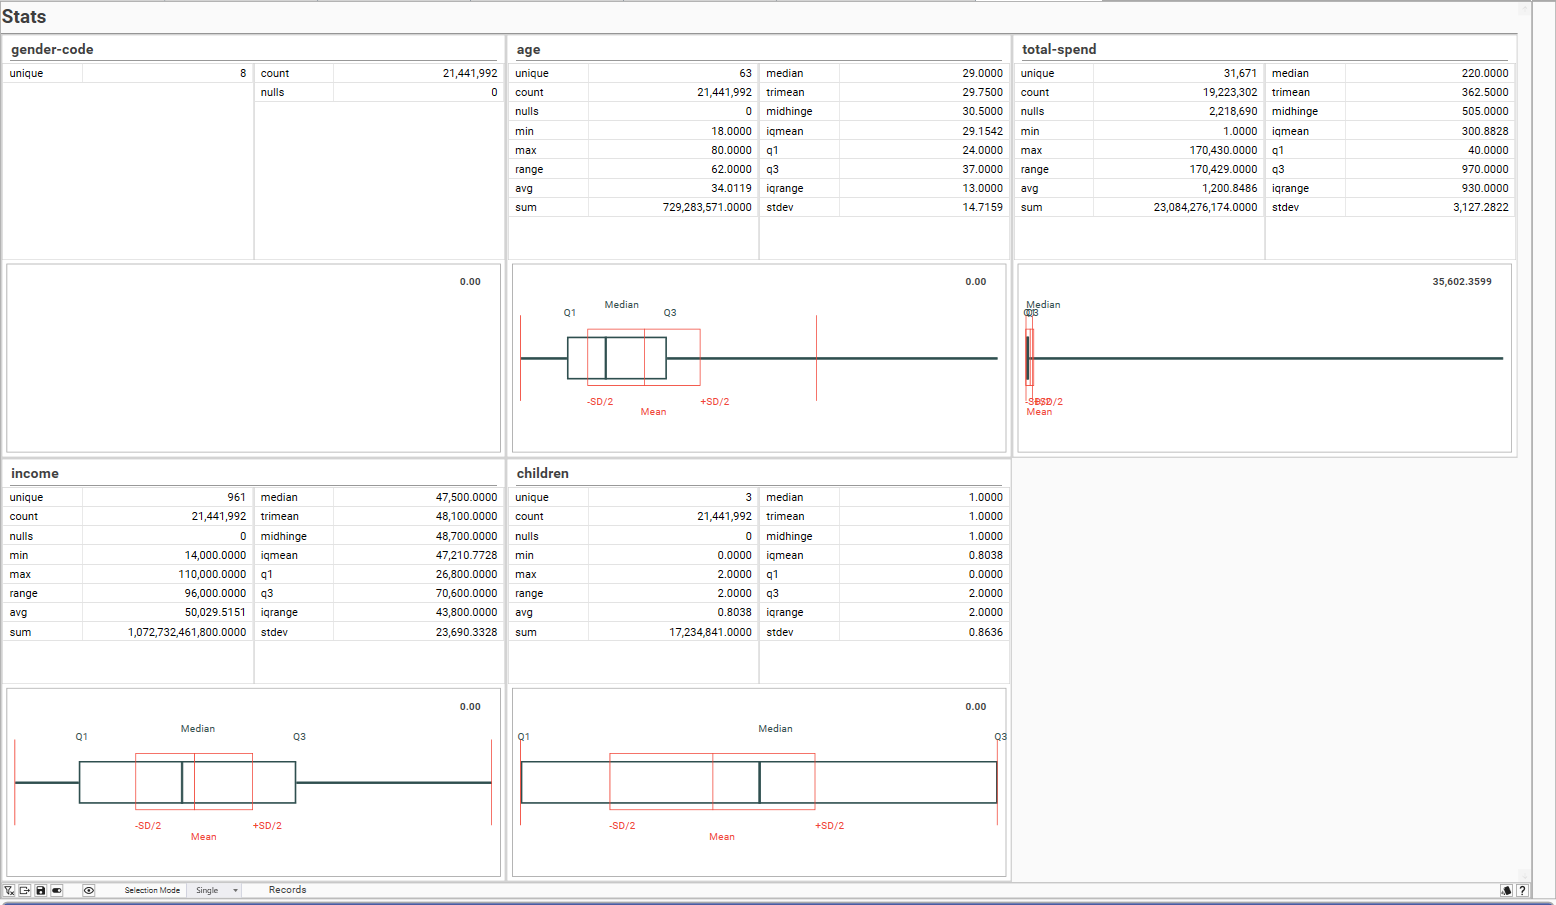
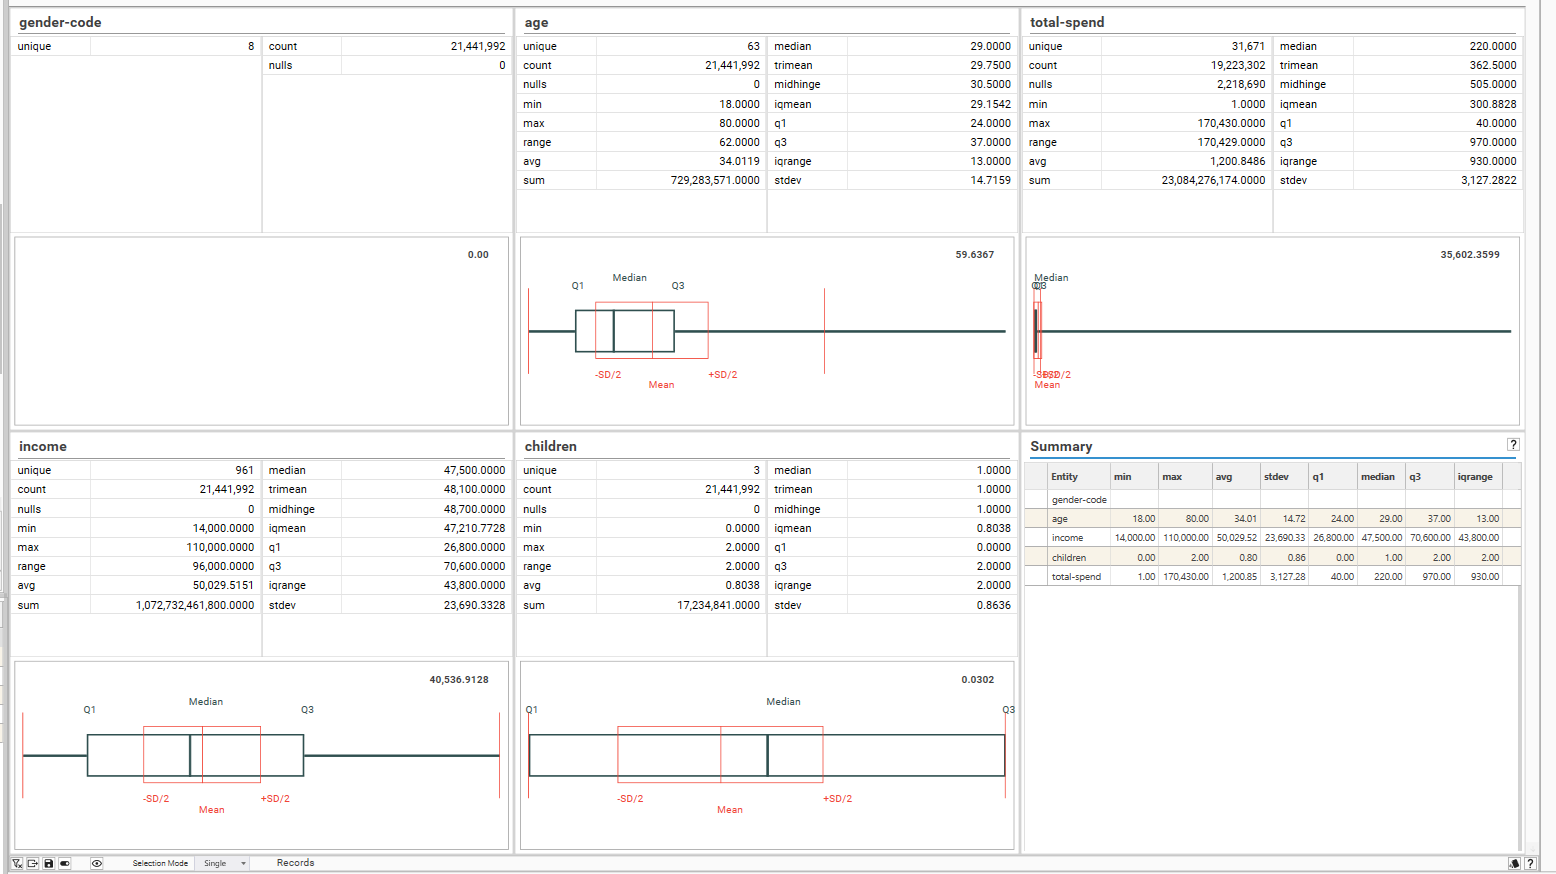
Add the original mutli-field stats report to the dashboard to add a summary slot to the final dashboard (optional)