Saving and Storing Dashboards
Like other reports, Dashboards can be persisted by saving. To save a dashboard, click the save button in the micro-toolbar:
This will open the Save Report Dialog:
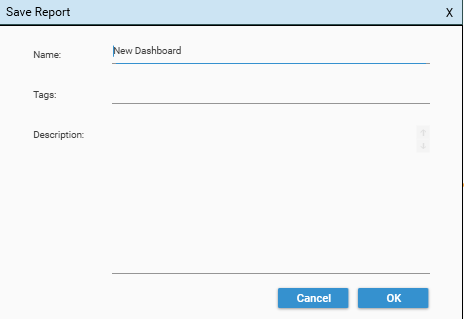
Name
Give the Dashboard a name – there are no limits on the type of character than can be specified in a dashboard name.
Once a name has been given to a dashboard, it cannot be changed – any changes to Dashboard name will result in a copy of the original dashboard being saved with the new name.
Tags
Tags allow reports and dashboards to be organised – each unique tag will be visible as a folder in the Report tree.
If a folder does not already exist for the tag it will be created. Folders that have no content will be automatically deleted.
If a tag is specified for a dashboard, the dashboard will appear in a folder of that name, and will also appear in the Home folder. The Home folder contains a link to all reports and dashboards that are in the project.
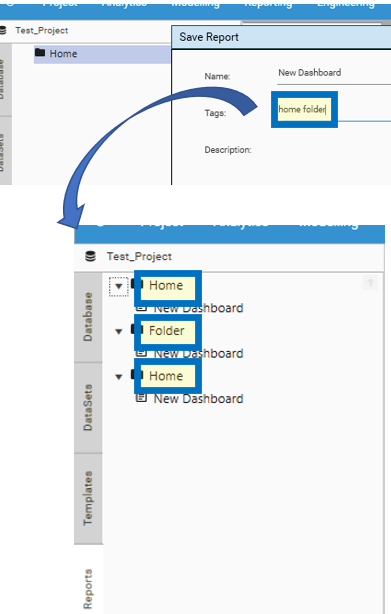
A dashboard can be stored in multiple folders. Multiple tags can be assigned to the same Report or Dashboard - separate tags with a space. For example home folder would place a link to the dashboard in 3 locations:
- Home – root folder that contains a link to all dashboards and reports
- Home – custom folder created from home
- Folder – custom folder created from folder
Note that regardless of how a tag is written, Folders always use First letter Capitalization
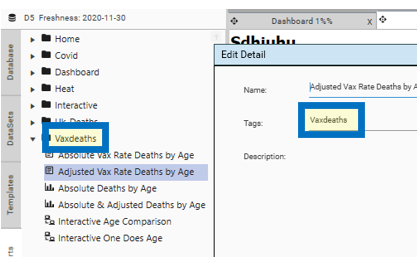
To change the tags for an existing dashboard, right-click the dashboard in the Report Tree and choose Edit Details.
Description
When saving a dashboard or report, provide a short description. The description text will be displayed in the context panel when the report item is selected in the report tree.
Distributing and sharing Dashboards
Dashboards are available by default to all administrative users of the system. Other users must be explicitly given access to Dashboards before they are available.
Dashboards appear in a browser as Free-Flow Reports;
Dashboard Icon
Dashboards are stored with the following icon:

Sharing
Configure access to dashboards by right-clicking the dashboard in the Report Tree and choosing Sharing. The Sharing dialog will be displayed with a list of applicable users and groups.
Note: Use Admin | Management Console to configure users. Most DataJet installations will control data and reporting access by integrating directly with an organisation’s existing User Management system.
Preview
Dashboards can be previewed in a browser before they have been saved or distributed by clicking the preview button in the micro-toolbar;
It may be necessary to login before previewing the dashboard.
Workbooks
Dashboards can be distributed by adding them to workbooks. For more information on this, see DataJet Workbooks.
Notifications and Links
Dashboards can be automatically distributed via script using the Postman function. For more information on this, see Postman.