Supported Components
Dashboards can contain the following components:
- Profiles
- Simple Profile
- Crosstabs
- Index Profiles
- Multi-Function Profiles
- Multi-Field Profiles
- Statistics
- Data Views
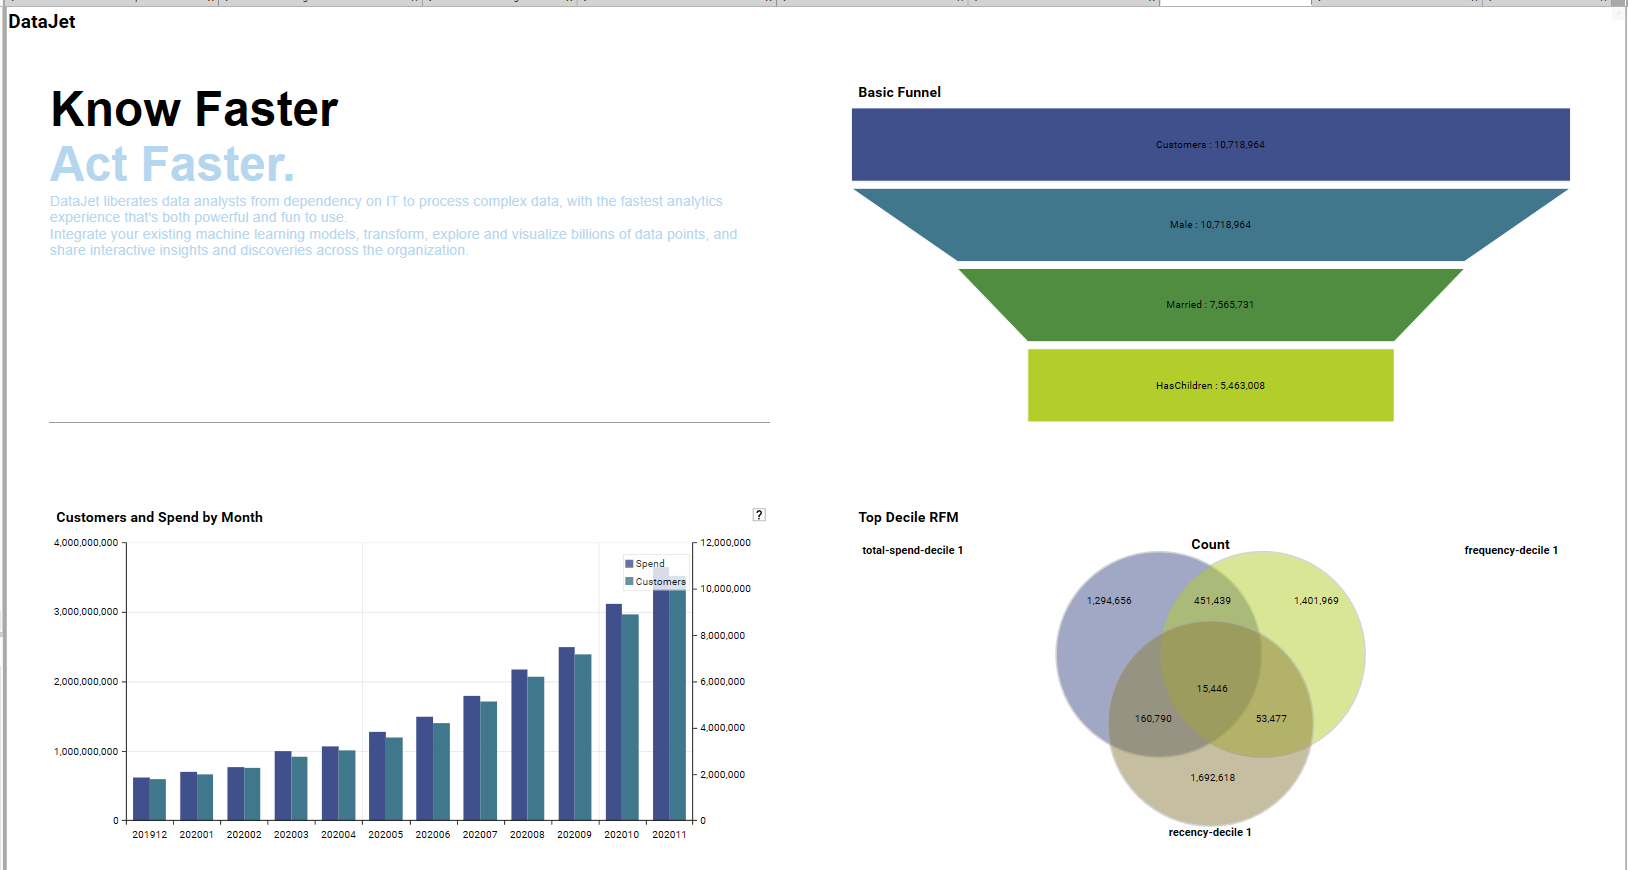
- Funnel Chart
- Panel Forms
- Rich Text Forms
- Venn Diagram
<<TODO: Quick Snippet - types of components>>
Available Mechanisms
Data can be added to a dashboard by dragging and dropping one of the following onto a slot:
- An open Workspace Tab
- A Saved Report from the Report Tree
- A Category Field from the Database Tree - create a profile or index profile
- A Numeric Field from the Database Tree - create a profile, index profile, or statistical summary
Quick Snippet - mechanisms of adding components to a dashboard
Profile Reports
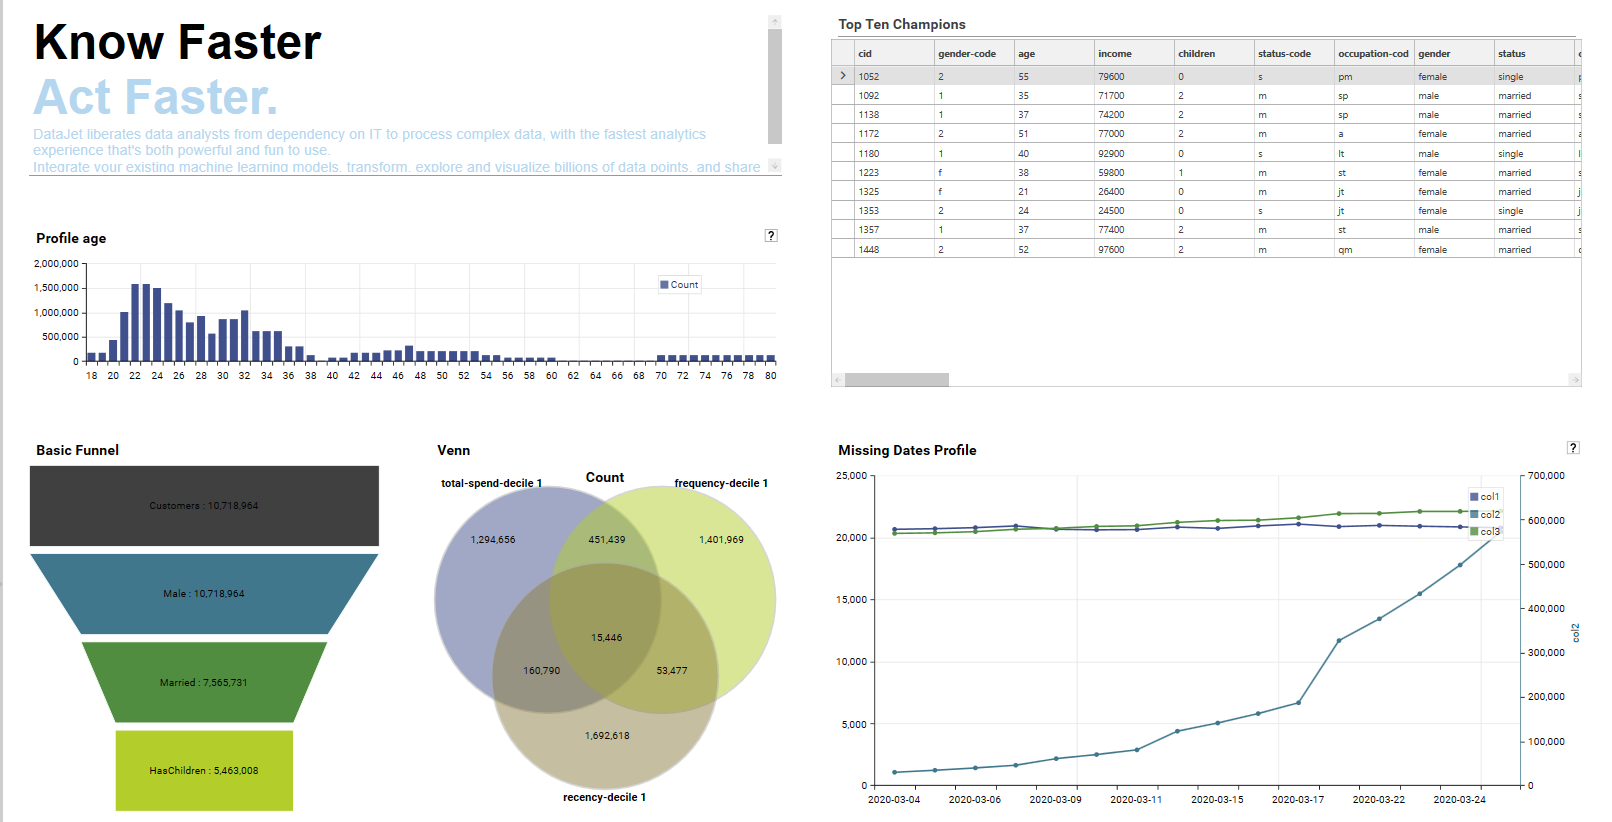
Profile reports are a form of instant calculation and visualisation that allow data to be aggregated, grouped, sliced and summarised according to whichever measures and dimensions are present in the source data.
.png)
Any existing profile report – saved or otherwise – can be dropped into a dashboard slot. If the slot already contains a report, the user will be asked if they wish to replace the existing report.
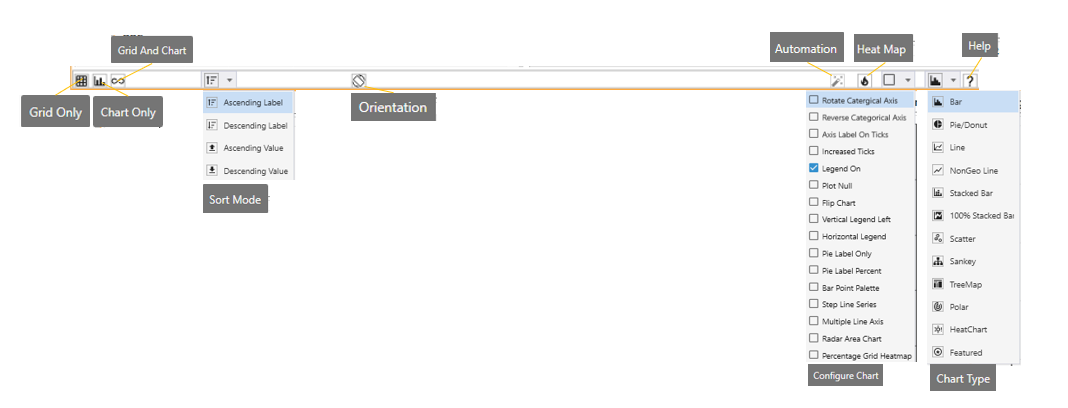
The profile’s micro-toolbar can be used to edit the look and feel of the profile report once it has been placed in a slot, allowing a copy of the visualisation to be dynamically modified within the dashboard:
To make changes to additional report settings, right-click the slot and choose Edit Report.
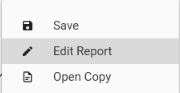
To interact with the result-grid of a dashboard profile (for example to change sort order), right click and choose Edit Report.
Quick Snippet - changing a visualisation inside a dashboard
Instant Profiles
Profiles can be instantly added to dashboard by dragging and dropping category data directly from the Database Tree. On dropping the category field, a choice of available report types will be displayed. Choose from:
- As Profile
- As index Profile
Default View
To set the default view that will be applied to Instant Profiles (i.e., any profile that is created by dragging from the Database Tree into a Dashboard, or by right-clicking and choosing profile from the Database Tree) first configure a profile to have the desired settings, then right-click and choose Set Default State.
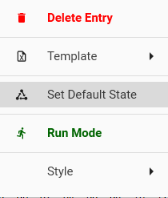
(Note: the dashboard must be in design mode to access this setting).
<<TODO: Quick Snippet - setting default state for profiles>>
Statistics
<<TODO>>
Data Views
Data Views can be dropped into a dashboard from an open Dataset View Tab. There are limitations on the data that can be displayed in dashboards, as DataJet Views can contain billions of records.
If there are less than 8196 records in the DataSet, then all rows will be displayed. If there are greater than 8196, the limit will be MaxDisplayRows. By default, MaxDisplayRows = 100.
This can be modified by… (<<TODO: How to configure max number of rows to be displayed in dashboard Dataset>>)
Panel Views
Panel Views provide the ability to add statistical summary data to dashboards. They are accessed via the Engineering | Panel Form option and can be configured to display the desired number and layout of panels by adding panels and setting the number of columns:
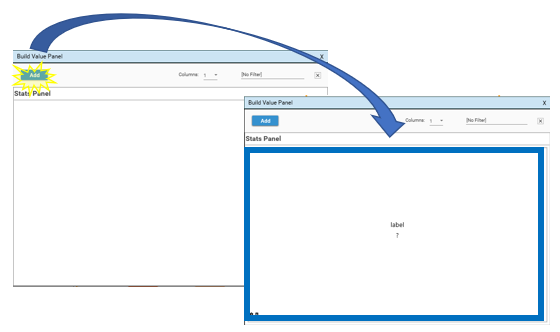 Add new panels to the form
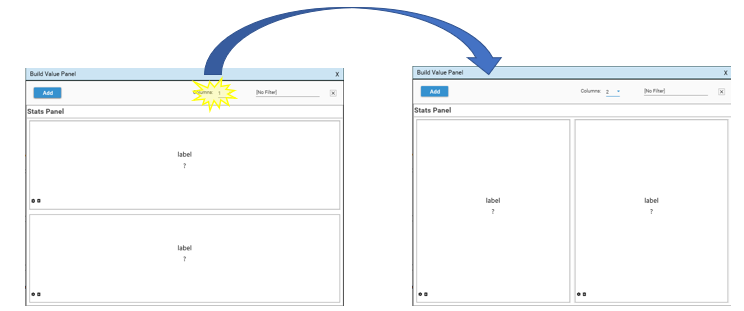 Configure layout of panels
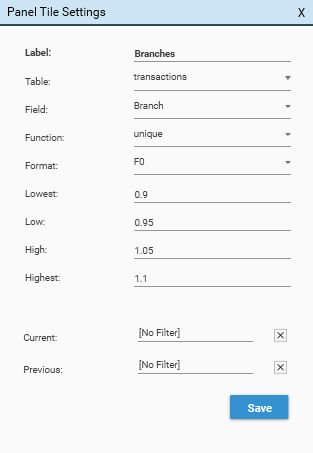
Each panel is set up by right-clicking and choosing Modify:
Once the panel form has been fully configured, drag the form from the Panel Dialog into a dashboard slot:
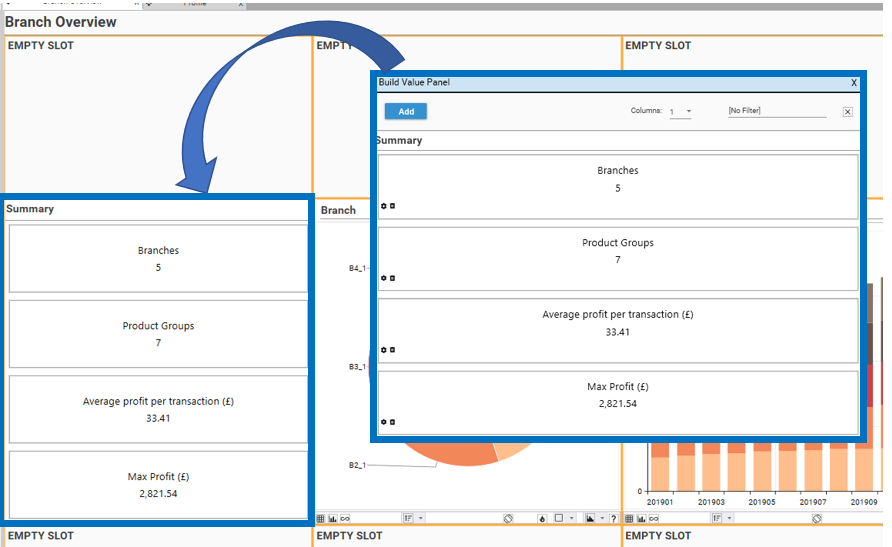
To Edit a panel form that has been added to a Dashboard, Right-Click the panel and choose Open Copy. It is possible to have multiple Panel Forms open at the same time.
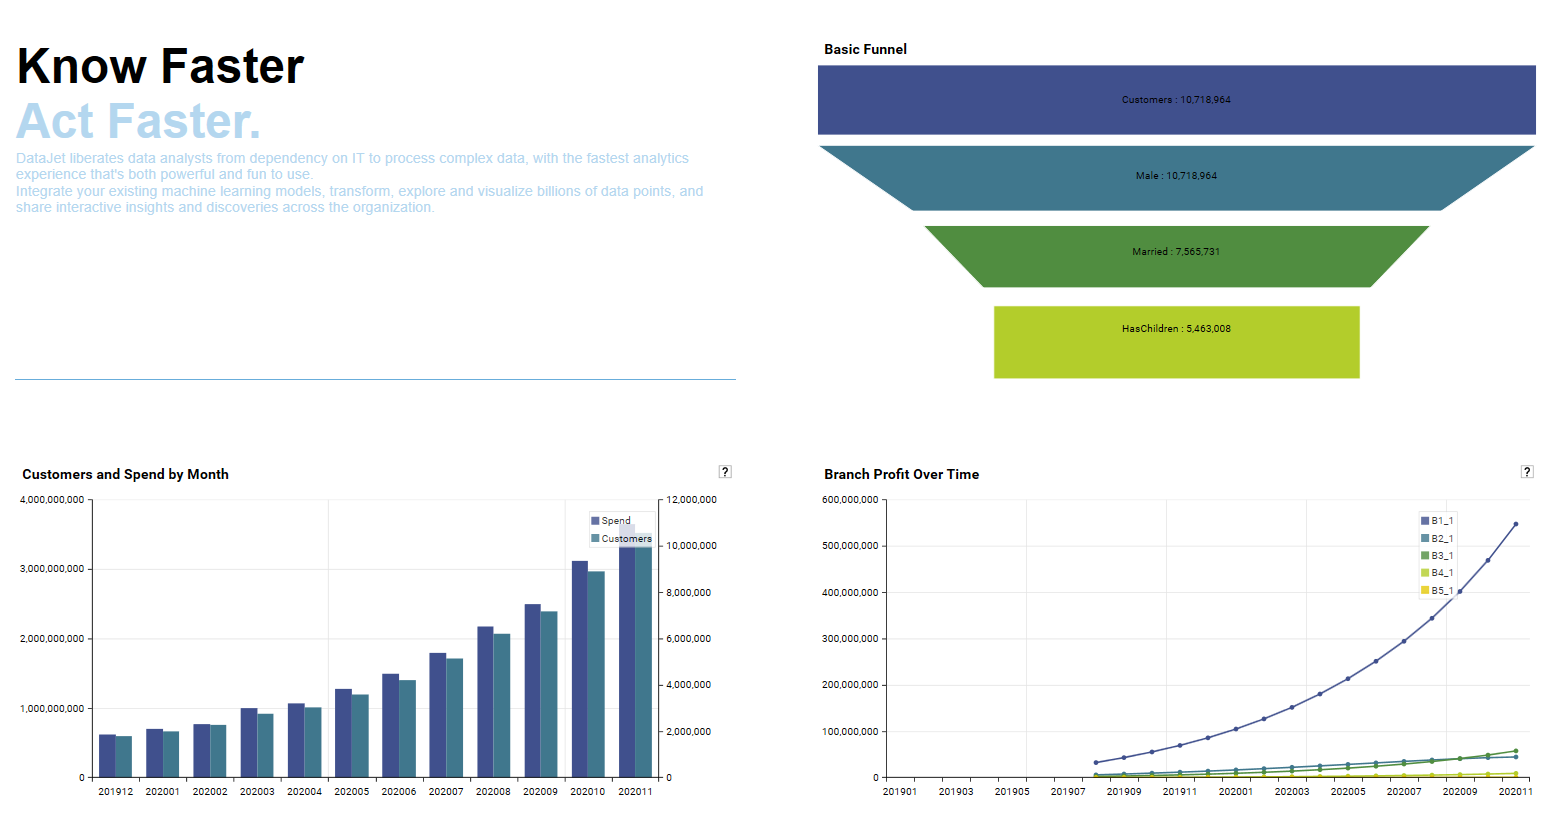
Funnel Chart
Funnel charts can be added to Dashboards from:
- An open FunnelWorkspace Tab
- A Saved Report funnel report from the Report Tree
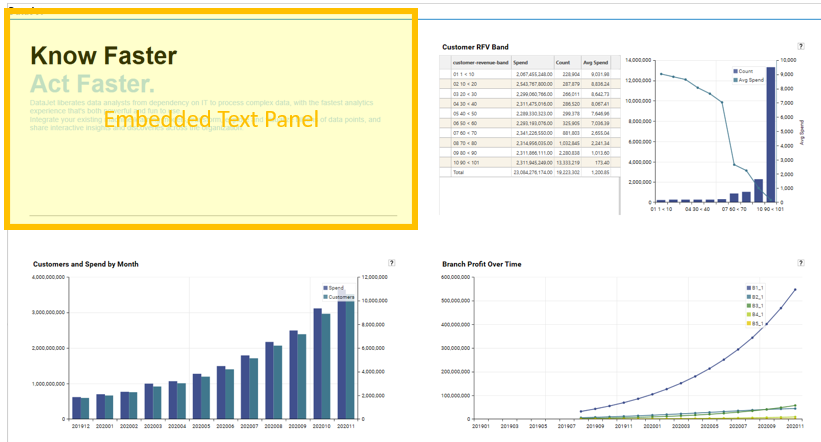
Rich Text Forms
To add Rich Text content to a dashboard:
- Create the text panel using Engineering | Embedded Text (BETA). This will open an Embedded Text workspace tab.
- Copy and paste formatted text - which can include images - into the panel.
- When the panel is complete, drag and drop the panel tab into a Dashboard slot
<<TODO: Not currently supported in Discovery - displays the "Visual type not available" message>>
Venn Diagrams
Venn diagrams can be added to Dashboards from:
- An open Venn Workspace Tab
- A Saved Report Venn from the Report Tree