Calculates a running total on data created by raw multi-function profile or data added during post-processing
Purpose
Use this function to:
- Create running totals from the results of other post-processing
Parameters
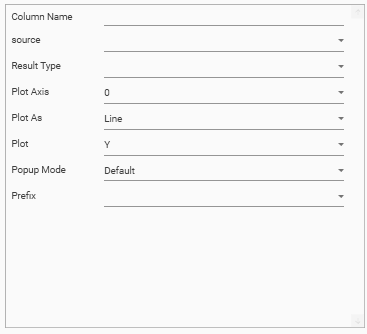
| Parameter | Description |
|---|---|
| Column Name | Required. The name of the output column |
| source | The Column in the result set to accumulate. Can be from a measure, or a previously calculated post-processing column. |
| Result Type | integer / double The precision of the output column. |
| Plot Axis | 0 / 1. Y-Axis to use when plotting graph. Default = 0 |
| Plot As | Bar / Stacked Bar / Line / Spline / RangeLow / RangeHigh / CSLow / CSHigh / CSOpen / CSClose Determines the graph style for the output column. |
| Plot | Y / N. Specifies whether measure’s output column should be plotted on graph. Default = Y |
| Popup Mode | Default / None / Extended |
| Prefix | £ / $ / E / % |