Allows new columns to be added to the result set by applying expressions to existing result set column
Purpose
Use this function to:
- Perform mathematical operations on result set columns
Parameters
| Parameter | Description |
|---|---|
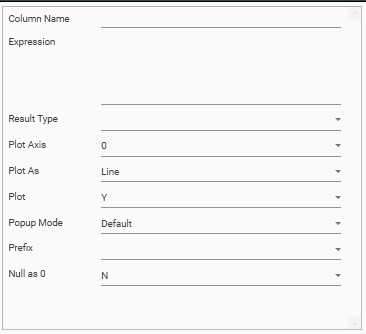
| Column Name | Required. The name of the output column to create. |
| Expression | Required. Mathematical expression. Supported operators: + - * ÷ ( ) Operations can be performed on columns or definite values. e.g.
Column names must be in square brackets [ ] and must reference columns that are created via measures or via earlier post-processing columns. |
| Result Type | Integer / Double / dpercent / ipercent |
| Plot Axis | 0 / 1. Y-Axis to use when plotting graph. Default = 0 |
| Plot As | Bar / Stacked Bar / Line / Spline / RangeLow / RangeHigh / CSLow / CSHigh / CSOpen / CSClose Determines the graph style for the output column. |
| Plot | Y / N. Specifies whether measure’s output column should be plotted on graph. Default = Y |
| Popup Mode | Default / None / Extended |
| Prefix | £ / $ / E / % |
| Null as 0 |
Examples