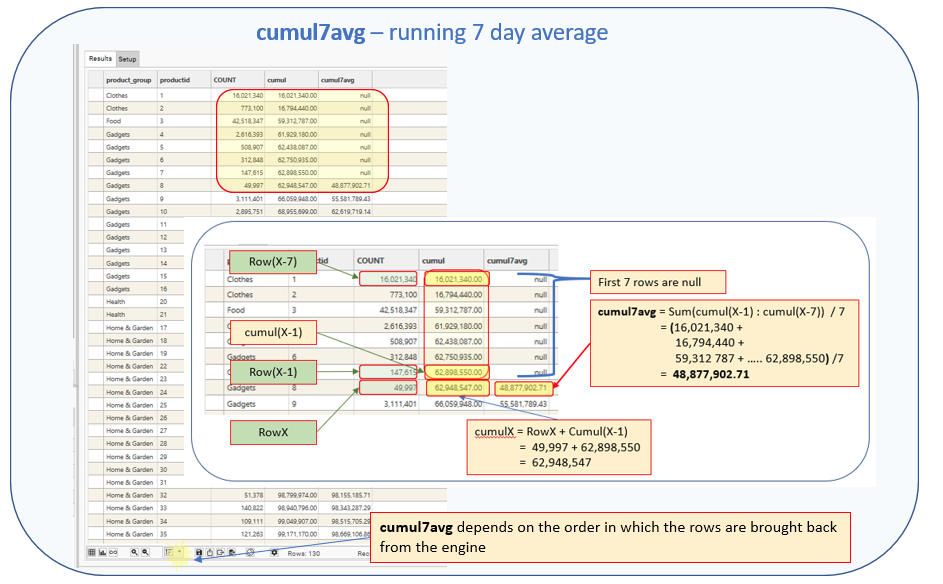
Successively adds the current row to the previous row and returns the average of the previous seven rows.
The first 7 rows will return NULL
Stage 1: Calculate cumulative running total
Stage 2: Calculate average running total of previous 7 rows
Purpose
Use this function to:
- Calculate Running Total of 7 day average
Calculation
cumul7avg = sum[cumul(X-1):cumul(X-7)] / 7
Sum[Cumul(x-1):Cumul(X-7)] = sum of previous 7 rows
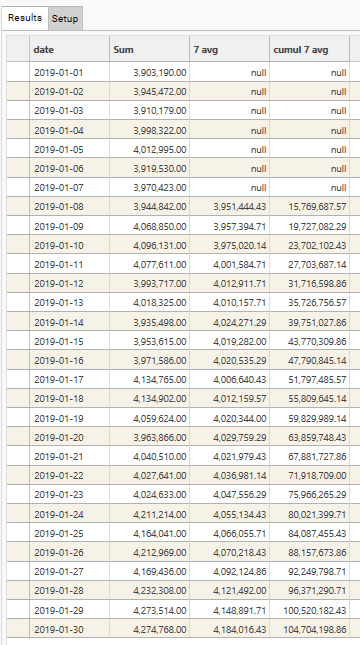
Sample Result

Parameters
| Parameter | Description |
|---|---|
| Dimensions | Discrete field(s). All fields must come from the same table. |
| Name | Name to be displayed as Column Header in result grid |
| Measure | The field to be used in the post-function calculation.
|
| Function | COUNT / SUM / AVG / MIN / MAX / STDEV |
| Post | cumul7avg |
| Value | Optional. Filter to apply when evaluating FUNCTION. Only records in the Filter Recordset will be included in the Function and Post-Function calculations. Must come from same table as DIMENSION/MEASURE or be linked to the Dimension table. |
| Axis | 0 / 1. Y-Axis to use when plotting graph. Default = 0 |
| Plot | Y / N. Specifies whether measure’s output column should be plotted on graph. Default = Y |
| Resolve | Optional. Resolve level for the measure. If blank, Resolve = Dimension Table |
| Series Type | Default / Bar / Stacked Bar / Line / Spline / RangeLow / RangeHigh / CSLow / CSHigh / CSOpen / CSClose Determines the graph style for the measure. |
| Popup | Default / None / Extended |
| Prefix | $ / £ / E / % |
Usage Notes
This post-function is 1-dimensional and does not reset at any point in the calculation. It can be used with multiple dimensions, but successively adds each row, regardless of the number of dimensions
The order in which the data rows are returned affects the calculation - be sure to check the Ascending/Descending Label/Value property of the profile.
Example
- Example use: Average of last 7 rows running total
NOTE: Measures 1 and 2 are included purely for illustration. It is not necessary to include these measures for the calculation to work.
2 dimensions are included in this illustration, but the function does not reset when dimension 1 changes
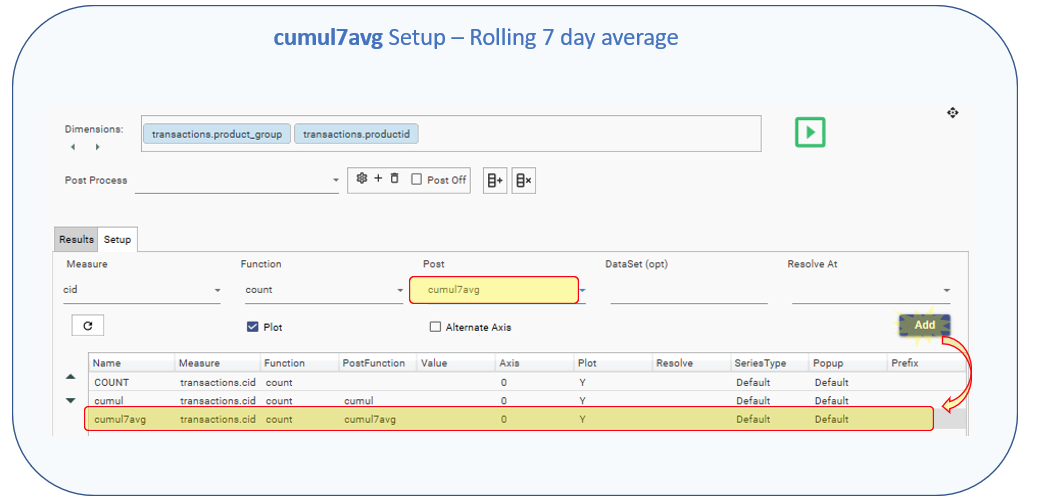
Dimension:[transactions].[product_group], [transactions].[productid]
Measure 1
- Name: = Count
- Measure: = transactions.cid
- Function: =Count
- Post: =
- Value: =
- Axis: =0
- Plot:=Y
- Resolve:=
- Series Type:=Default
- Popup:=Default
- Prefix:=
Measure 2
- Name: = Cumul
- Measure: = transactions.cid
- Function: =Count
- Post: =cumul
- Value: =
- Axis: =0
- Plot:=Y
- Resolve:=
- Series Type:=Default
- Popup:=Default
- Prefix:=
Measure 3
- Name: = cumul7avg
- Measure: = transactions.cid
- Function: =Count
- Post: =cumul7avg
- Value: =
- Axis: =0
- Plot:=Y
- Resolve:=
- Series Type:=Default
- Popup:=Default
- Prefix:=
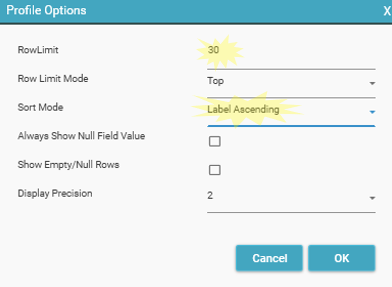
Options; Row Count = 30
Sort Order: [Ascending Label]


