Post Function: [delta]
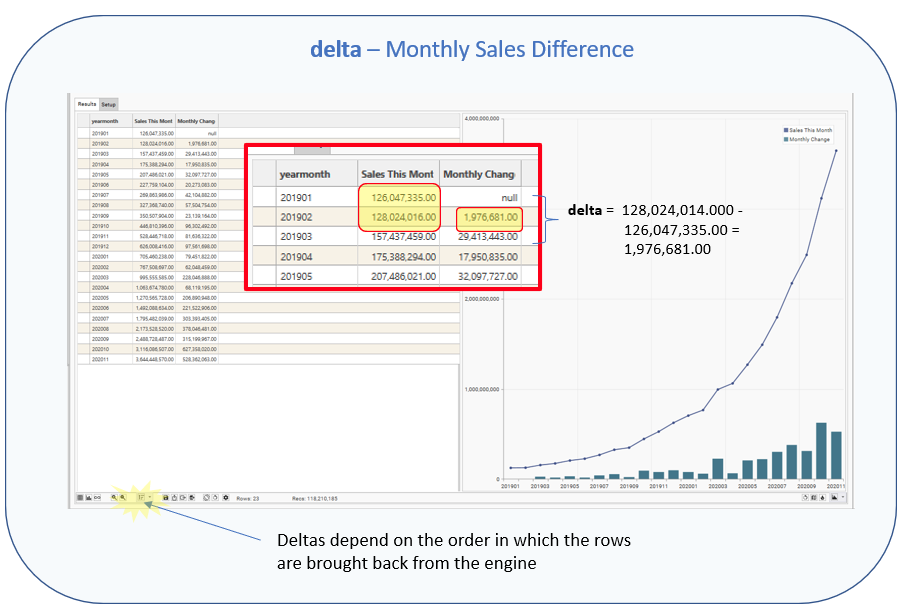
Returns the difference between RowX and Row(X-1) for the specified measure
i.e., Subtracts the previous row from the current row.
First row is NULL
Purpose
Use this function to:
- See how a measure changes from one row to the next
- Calculate changes from one reporting period to the next
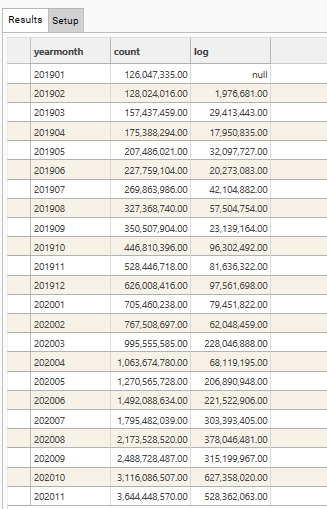
Calculation
delta = Row(X) - Row(X-1)

Row(X) = value for current row
Row(X-1) = value for previous row
delta= Row(X) - Row(X-1)
Sample Result
Parameters
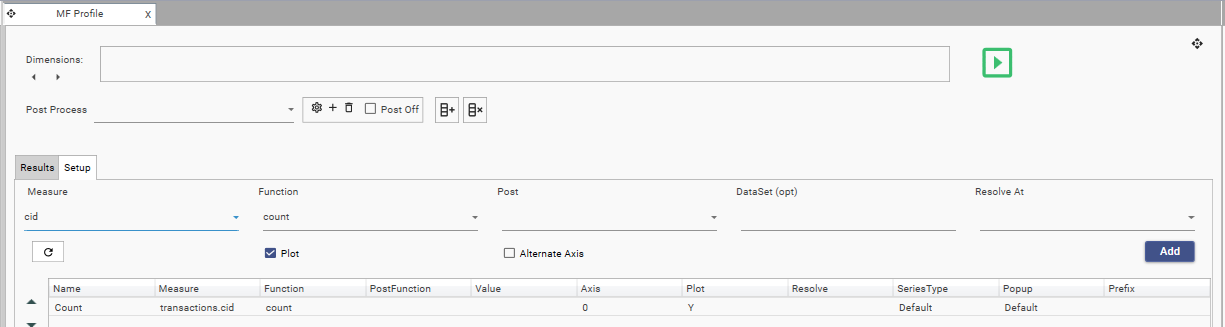
Component | Description |
Dimensions | Discrete field(s). All fields must come from the same table. |
Name | Name to be displayed as Column Header in result grid |
Measure | The field to be used in the post-function calculation. Must be numeric if Function is anything other than COUNT. Must come from same table as DIMENSIONS. Supports Discrete or Continuous DataTypes. |
Function | COUNT / SUM / AVG / MIN / MAX / STDEV |
Post | delta |
Value | Optional. Filter to apply when evaluating FUNCTION. Only records in the Filter Recordset will be included in the Function and Post-Function calculations. Must come from same table as DIMENSION/MEASURE or be linked to the Dimension table. |
Axis | 0 / 1. Y-Axis to use when plotting graph. Default = 0 |
Plot | Y / N. Specifies whether measure’s output column should be plotted on graph. Default = Y |
Resolve | Optional. Resolve level for the measure. If blank, Resolve = Dimension Table |
Series Type | Default / Bar / Stacked Bar / Line / Spline / RangeLow / RangeHigh / CSLow / CSHigh / CSOpen / CSClose Determines the graph style for the measure. |
Popup | Default / None / Extended |
Prefix | $ / £ / E / % |
Usage Notes
To return the first row as 0.00 use the zdelta function instead.
Can be used with multiple dimensions as calculates difference between each row.
If more than one dimension is used, the order in which the dimensions are specified is important as this will affect the inter-row calculations.
The sort order of the data will also affect the calculation. Sort by Label or Value, Ascending or Descending.
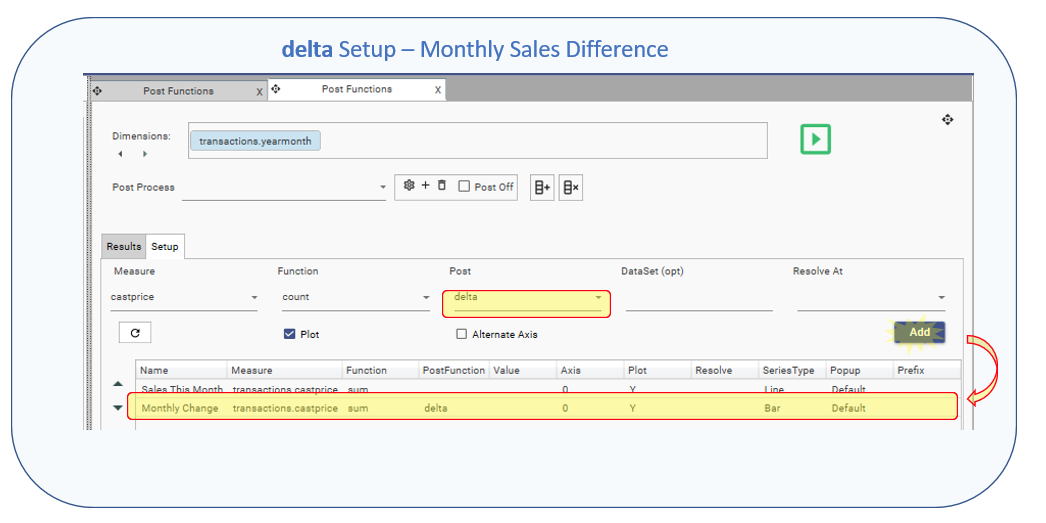
Example
Dimension(s): | [transactions].[yearmonth] | |
Measure 1 |
|
|
Measure 2 |
|
|
Example use: Calculate difference in sales from one month to the next