Adds the current row to the previous row and displays it as a percentage of the overall cumulative total
Purpose
Use this function to:
- Add a percentage from one period to the percentage of another period.
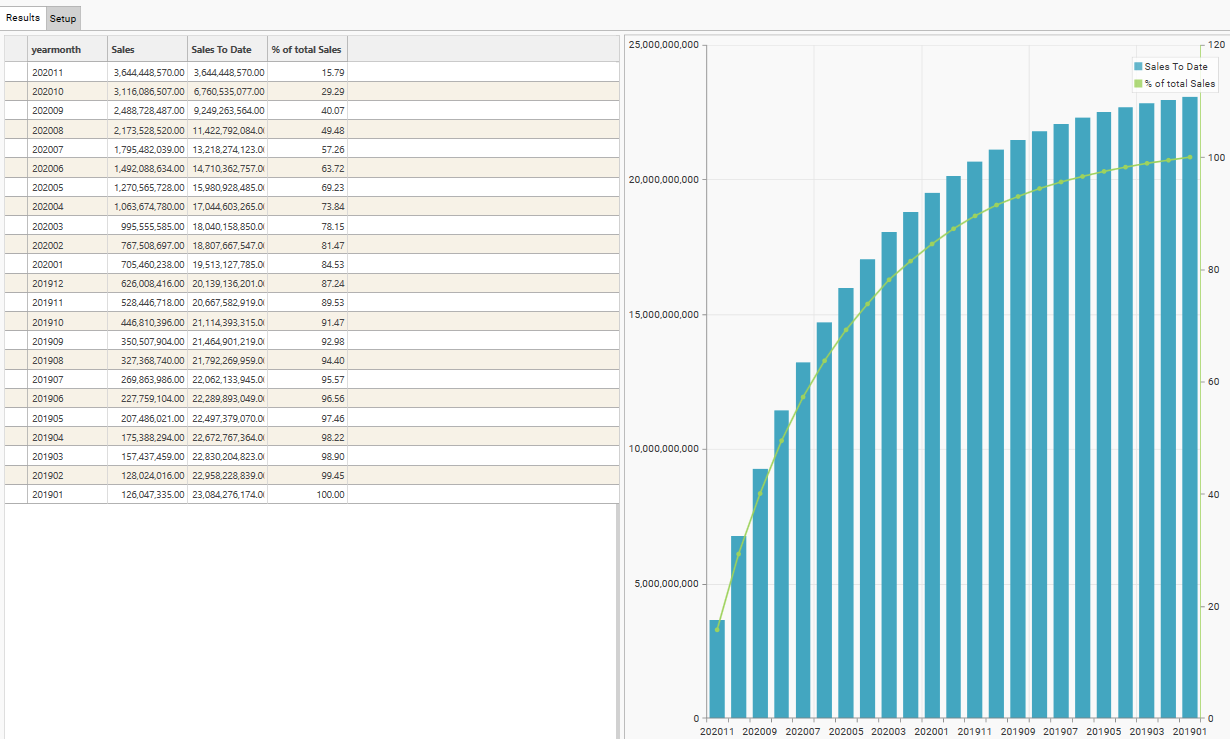
- Create Pareto charts
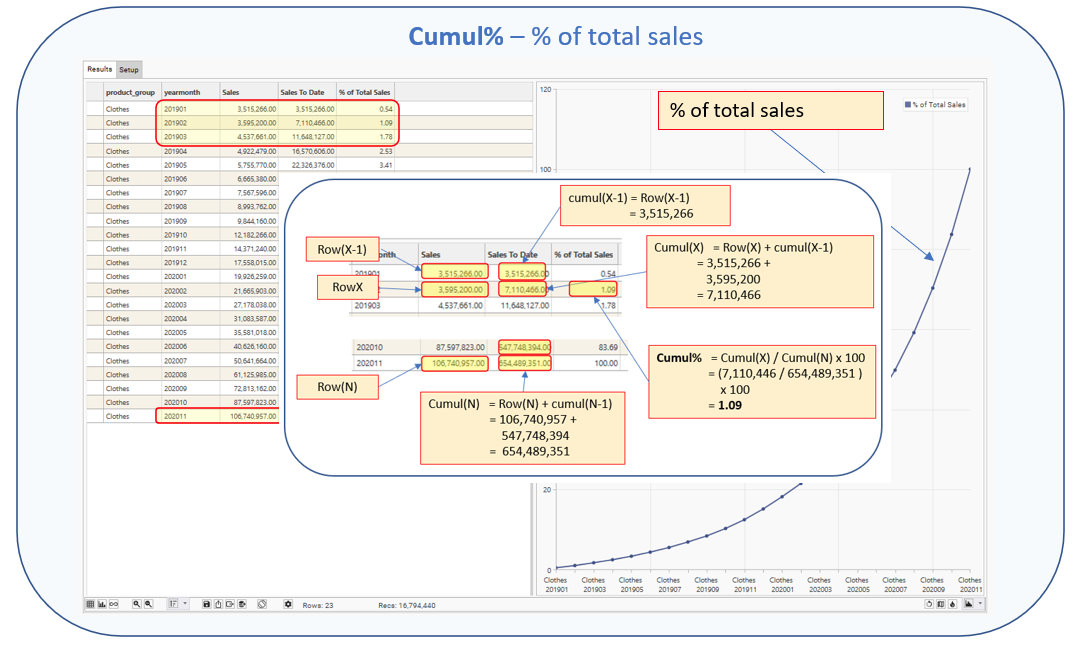
Calculation
cumul%= ( cumul(RowX) / cumul(N) ) * 100
RowX = value for current row
cumul(RowX) = sum of RowX and all previous rows
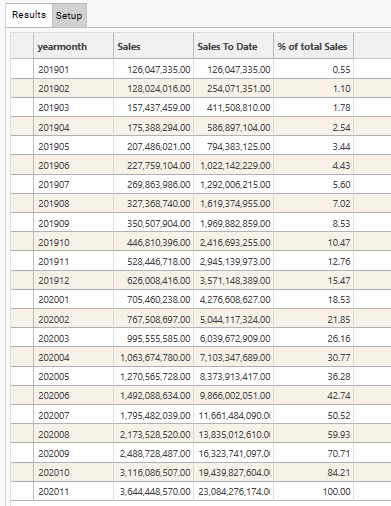
cumul(N) = sum of all rows in resultsetSample Result
Parameters
| Parameters | Description |
|---|---|
| Dimensions | Discrete field(s). All fields must come from the same table. |
| Name | Name to be displayed as Column Header in result grid |
| Measure | The field to be used in the post-function calculation.
|
| Function | COUNT / SUM / AVG / MIN / MAX / STDEV |
| Post | cumul% |
| Value | Optional. Filter to apply when evaluating FUNCTION. Only records in the Filter Recordset will be included in the Function and Post-Function calculations. Must come from same table as DIMENSION/MEASURE or be linked to the Dimension table. |
| Axis | 0 / 1. Y-Axis to use when plotting graph. Default = 0 |
| Plot | Y / N. Specifies whether measure’s output column should be plotted on graph. Default = Y |
| Resolve | Optional. Resolve level for the measure. If blank, Resolve = Dimension Table |
| Series Type | Default / Bar / Stacked Bar / Line / Spline / RangeLow / RangeHigh / CSLow / CSHigh / CSOpen / CSClose Determines the graph style for the measure. |
| Popup | Default / None / Extended |
| Prefix | $ / £ / E / % |
Usage Notes
See cumul to calculated sales to date
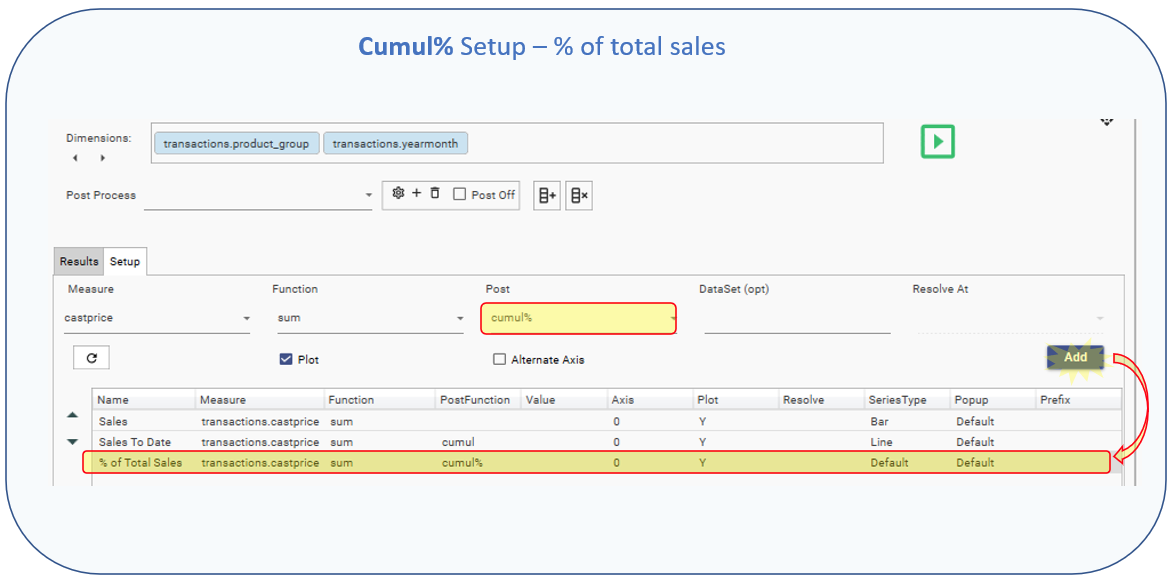
Example
- Example use: Percentage of sales to date
- e.g Show each month’s sales as a percentage of total sales for the period
NOTE: Measures 1 and 2 are included purely for illustration. It is not necessary to include these measures for the calculation to work.
Dimension (s): [transactions].[product_group], [transactions].[yearmonth]
Measure 1
- Name: =Sales
- Measure: = transactions.castprice
- Function: = sum
- Post: =
- Value: =
- Axis: =0
- Plot:=Y
- Resolve:=
- Series Type:= Bar
- Popup:=Default
- Prefix:=
Measure 2
- Name: =Sales To Date
- Measure: = transactions.castprice
- Function: = sum
- Post: = cumul
- Value: =
- Axis: =0
- Plot:=Y
- Resolve:=
- Series Type:= Line
- Popup:=Default
- Prefix:=
Measure 3
- Name: = % of total Sales
- Measure: = transactions.castprice
- Function: = sum
- Post: = cumul%
- Value: =
- Axis: =0
- Plot:=Y
- Resolve:=
- Series Type:= Line
- Popup:=Default
- Prefix:=