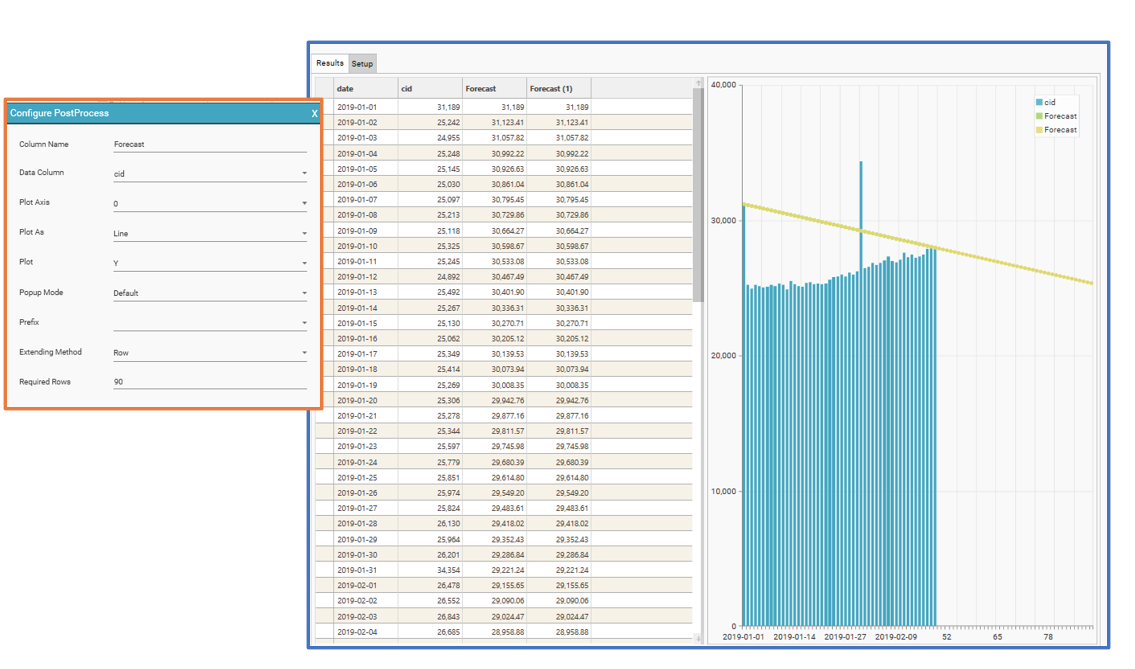
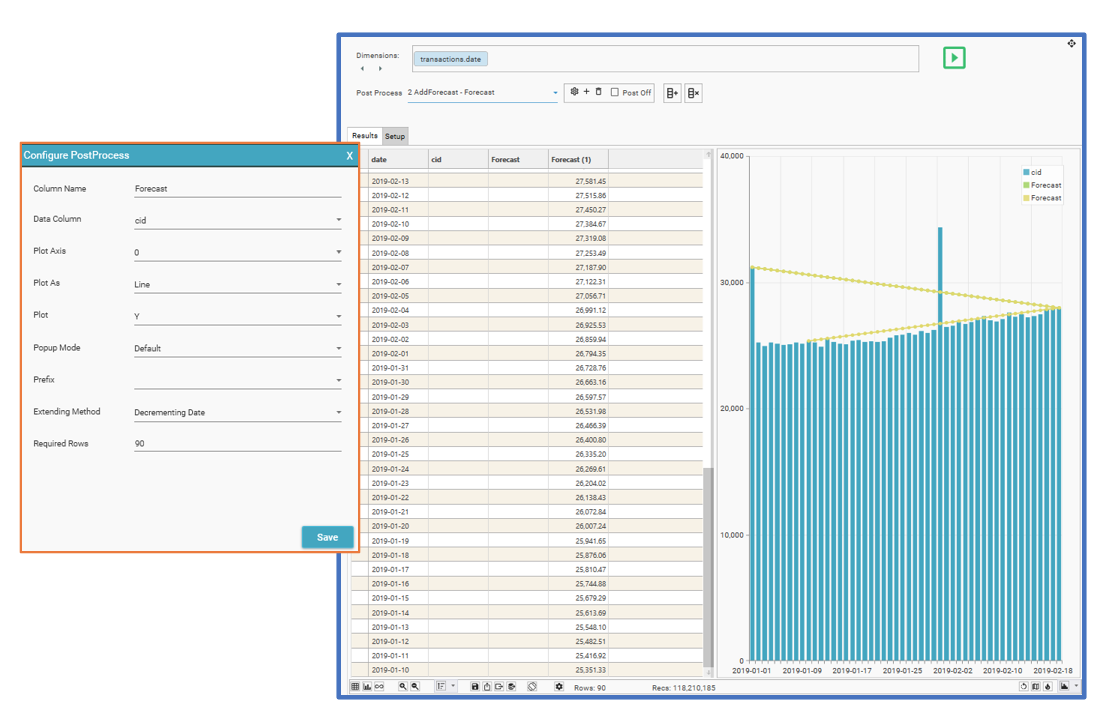
Calculates average for a specified range and extends it out over a specified number of rows
Purpose
Use this function to:
- Calculate a forecast line from an incomplete data set
- Calculate sales forecasts
Parameters
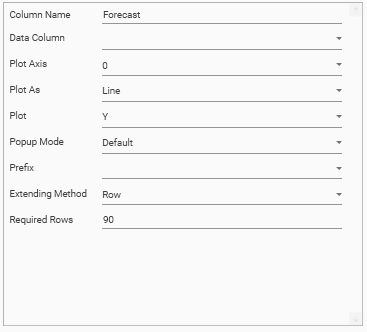
| Parameter | Description |
|---|---|
| Column Name | The name of the output column |
| Data Column | The source column to use when calculating the AddForecast |
| Plot Axis | 0 / 1. Y-Axis to use when plotting graph. Default = 0 |
| Plot As | Bar / Stacked Bar / Line / Spline / RangeLow / RangeHigh / CSLow / CSHigh / CSOpen / CSClose Determines the graph style for the output column. |
| Plot | Y / N. Specifies whether measure’s output column should be plotted on graph. Default = Y |
| Popup Mode | Default / None / Extended |
| Prefix | £ / $ / E / % |
| Extending Method | Required. Determines the method that is used to extend the dimension column i.e., the X Axis for the resulting graph
|
| Required Rows | Required. Default = 90. |
Examples
Decrementing Date
Row