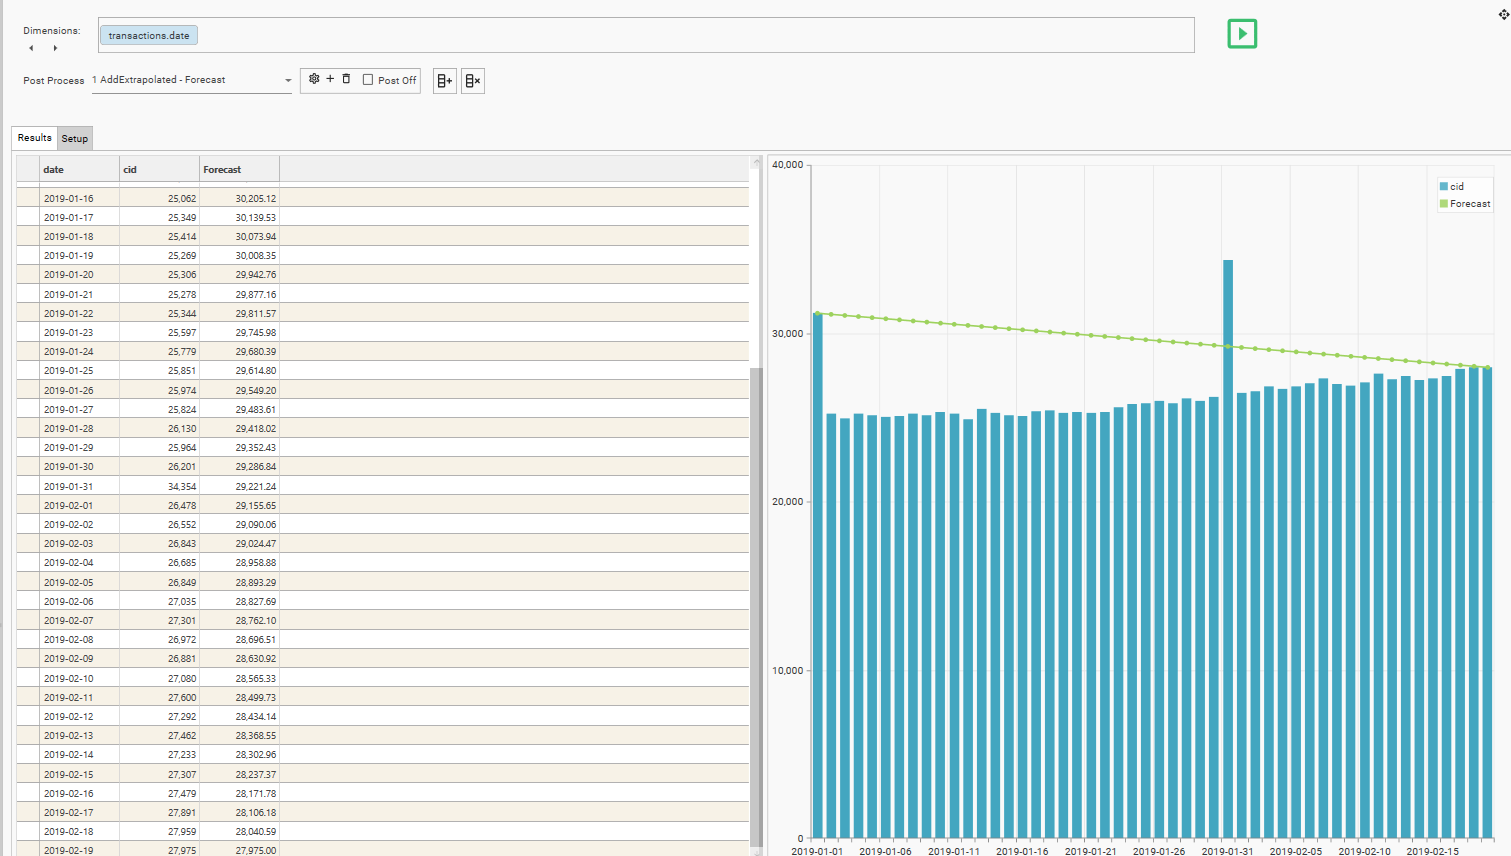
Creates a set of values with a consistent gradient between the first and last row of the specified column
Purpose
Use this function to:
- Create a straight line between start and end points in a data set
Parameters
| Parameter | Description |
|---|---|
| Column Name | Required. The name of the output column |
| Data Column | Required. The result-set column from which to take the starting and ending value. Can be a column generated by a measure, or the output of a previous Post-Process within the current Multi-Function profile. |
| Plot Axis | 0 / 1. Y-Axis to use when plotting graph. Default = 0 |
| Plot As | Bar / Stacked Bar / Line / Spline / RangeLow / RangeHigh / CSLow / CSHigh / CSOpen / CSClose Determines the graph style for the output column. |
| Plot | Y / N. Specifies whether measure’s output column should be plotted on graph. Default = Y |
| Popup Mode | Default / None / Extended |
| Prefix | £ / $ / E / % |
Examples