NOTE
This article is part of the "Tutorial - Basic Sales Dashboard" series. It assumes the following:
The user is logged in to an active DataJet realm that contains the DJDemo2023 data (or data arranged in a similar structure)
Demo Data (or data in a similar structure) has been loaded into a project and reporting metrics have been created. See Step 4b - Prepare Data for Reporting - Create Reporting Dimensions & Metrics if this has not yet been done.
Approach
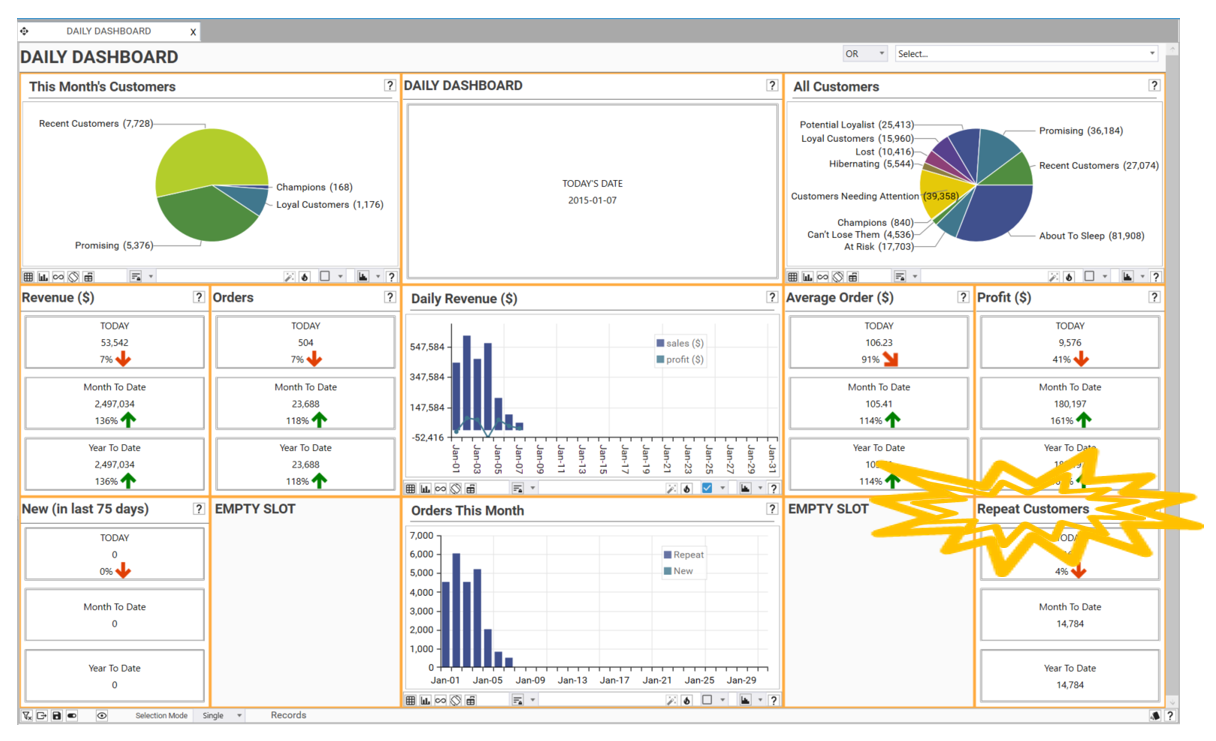
Often dashboards will be used to display summary metrics - for example, the total revenue for a period, or the total number of orders. This section introduces summary metrics and shows how to create them using panel forms. The TODAY, “Month To Date” and “Year To Date” metrics on the dashboard are all created using this technique
At the end of this step, you will know how to:
Create a Panel Form Report
Add summary metrics to Dashboards
Key Techniques
The following functional areas are introduced by this step:
Summary Metrics
Gauges/Visual Indicators
Video Tutorial
Creating Reports - Panel Forms
REPORT: Reporting Date
The reporting date for the daily dashboard is assumed to be the most recent shipment date in the sales table. This is the value we extracted in the [sales.TODAY] field earlier (i.e., the 7th Jan 2015). This information in displayed in the dashboard using the following approach:
Create a panel form of max(sales.TODAY)
Video Tutorial
Create Report
To create Reporting Date:
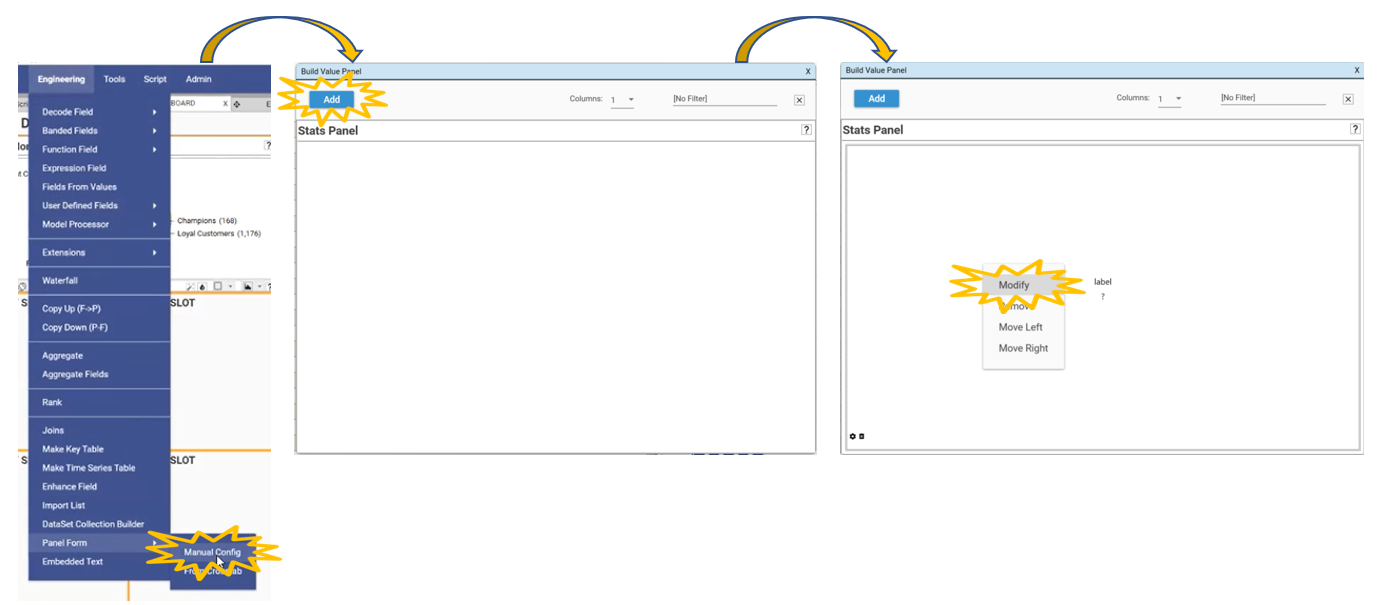
Go to Engineering | Panel Form | Manual Config. The Build Value Panel Dialog will appear.
Select Add to add a panel
Right-click in the added Stats Panel and select Modify. The Panel Tile Settings Dialog will appear.
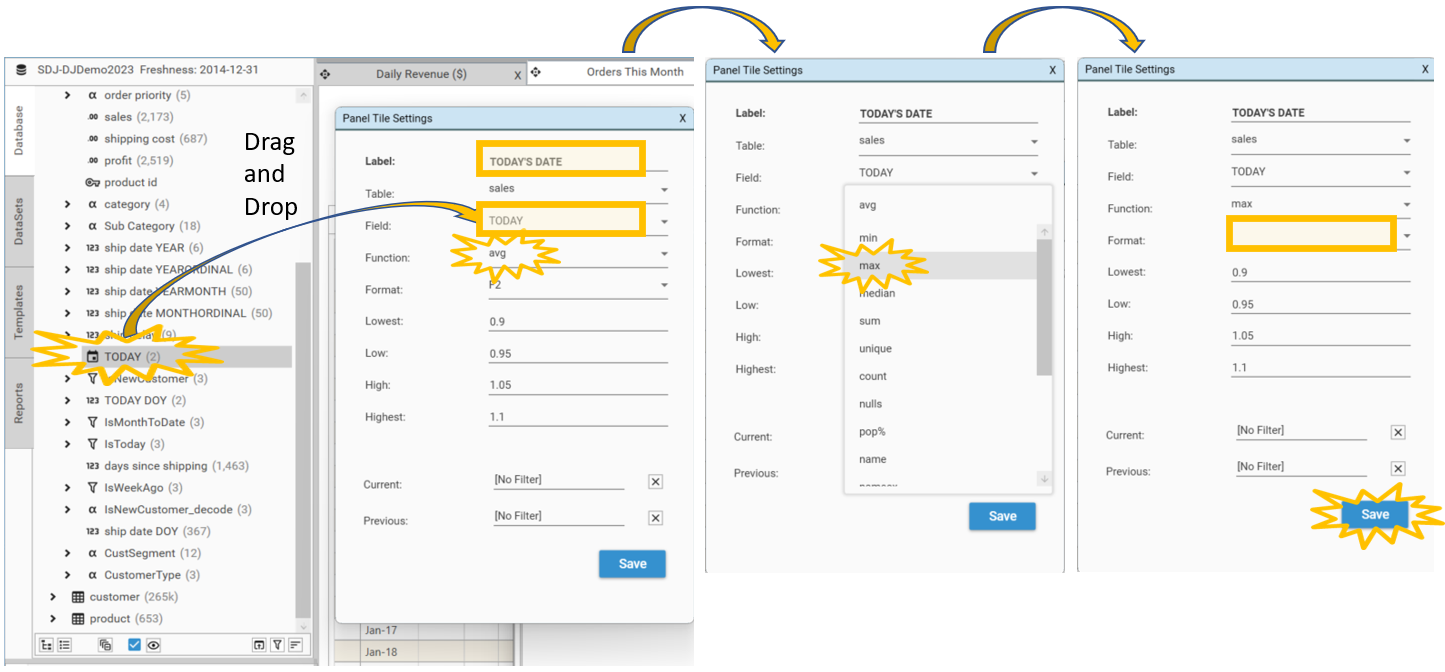
To create the Reporting Date with today’s date:
Drag and Drop [sales.TODAY] into the Field box
Change the Label to TODAY’S DATE
Change the Function to max
Change the Format to Blank
Select Save
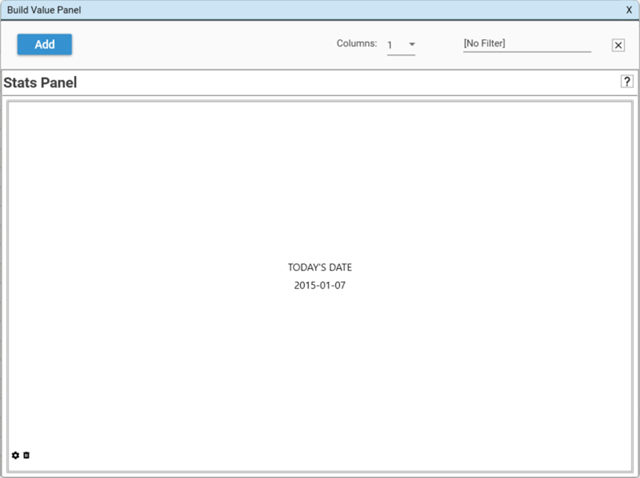
A Stats Panel with TODAY’S DATE - 2015-01-07 will appear.
Add Report to Dashboard
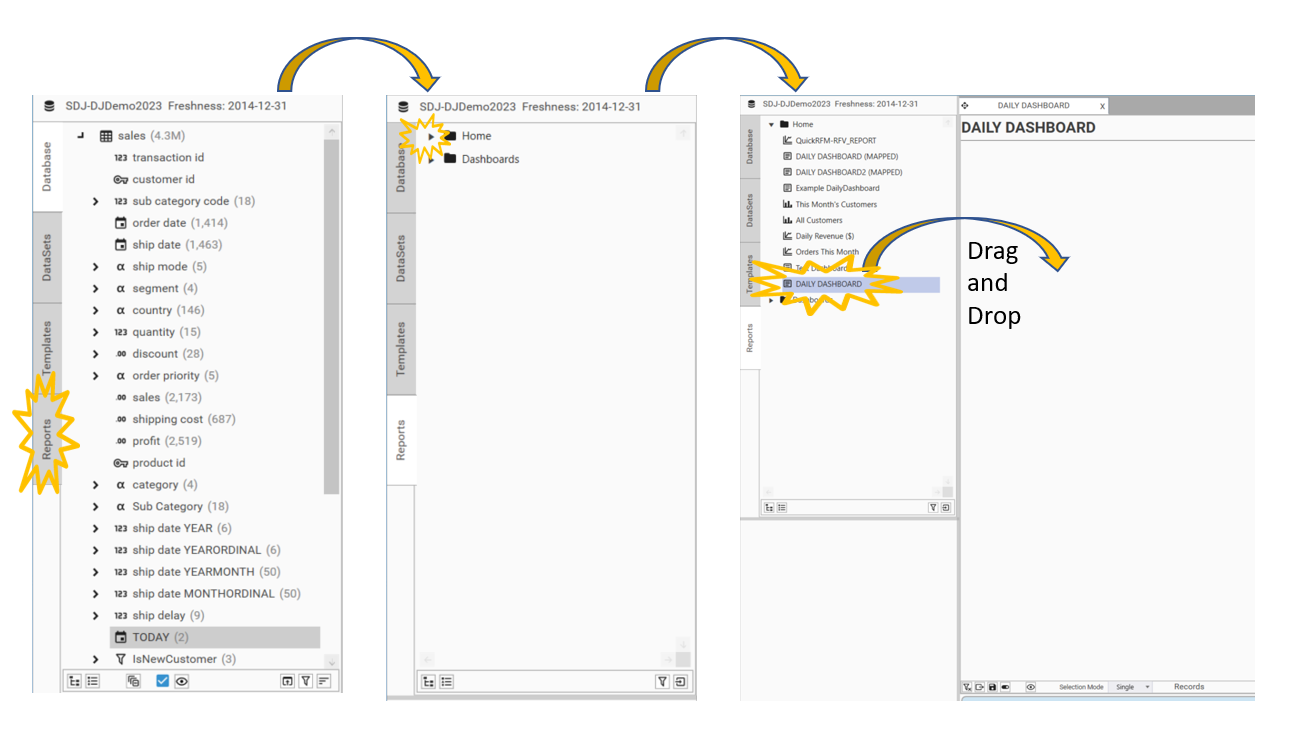
If DAILY SALES DASHBOARD is not open, go to Reports, expand Home and Drag and Drop (or double-click) DAILY DASHBOARD into the workspace.
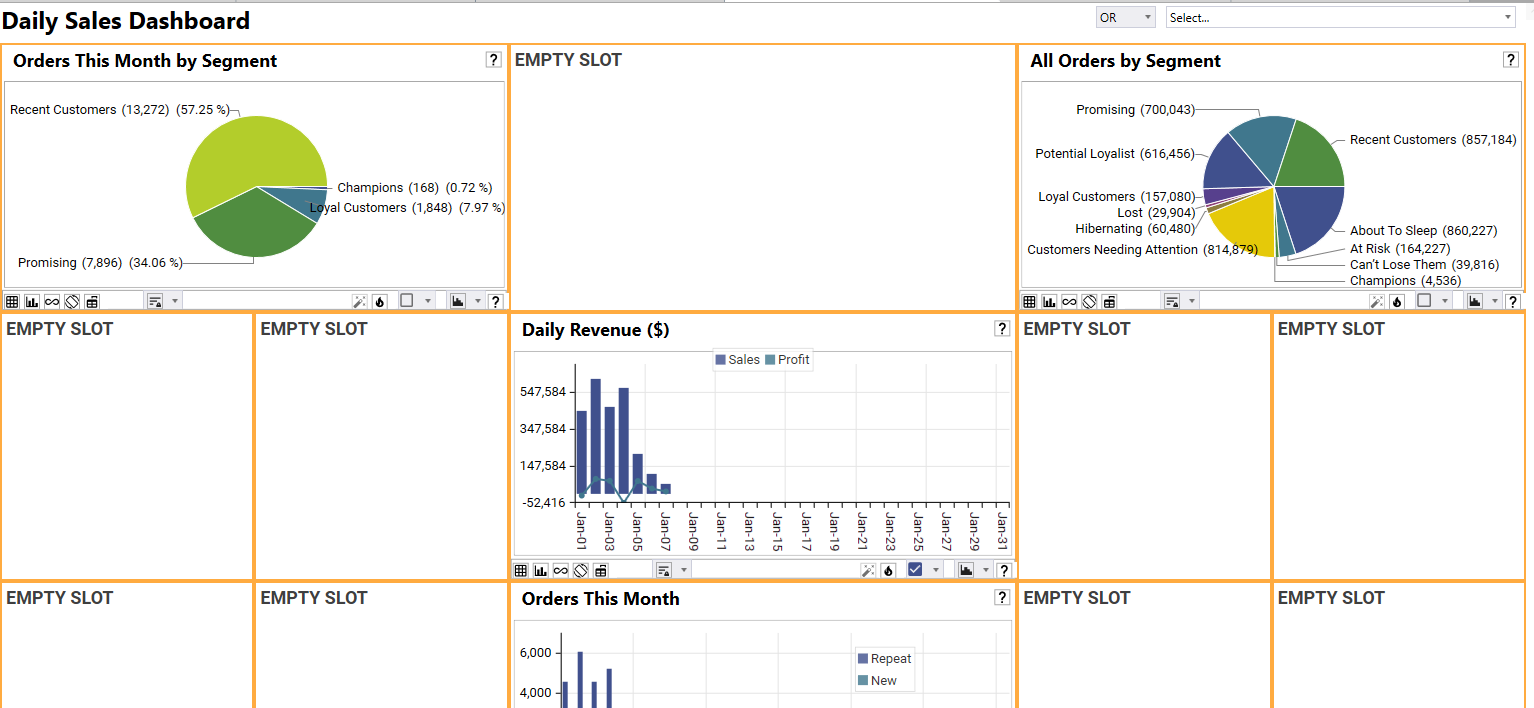
Put the dashboard into design mode.
To do this use the Toggle button, or right-click and choose “design mode”
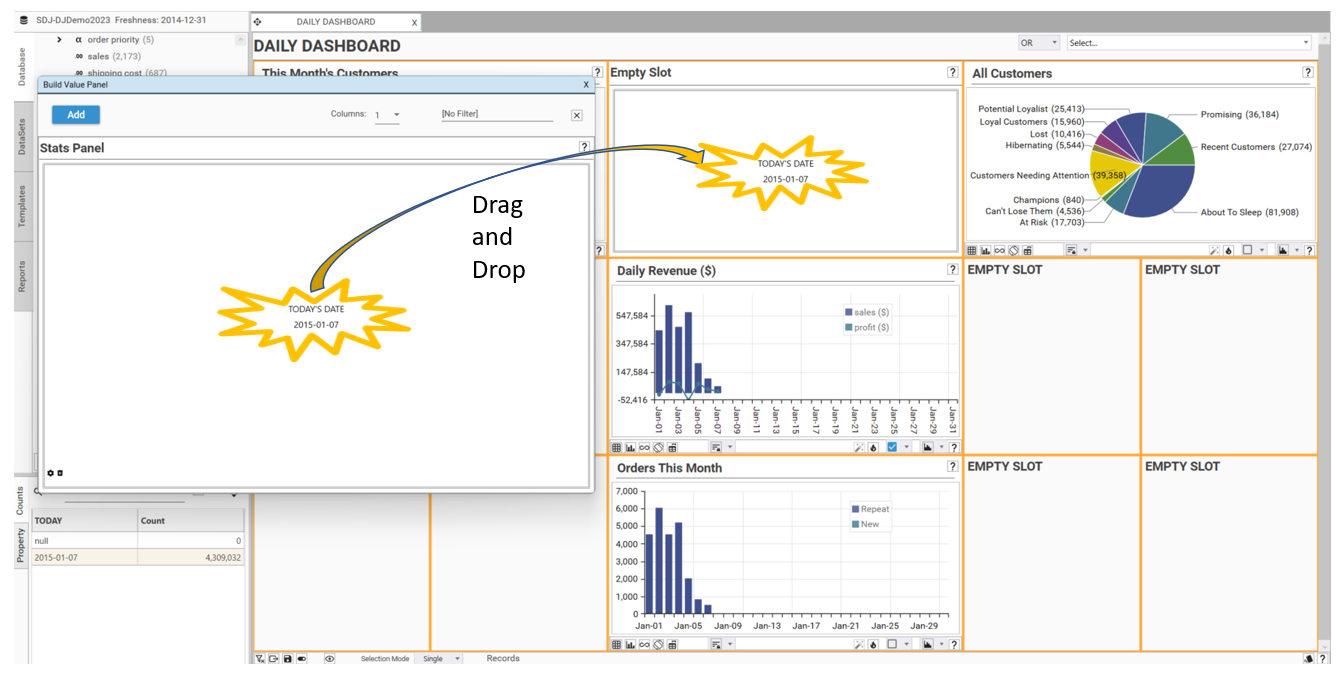
Drag the Stats Panel of TODAY’S DATE from the open panel form dialog drop it into the top central slot on DAILY DASHBOARD.
Rename the slot by double-clicking on the slot header, rename it to REPORTING DATE.
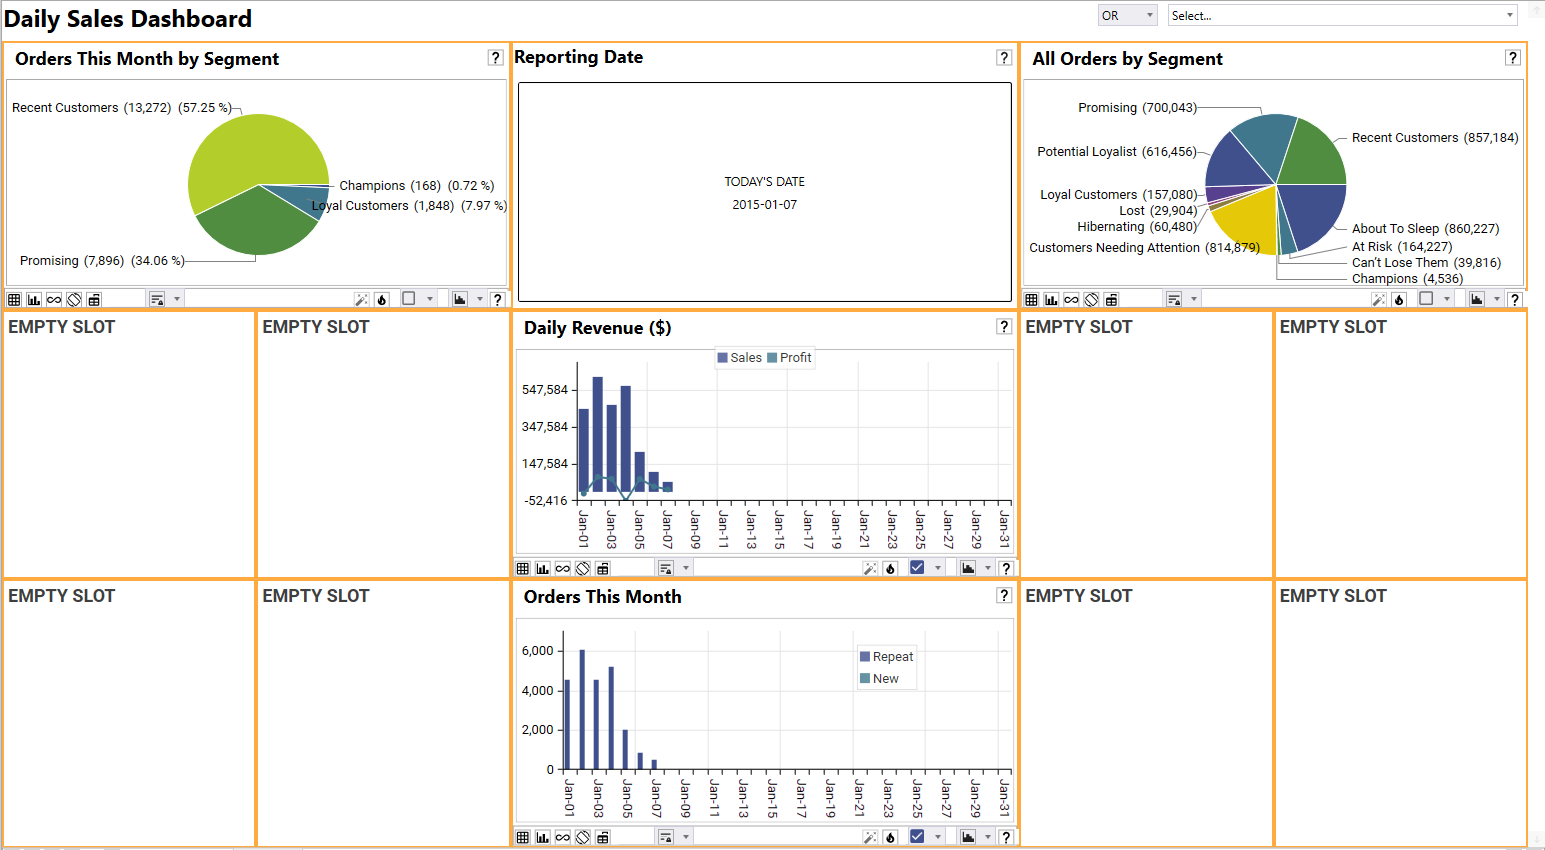
REPORT: Revenue ($)
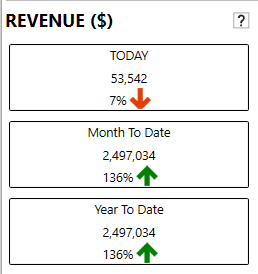
The Revenue ($) slot on the Daily Sales Dashboard contains the following metrics:
TODAY: Revenue for today, as well as percentage comparison to revenue from a week ago
Month To Date: Revenue for the current month to date, as well as percentage comparison to the same point in the month a year ago
Year To Date: Revenue for the year to date, as well as percentage comparison to the same date in the previous year
Video Tutorial
Create Revenue Report
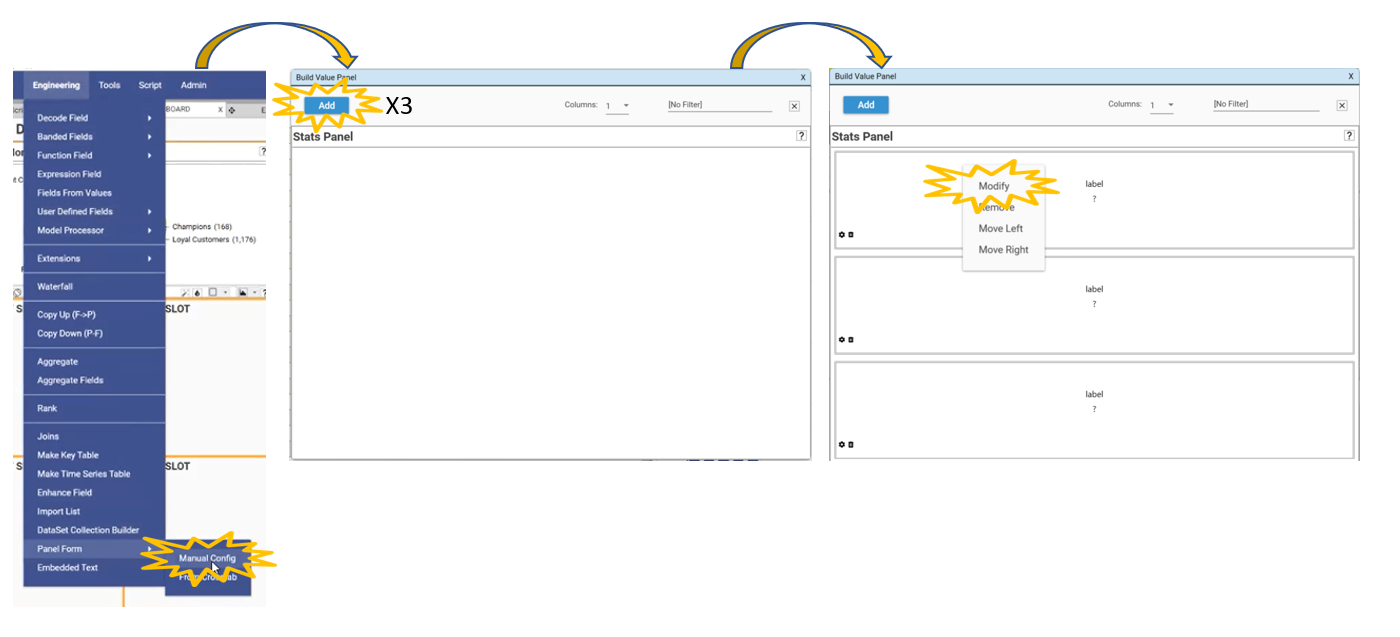
Create a Panel Form from Engineering | Panel Form | Manual Config. The Build Value Panel Dialog will appear.
Select Add three times to create three panels.
TODAY
To create the Revenue ($) for TODAY:
Right-click in the top panel and select Modify. The Panel Tile Settings Dialog will appear.
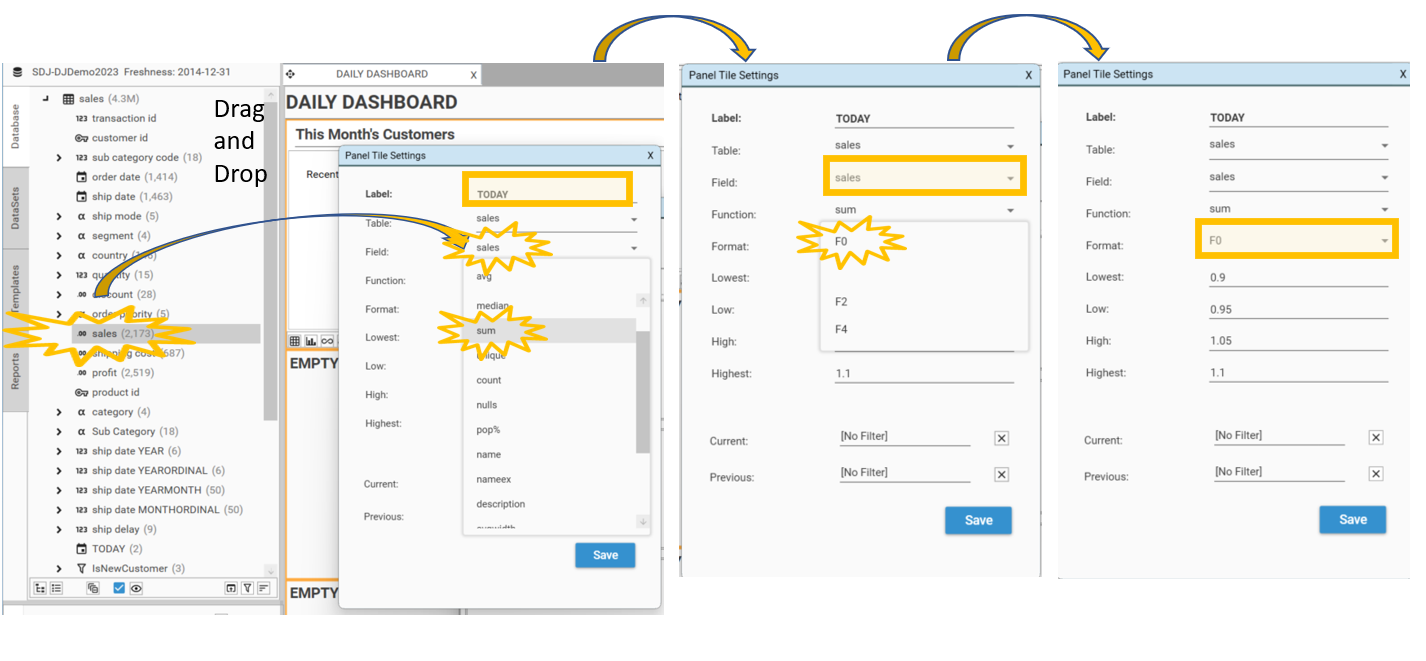
Drag and Drop sales.sales into the Field box
Change the Label to TODAY
Change the Function to sum
Change the Format to F0 (F0 is shorthand for “format 0”, where 0 is the number of decimal places. Use F0 for integers.)
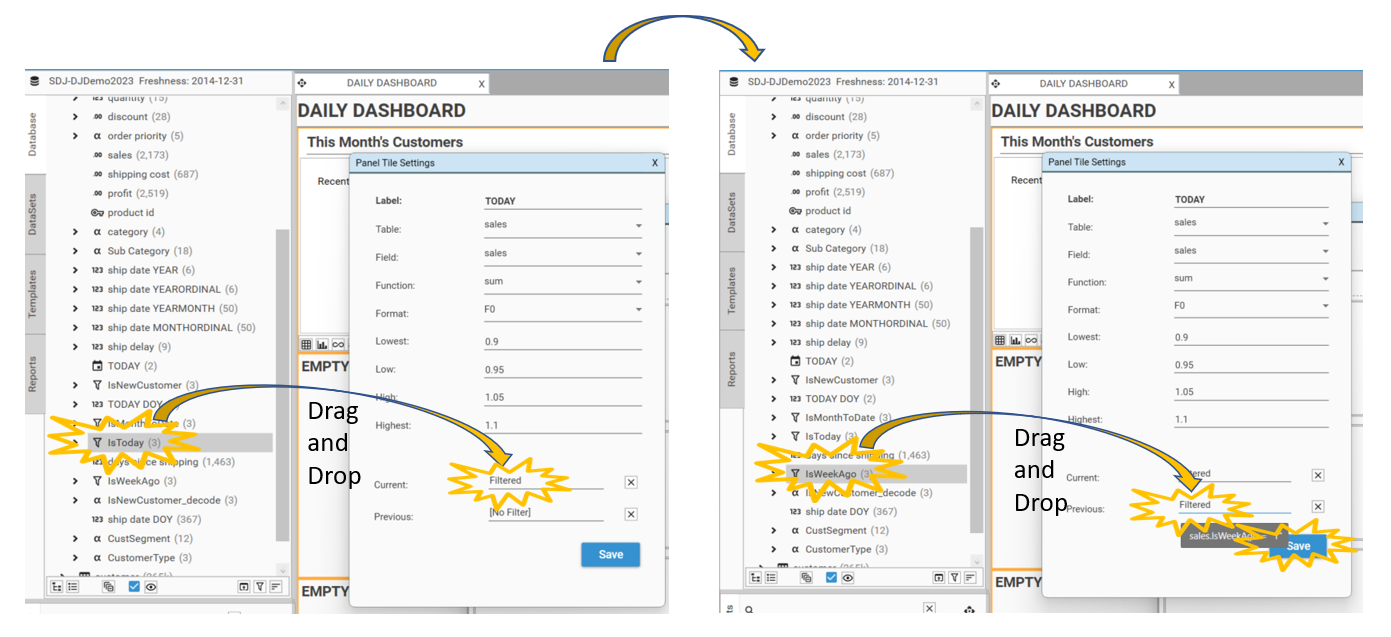
Add filters. This will calculate Sum(sales.sales) for both filters and show sales for the current filter as a percentage of sales for the previous filter. This is the general technique used to show trend arrows in panel forms.
Drag and Drop sales.IsToday into the Current box
Drag and Drop sales.IsWeekAgo into the Previous box
Select Save
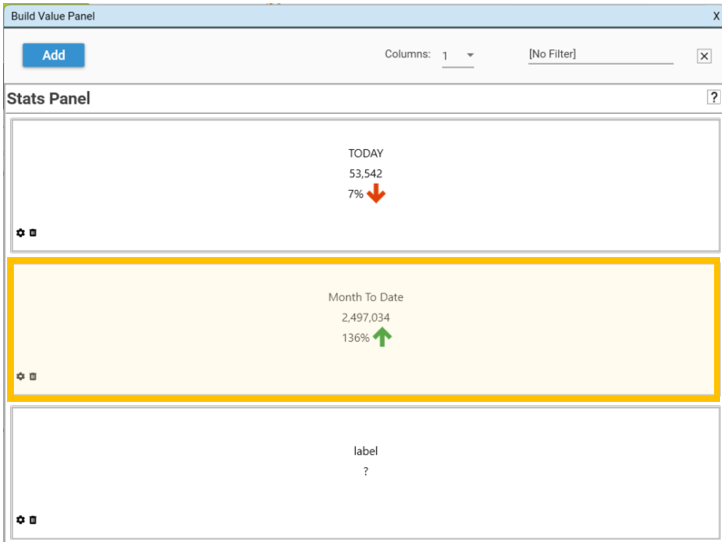
The TODAY panel will appear. This shows the number of sales today: 53,542 which is 7% of the sales from a week ago. This is a decrease, and so a red down arrow is displayed.
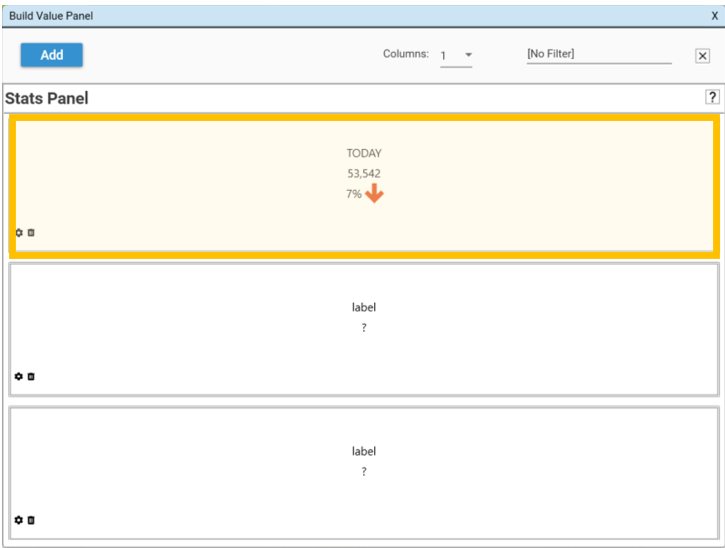
Month To Date
Right-click in the middle panel and select Modify. The Panel Tile Settings Dialog will appear.
To create the Revenue ($) for Month To Date:
Drag and Drop sales.sales into the Field box
Change the Label to Month To Date
Change the Function to sum
Change the Format to F0 (this is how many decimal places so this will be an integer)
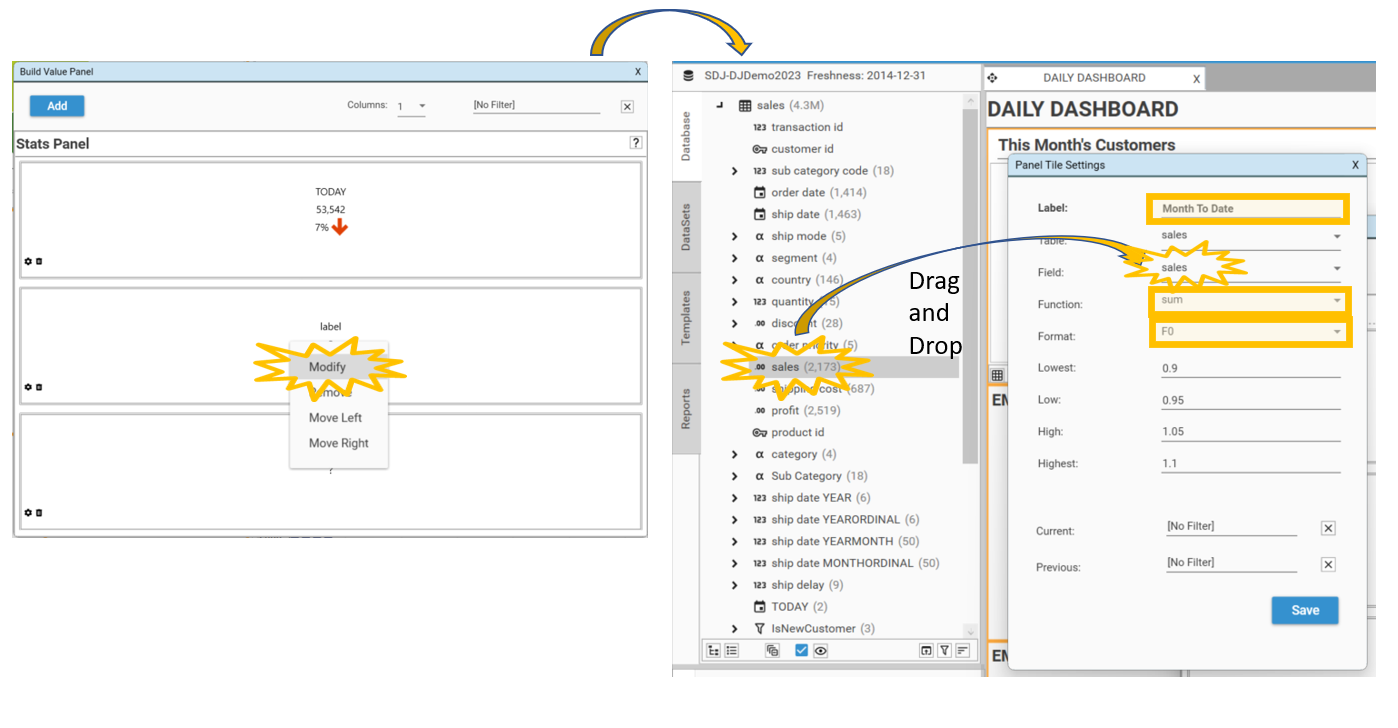
Add filters:
Drag and Drop ship date MONTHORDINAL 1 into the Current box
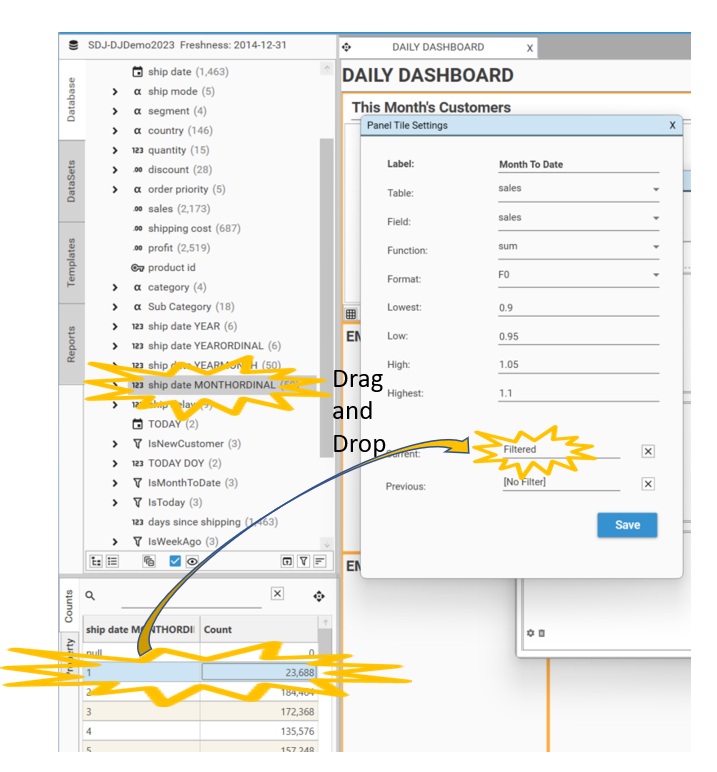
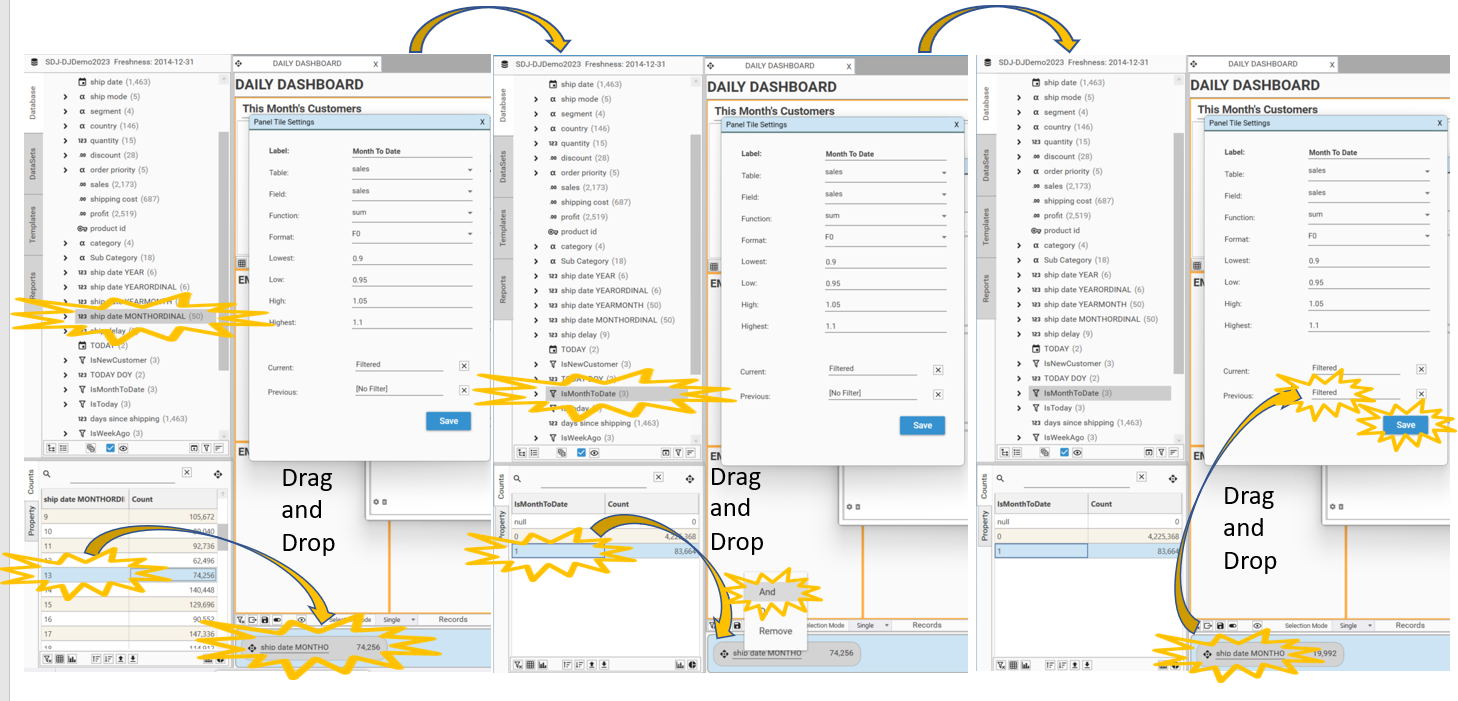
Create a new filter using the Hotbar:
Drag and Drop ship date MONTHORDINAL 13 into the Hotbar
Drag and Drop IsMonthToDate 1 on top of ship date MONTHORDINAL 13 in the Hotbar
Drag and Drop this new filter from the Hotbar into the Previous box
Select Save
The Month To Date panel will appear. This shows the number of sales for Month To Date: 2,497,034 which is up 136%.
Year To Date
Right-click in the last panel and select Modify. The Panel Tile Settings Dialog will appear.
To create the Revenue ($) for Year To Date:
Drag and Drop sales.sales into the Field box
Change the Label to Year To Date
Change the Function to sum
Change the Format to F0 (this is how many decimal places so this will be an integer)
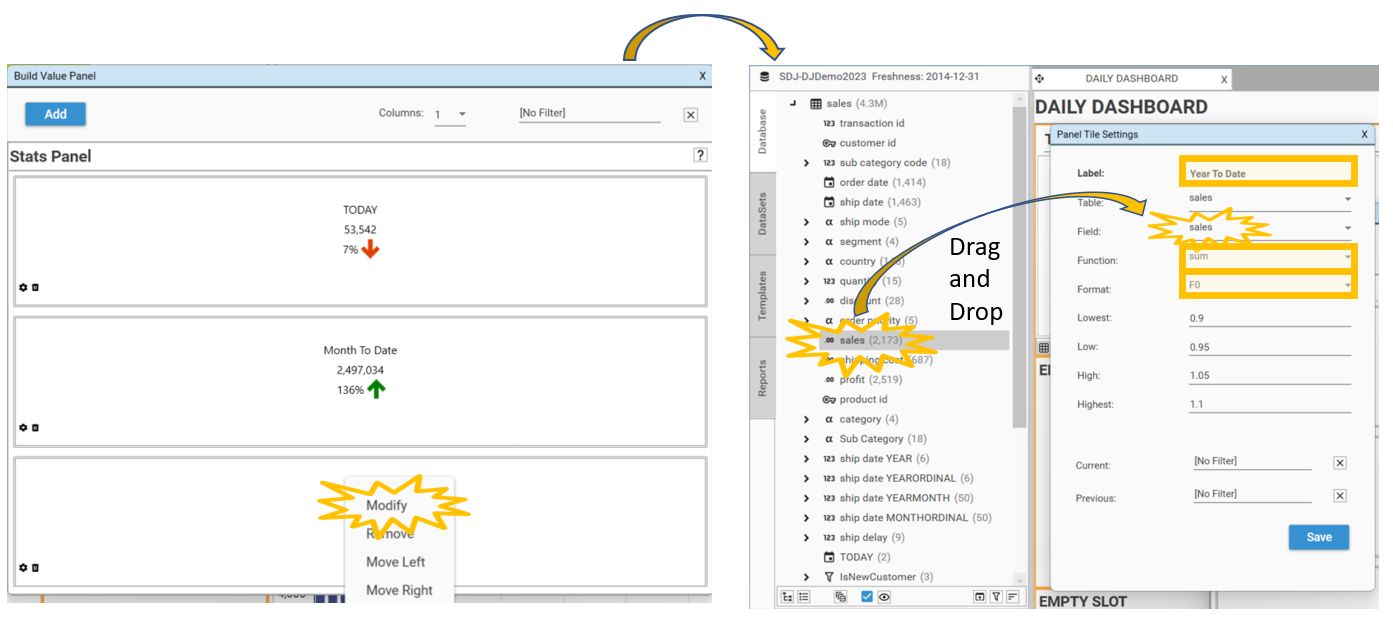
Add filters:
Drag and Drop ship date YEARORDINAL 1 into the Current box
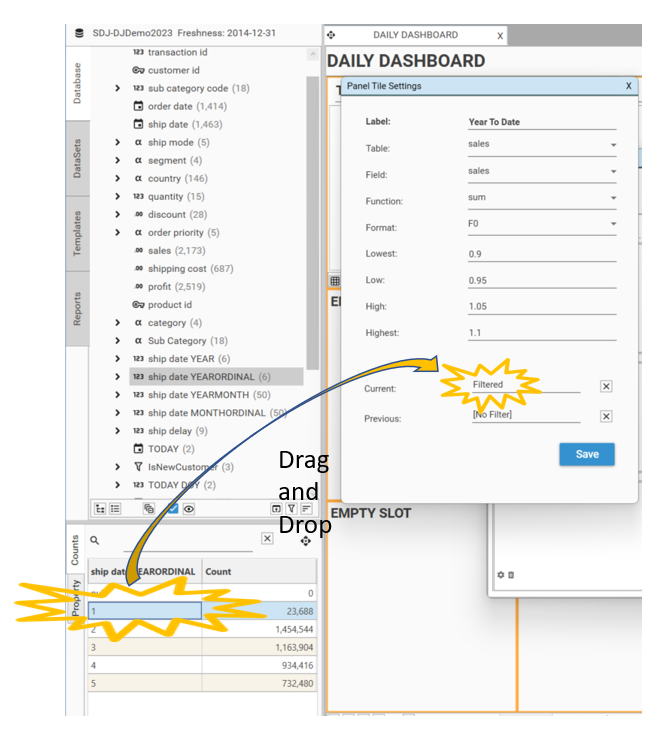
Create a new filter using the Hotbar:
Drag and Drop ship date YEARORDINAL 2 into the Hotbar
Drag and Drop IsMonthToDate 1 on top of ship date YEARORDINAL 2 in the Hotbar
Drag and Drop this new filter from the Hotbar into the Previous box
Select Save
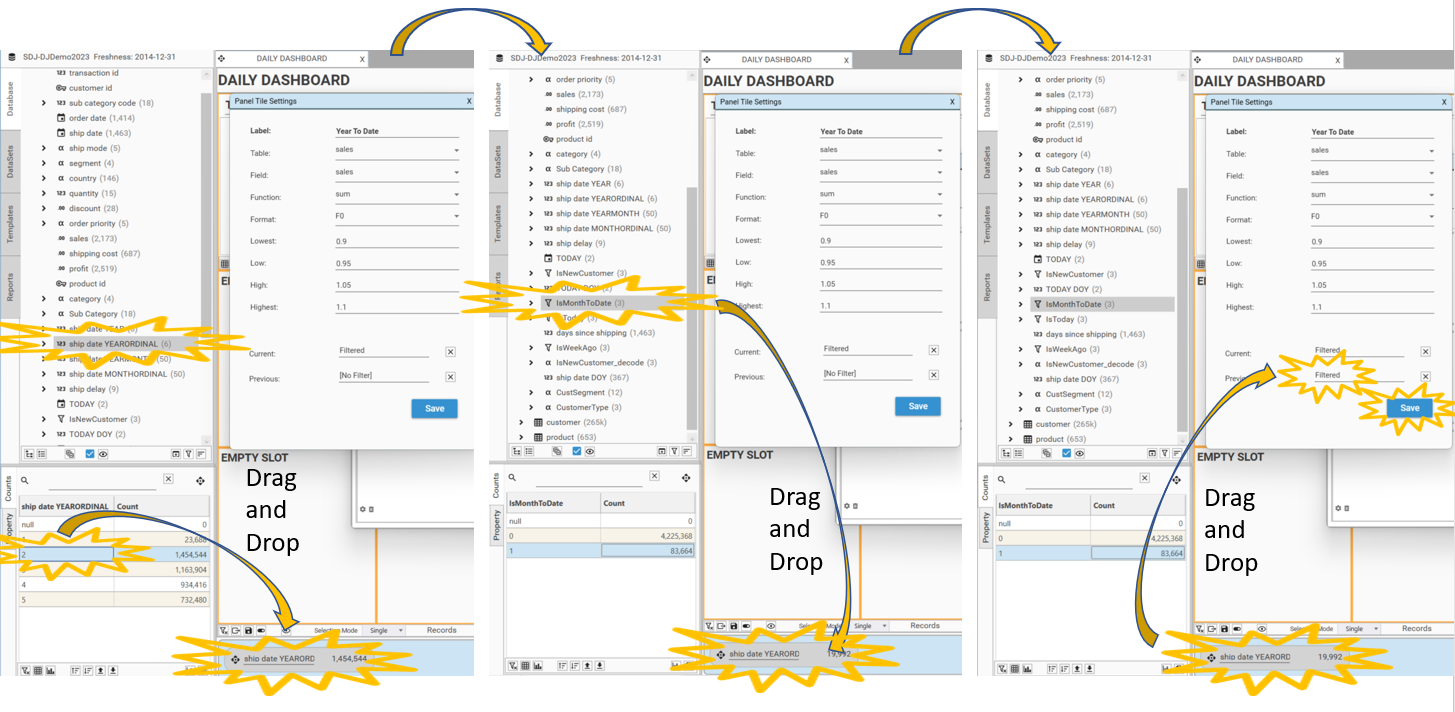
The Year To Date panel will appear. This shows the number of sales for Year To Date: 2,497,034 which is up 136%.
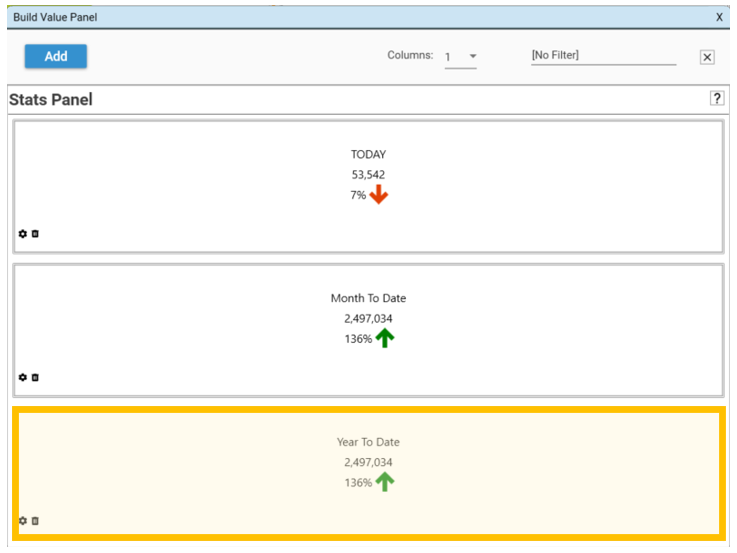
Why are “Month To Date” and “Year To Date” the same?
You may notice that Month To Date and Year To Date are the same, this is because the data in the demo database ends at Jan 7th 2015. This means the current month is January, and so the current Day Of The Year is the same as the Day Of the Current Month.
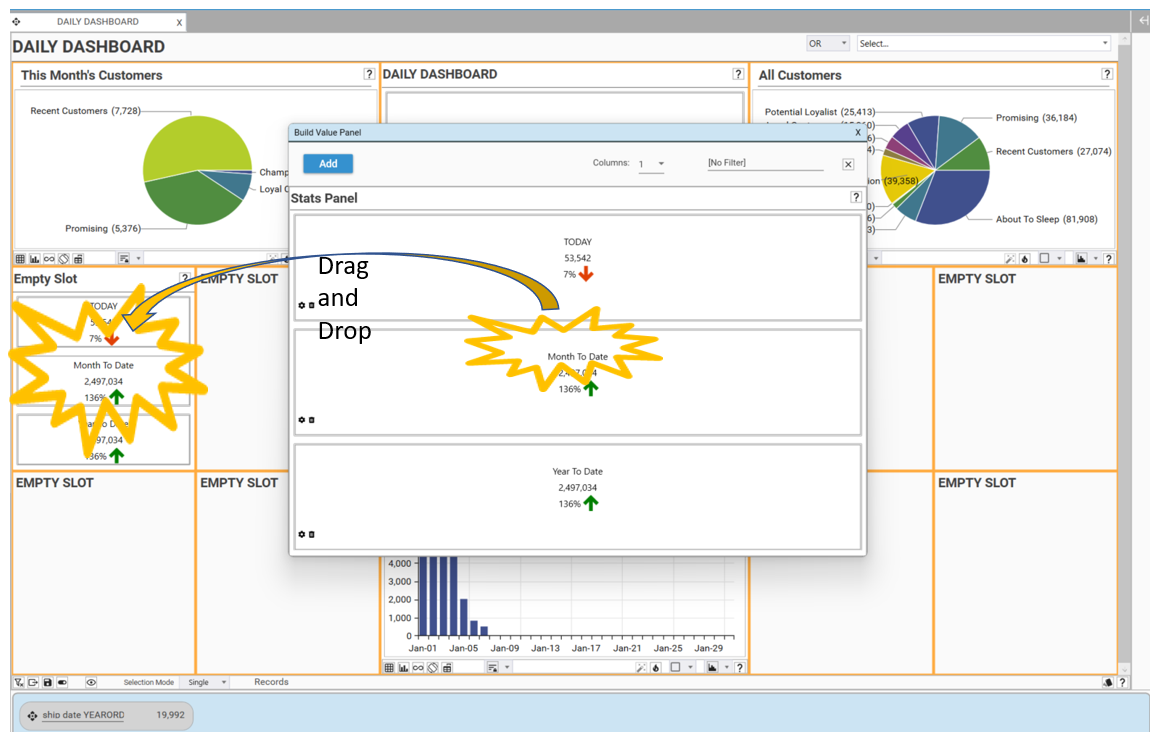
Drag and Drop the Stats Panel into the middle - right slot on DAILY SALES DASHBOARD.
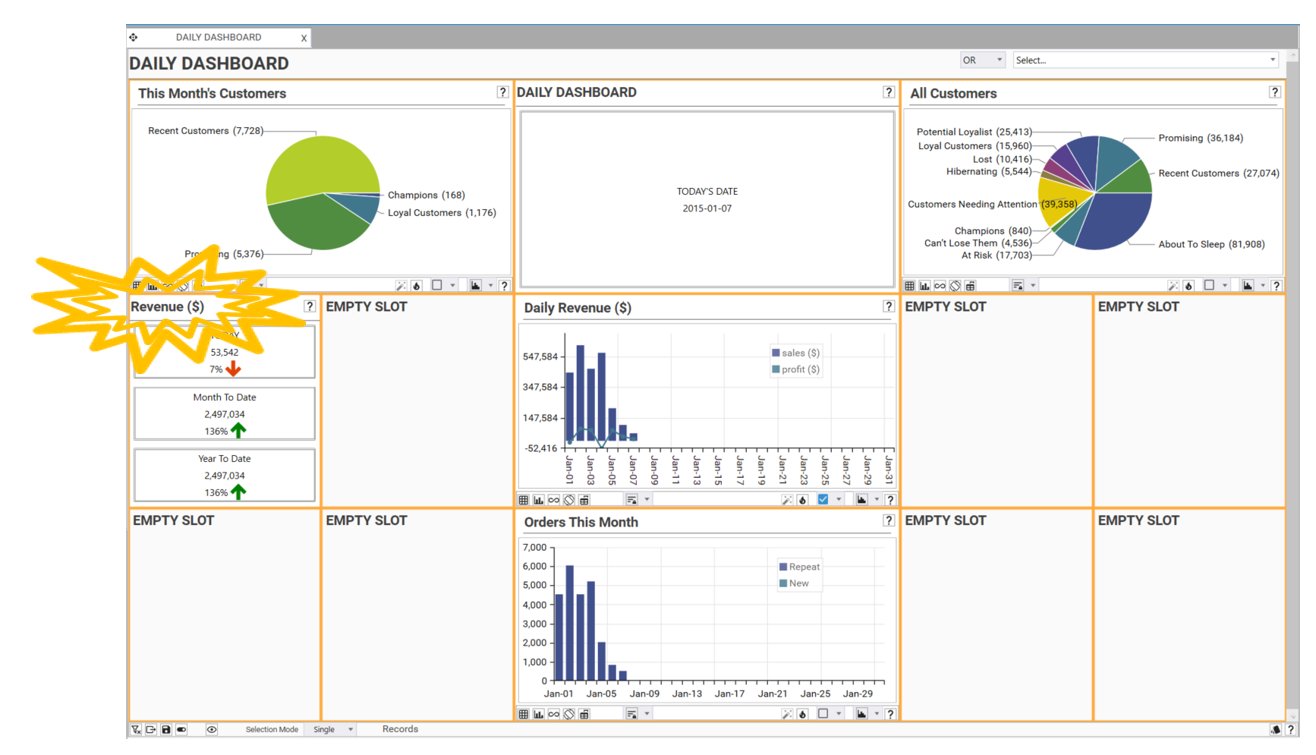
Rename the slot by double-clicking on the slot header, name it to Revenue ($).
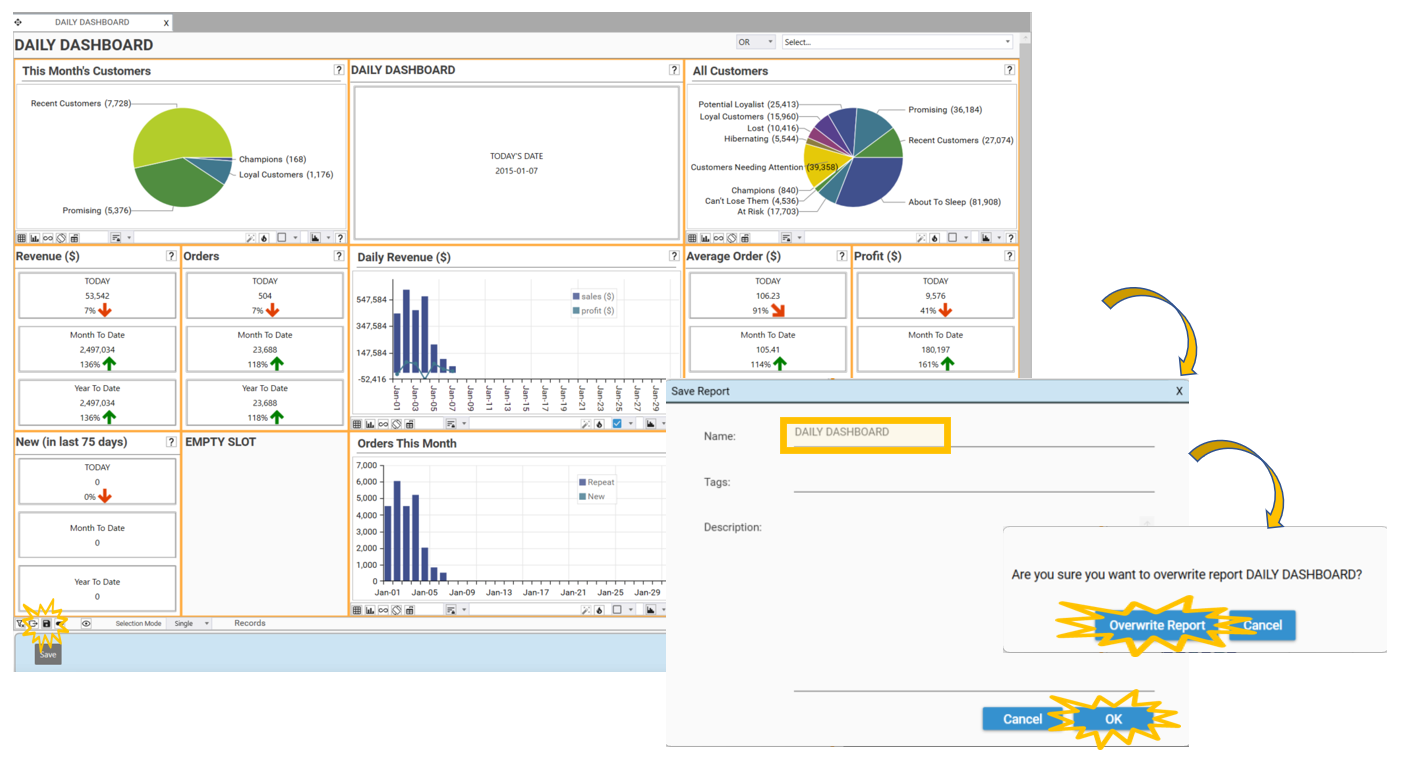
Save Dashboard
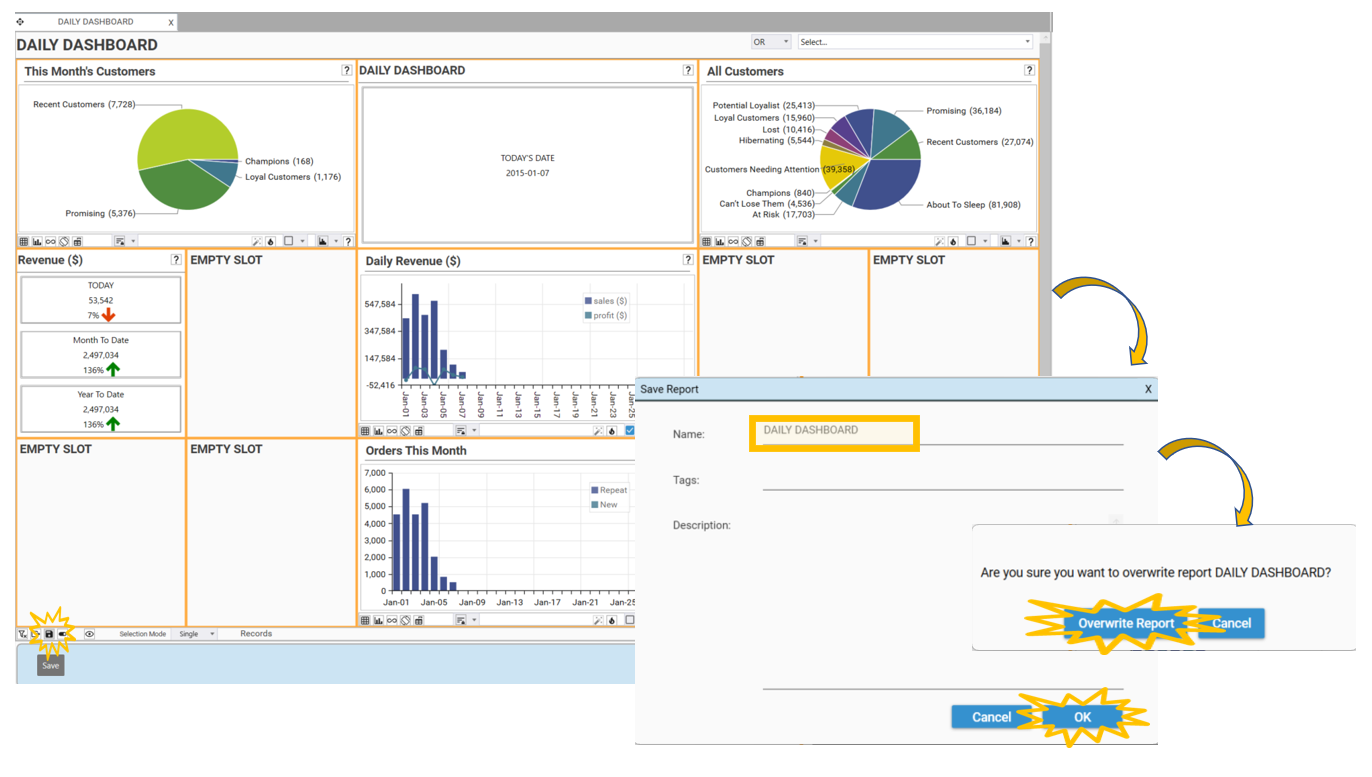
It is important to save the changes made to the Dashboard:
Click the save icon on the toolbar. The Save Report dialog will appear.
Keep the name of the report as DAILY SALES DASHBOARD and select OK.
Select Overwrite Report and the report will update.
REPORT: Orders
The Orders Panel Form is very similar to the Revenue ($) Panel Form. The only differences is the measure used: sales.transaction id instead of sales.sales. Instead of calculating sum we will be using the count function.
Video Tutorial
Open Copy of Revenue ($)
To save time, edit the panel form already made instead of creating a new one. To do this:
Right-click on Revenue($) and go to Open Copy. This will open a copy of the PANEL Build dialog for Revenue ($).
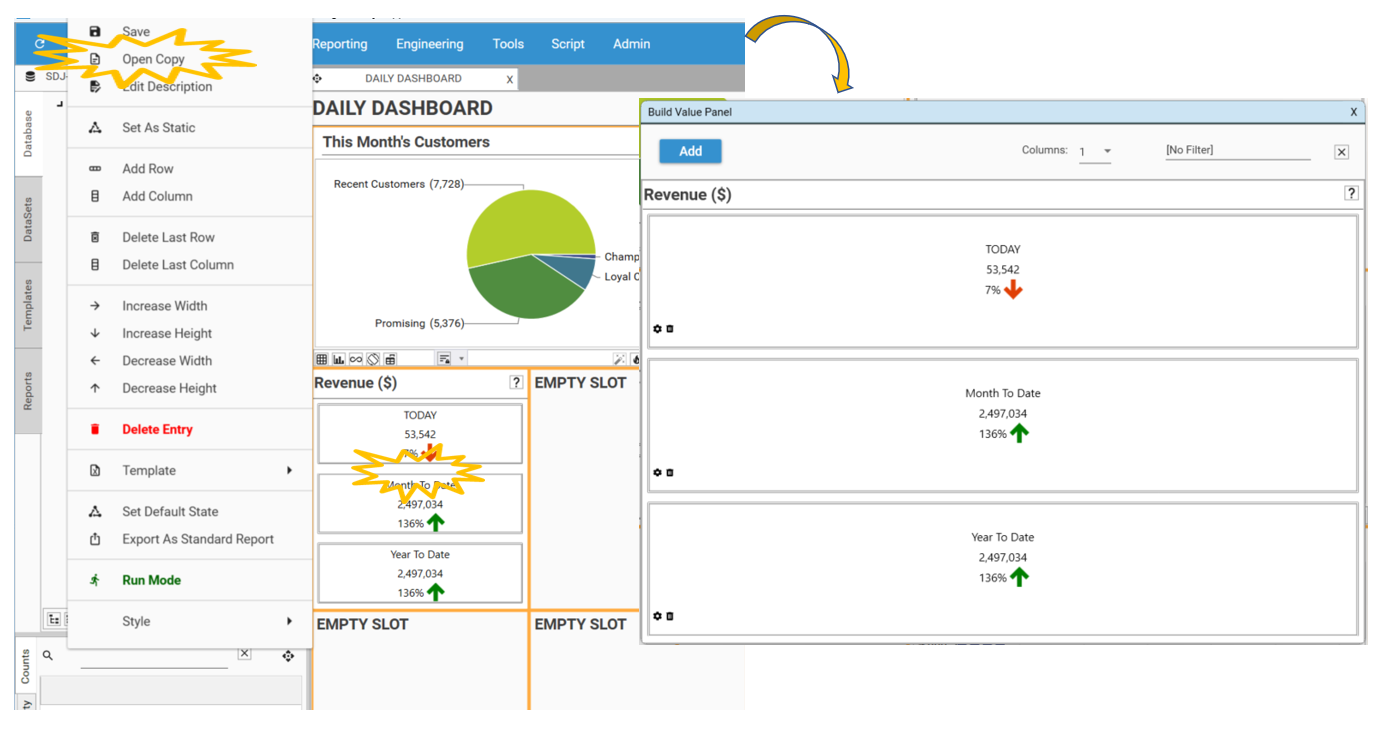
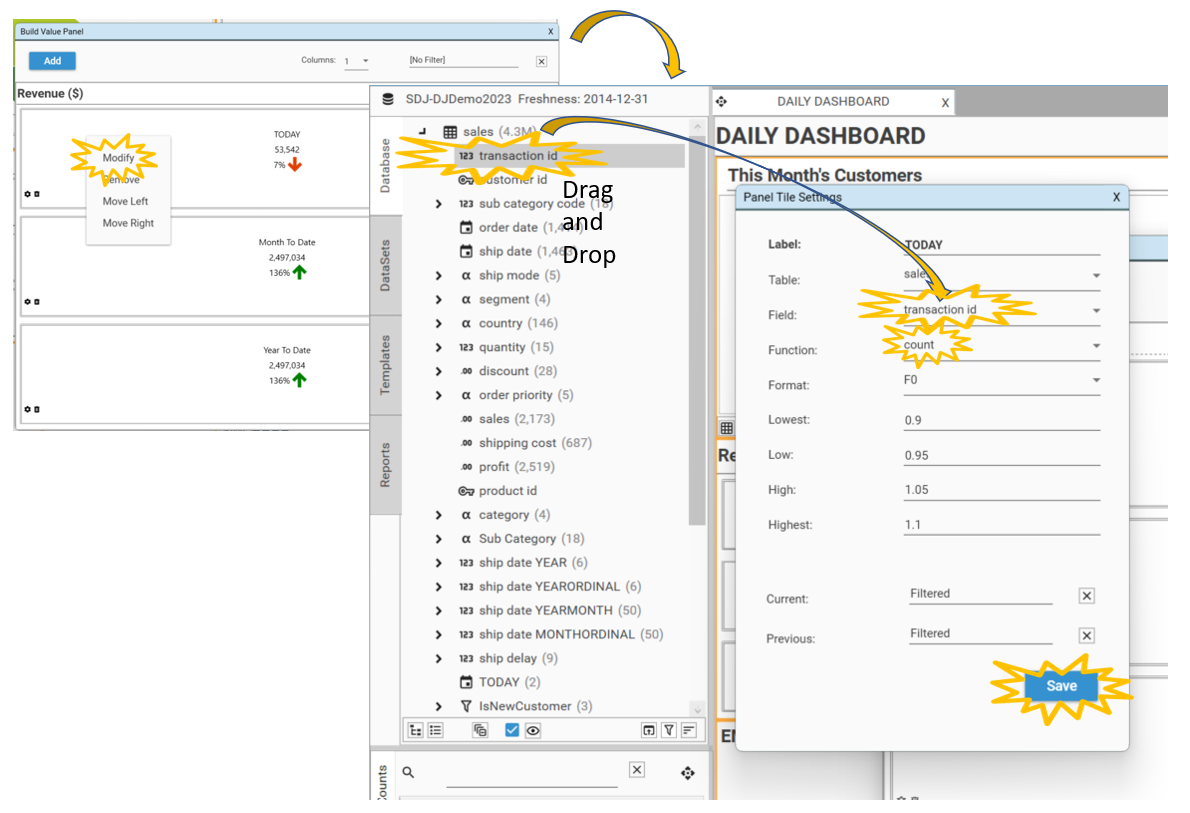
TODAY
To modify the TODAY panel to reflect Orders rather than Revenue:
Right-click in the TODAY panel and select Modify. The Panel Tile Settings Dialog will appear.
Drag and Drop sales.transaction id into the Field box (over the top of the existing field)
Change the Function to count
Select Save
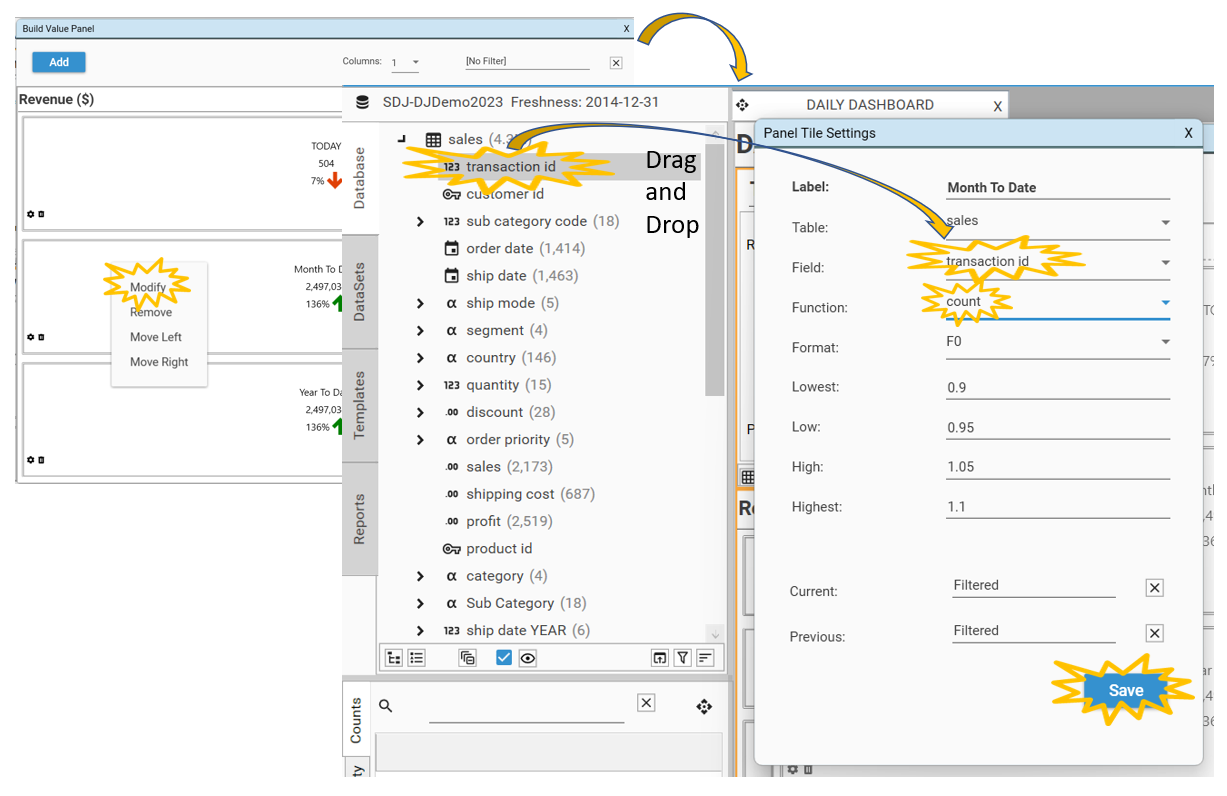
Month To Date
To modify the Month To Date panel to reflect Orders rather than Revenue:
Right-click in the Month To Date panel and select Modify. The Panel Tile Settings Dialog will appear.
Drag and Drop sales.transaction id into the Field box
Change the Function to count
Select Save
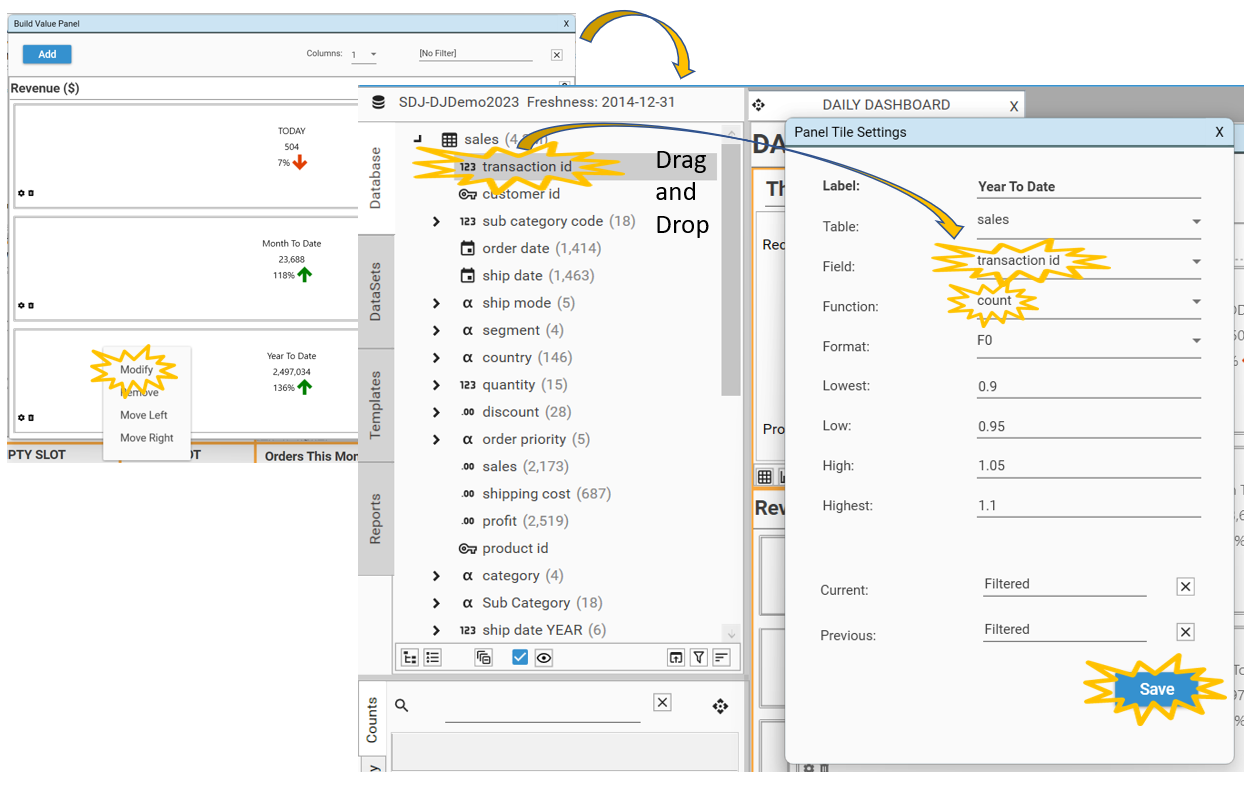
Year To Date
To modify the Year To Date panel to reflect Orders rather than Revenue:
Right-click in the Year To Date panel and select Modify. The Panel Tile Settings Dialog will appear.
Drag and Drop sales.transaction id into the Field box
Change the Function to count
Select Save
Add to Dashboard
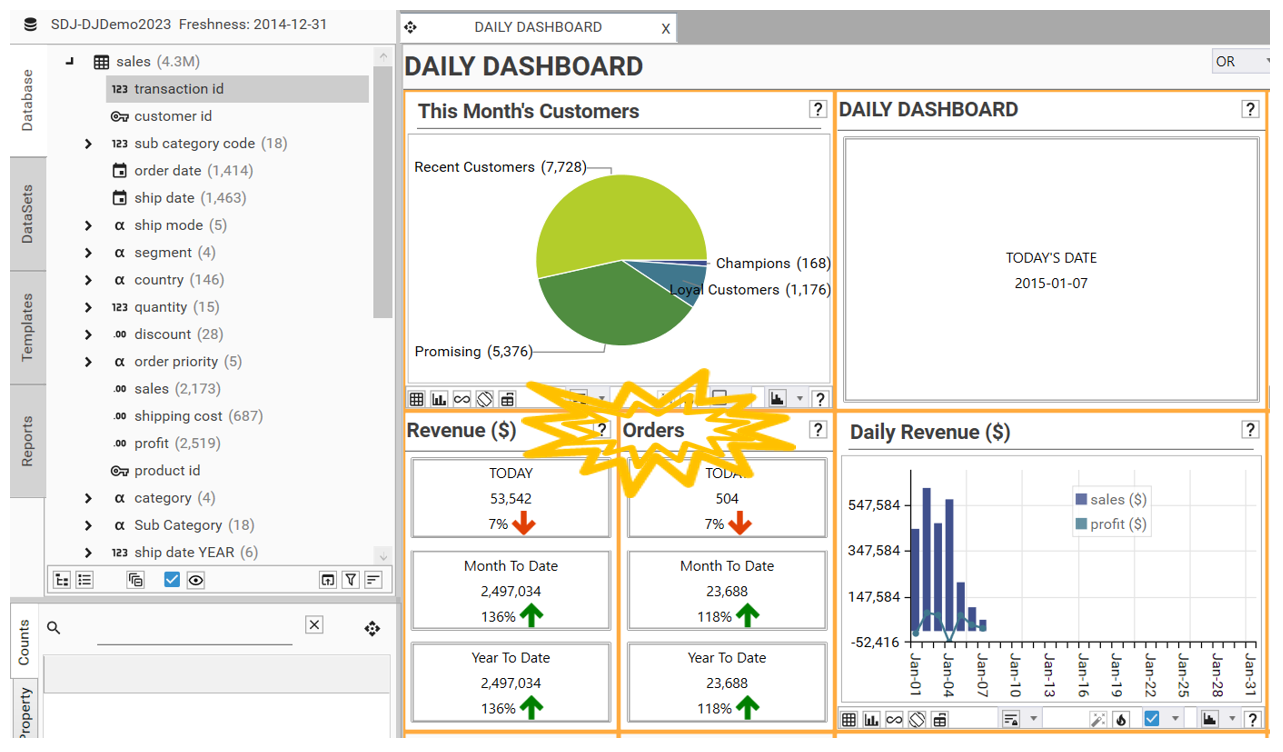
Drag and Drop the updated Stats Panel and drop it next to the Revenue ($) slot and under Orders This Month by Segment on DAILY SALES DASHBOARD.
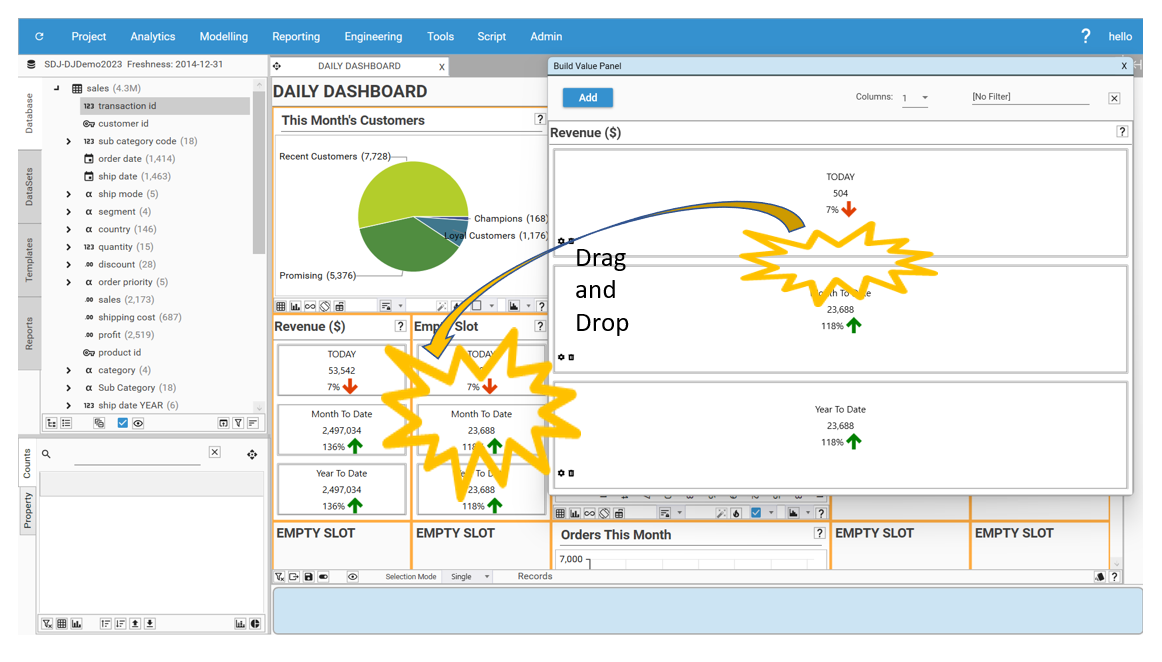
Rename the slot by double-clicking on the slot header and typing Orders.
REPORT: Average Order ($)
The Average Order ($) Panel Form is similar to the Revenue ($) Panel Form. The measure will again be sales.sales but instead of calculating sum the average function will be used. This will require a Format of F2 to show 2 decimal places.
Video Tutorial
Open Copy of Revenue ($)
To save time, edit the panel form already made. To do this right-click on Revenue($) and go to Open Copy. This will open the Build Value Panel dialog for Revenue ($).

TODAY
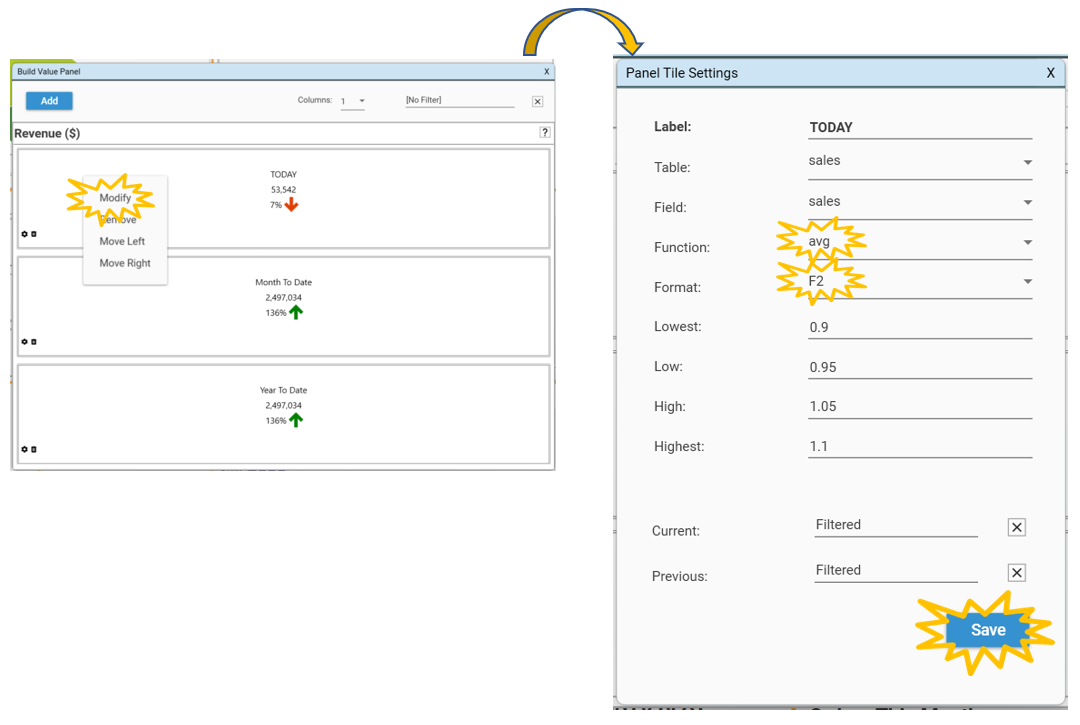
Right-click in the TODAY panel and select Modify. The Panel Tile Settings Dialog will appear.
To calculate Average Order ($) for TODAY:
Change the Function to avg
Change the Format to F2
Select Save
Month To Date
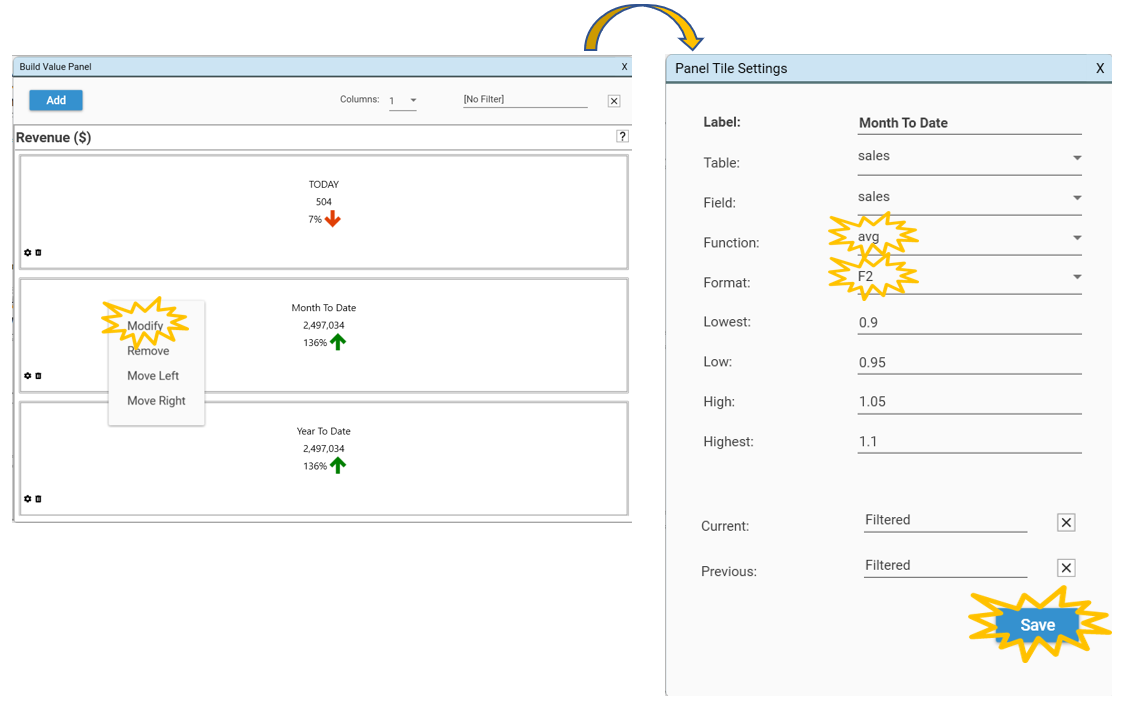
Right-click in the Month To Date panel and select Modify. The Panel Tile Settings Dialog will appear.
To calculate Average Order ($) for Month To Date:
Change the Function to avg
Change the Format to F2
Select Save
Year To Date
Right-click in the Year To Date panel and select Modify. The Panel Tile Settings Dialog will appear.
To calculate Average Order ($) for Year To Date:
Change the Function to avg
Change the Format to F2
Select Save
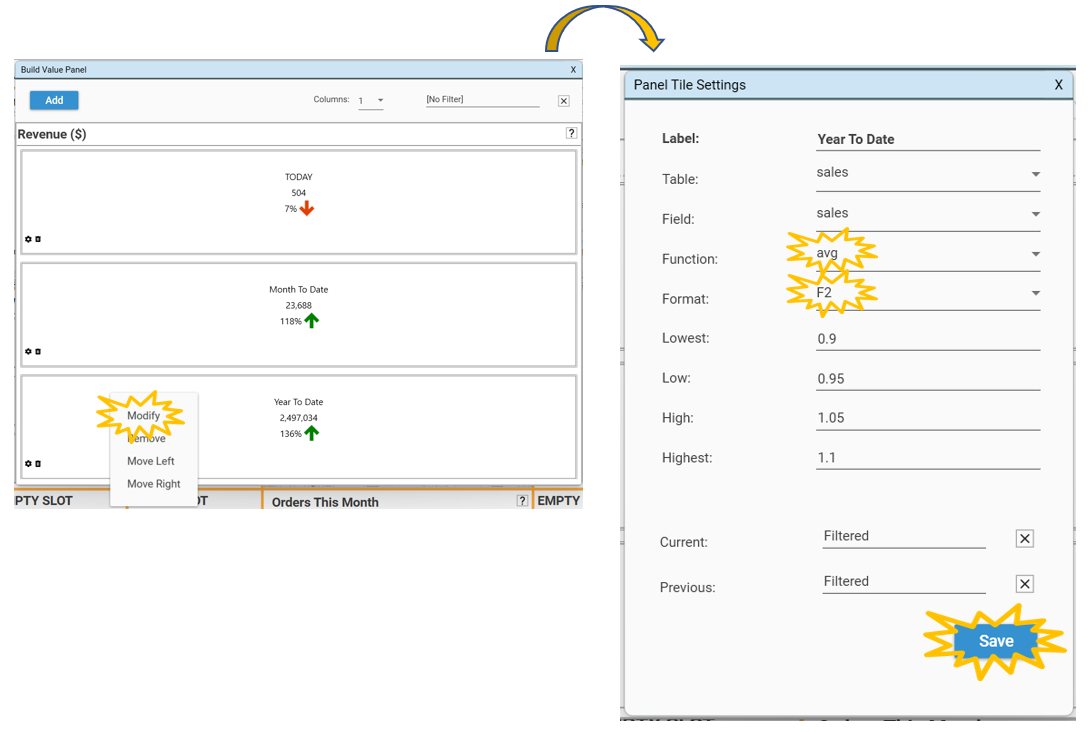
Add to Dashboard
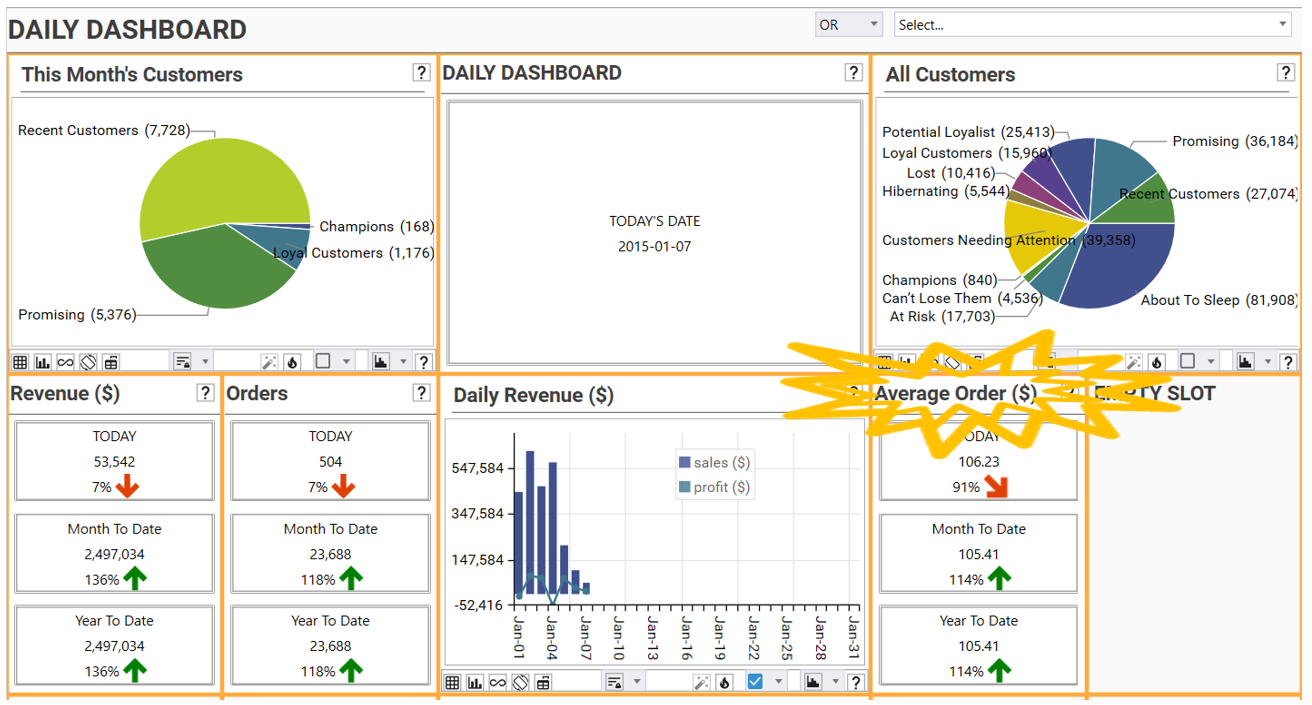
Drag and Drop the Stats Panel just made next to the Daily Revenue ($) slot and under All Orders By Segment on DAILY DASHBOARD.
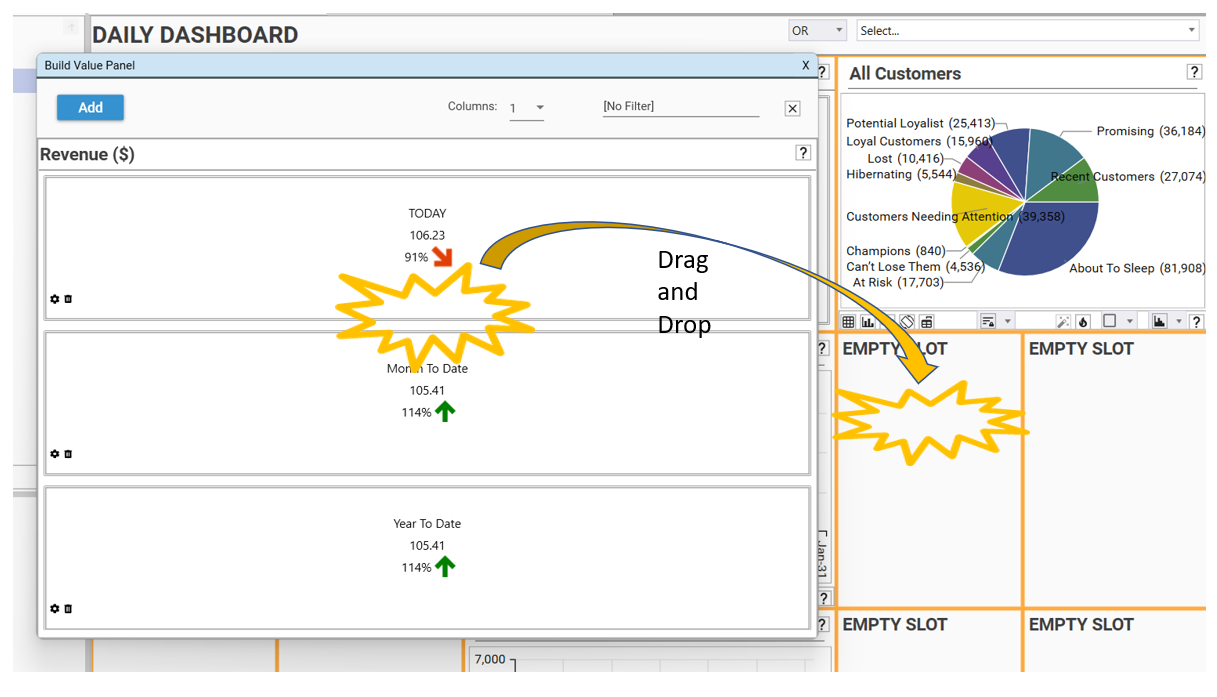
Rename the slot by double-clicking on the slot header, rename it to Average Order ($).
REPORT: Profit ($)
To make the Profit ($) Panel Form the Revenue ($) Panel Form can be used again. This time the measure will be sales.profit instead of sales.sales.
Video Tutorial
Open Copy of Revenue ($)
To save time, edit the panel form already made. To do this right-click on Revenue($) and go to Open Copy. This will open the Build Value Panel dialog for Revenue ($).

TODAY
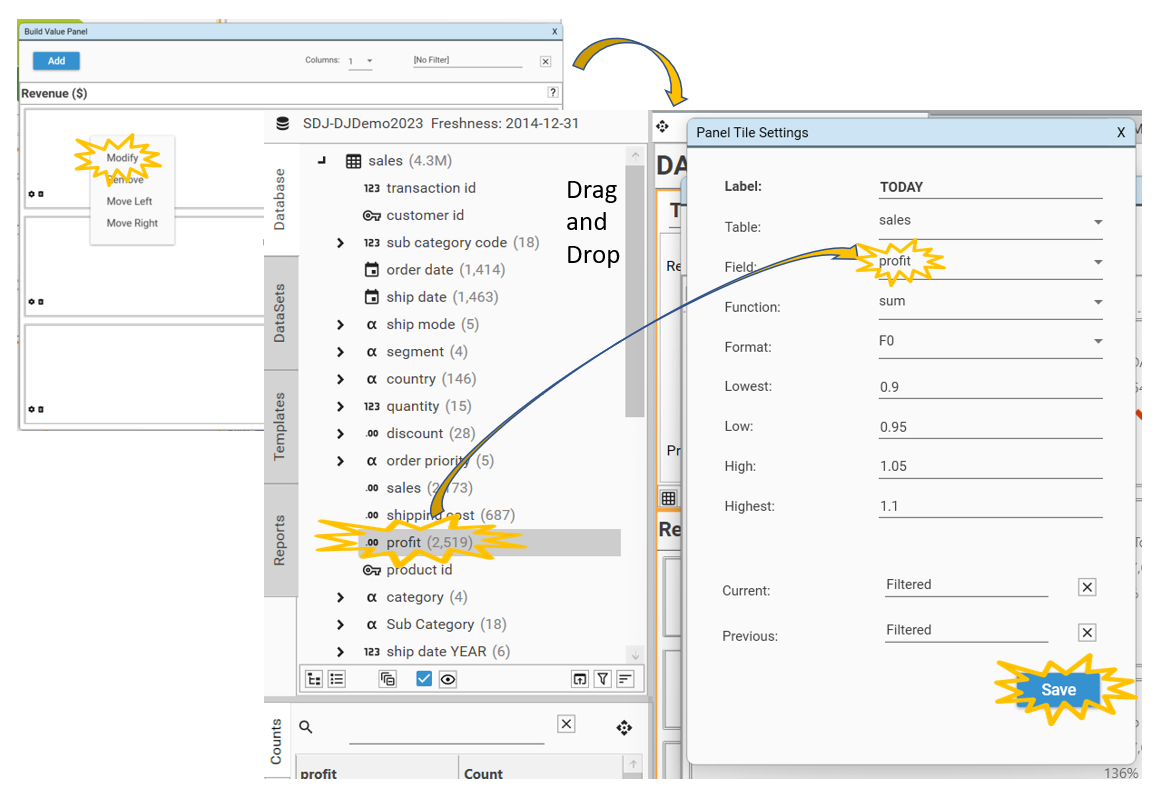
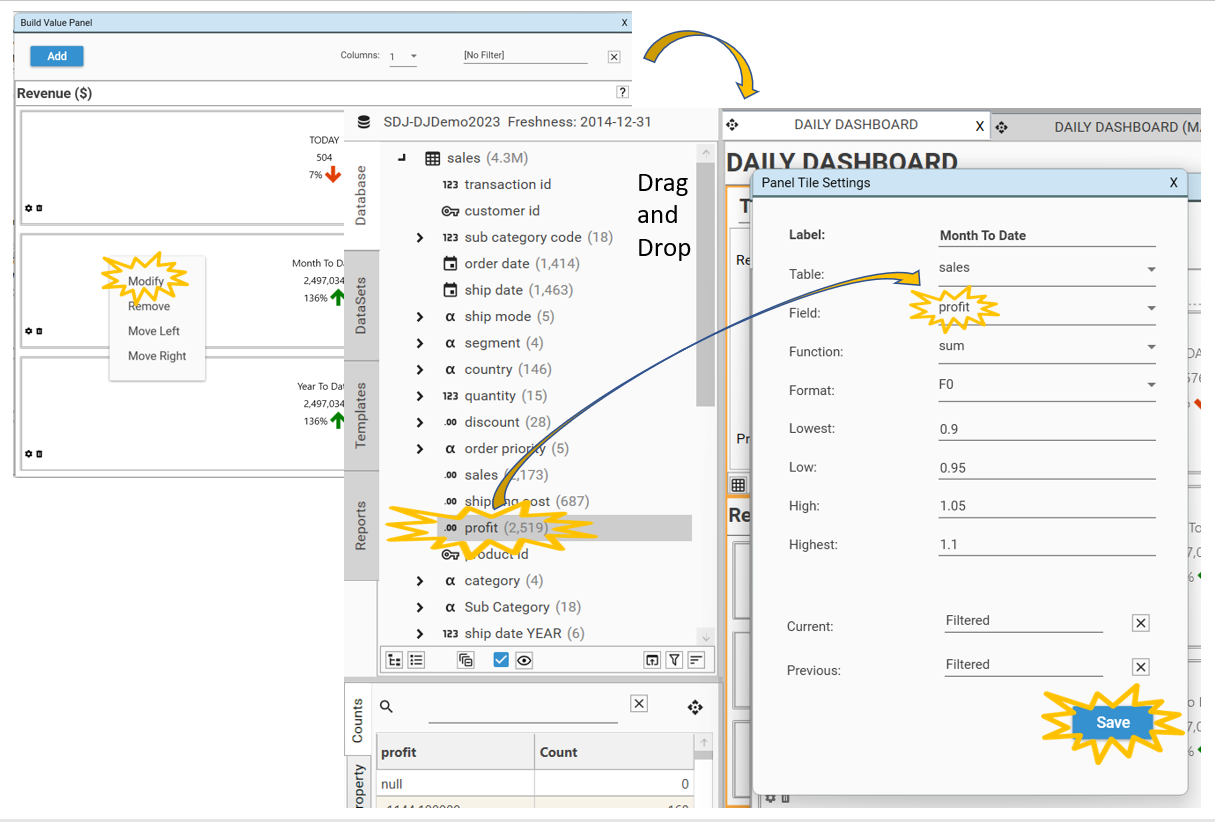
Right-click in the TODAY panel and select Modify. The Panel Tile Settings Dialog will appear.
To calculate Profit ($) for TODAY:
Drag and Drop sales.profit into the Field box
Select Save
Month To Date
Right-click in the Month To Date panel and select Modify. The Panel Tile Settings Dialog will appear.
To calculate Profit ($) for Month To Date:
Drag and Drop sales.profit into the Field box
Select Save
Year To Date
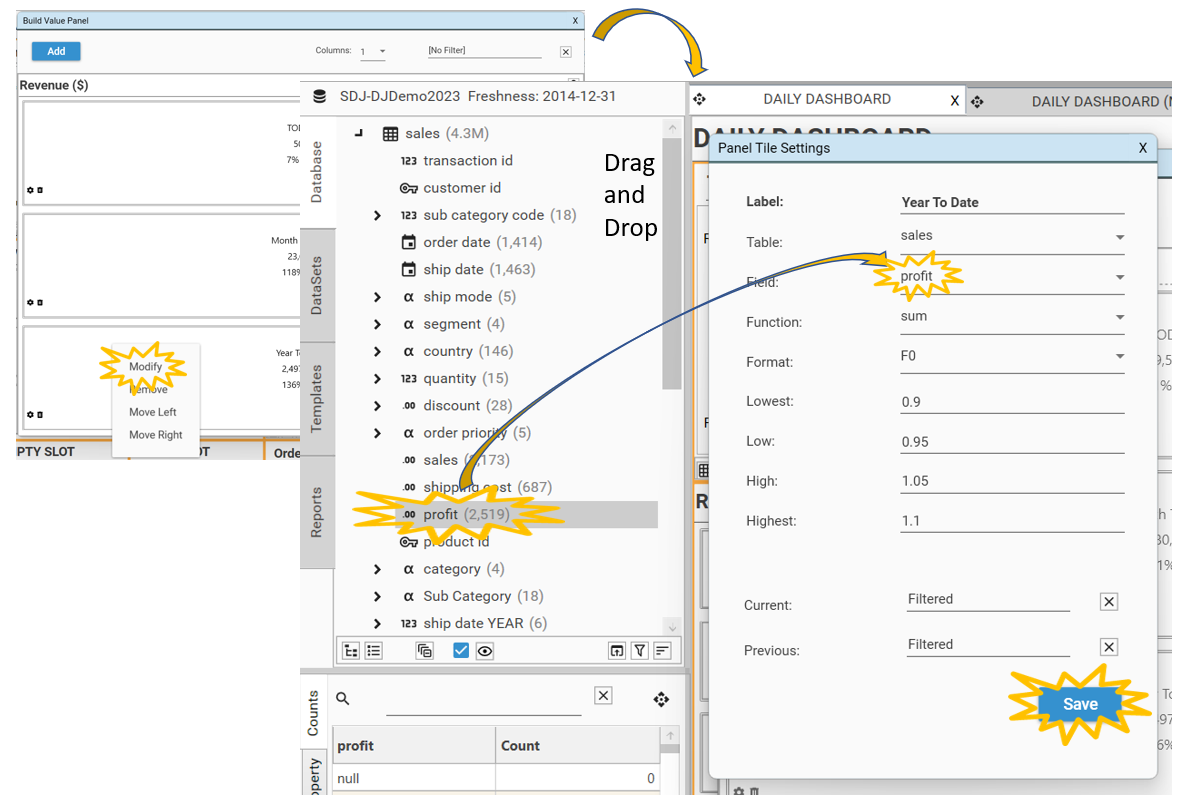
Right-click in the Year To Date panel and select Modify. The Panel Tile Settings Dialog will appear.
To calculate Profit ($) for Year To Date:
Drag and Drop sales.profit into the Field box
Select Save
Add to Dashboard
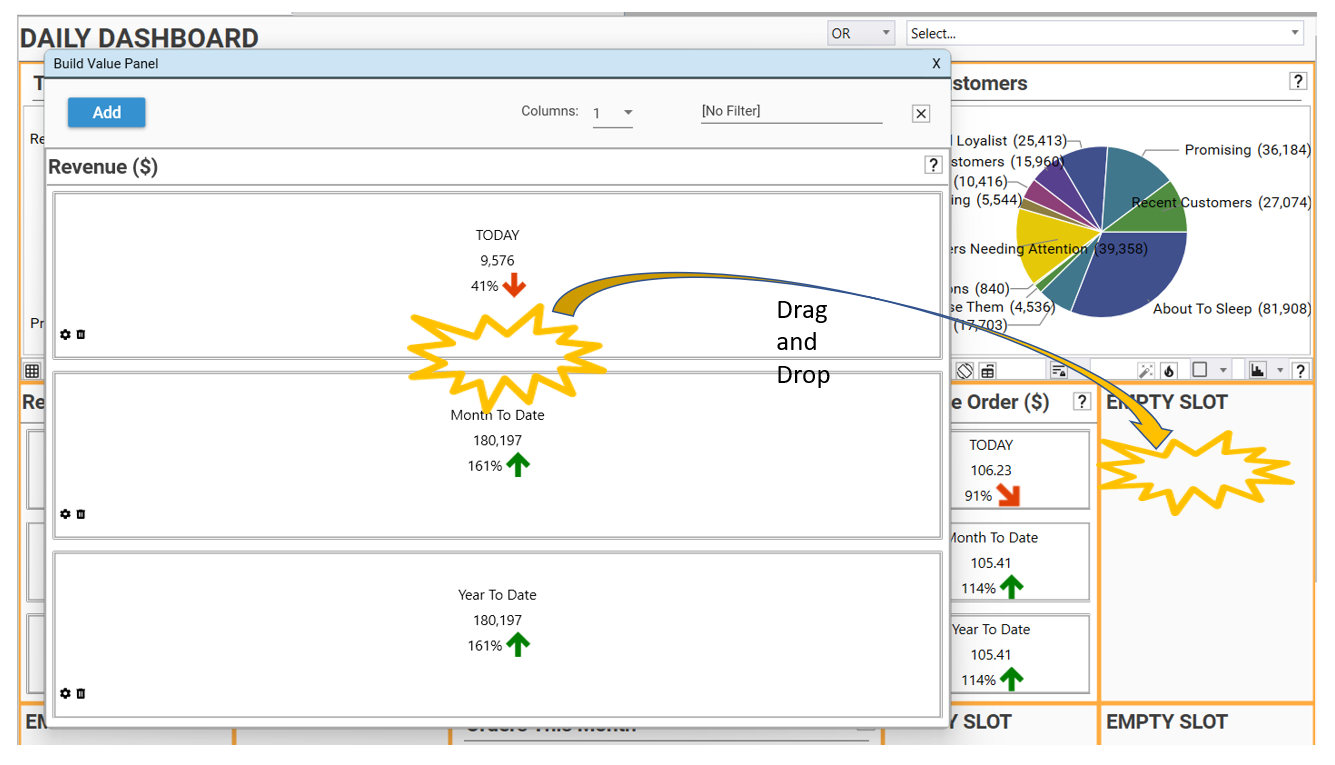
Drag and Drop the Stats Panel just made and drop it in the center slot on the right in DAILY DASHBOARD.
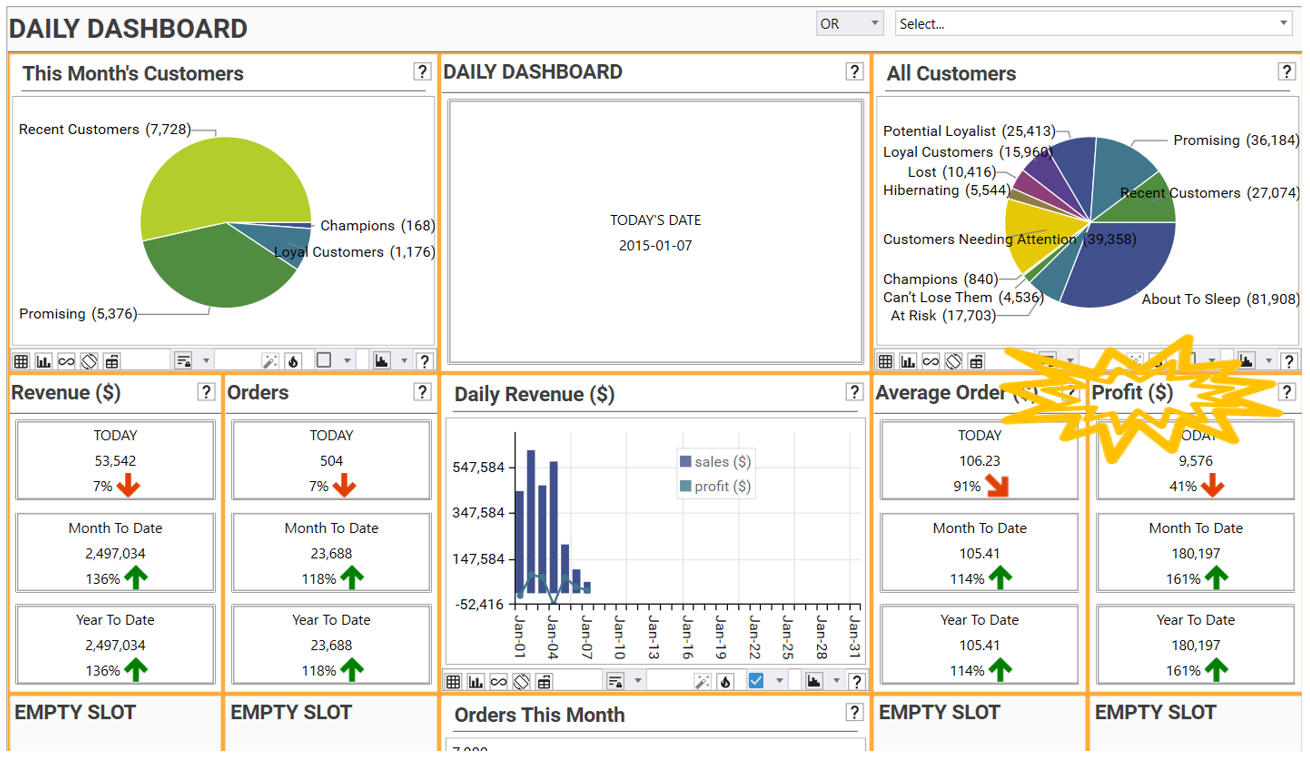
Rename the slot by double-clicking on the slot header, rename it to Profit ($).
REPORT: New Customer Orders
Video Tutorial
Create Report
Make the New Customer Orders Panel Form by creating a new panel form.
Go to Engineering | Panel Form | Manual Config. The Build Value Panel Dialog will appear.
Select Add three times to create three panels.
Right-click in the top panel and select Modify. The Panel Tile Settings Dialog will appear.

TODAY
To create the New Customer Orders for TODAY:
Drag and Drop customer.customer id into the Field box
Change the Label to TODAY
Change the Function to count
Change the Format to F0 (this is how many decimal places so this will be an integer)
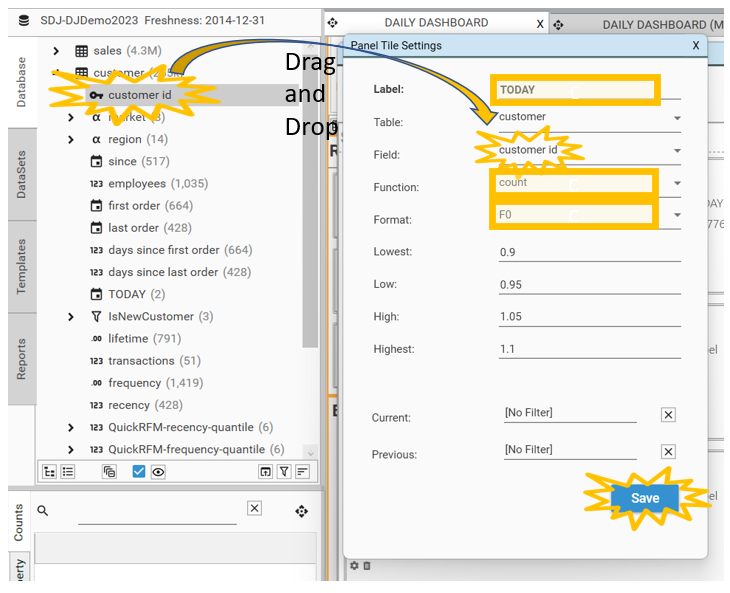
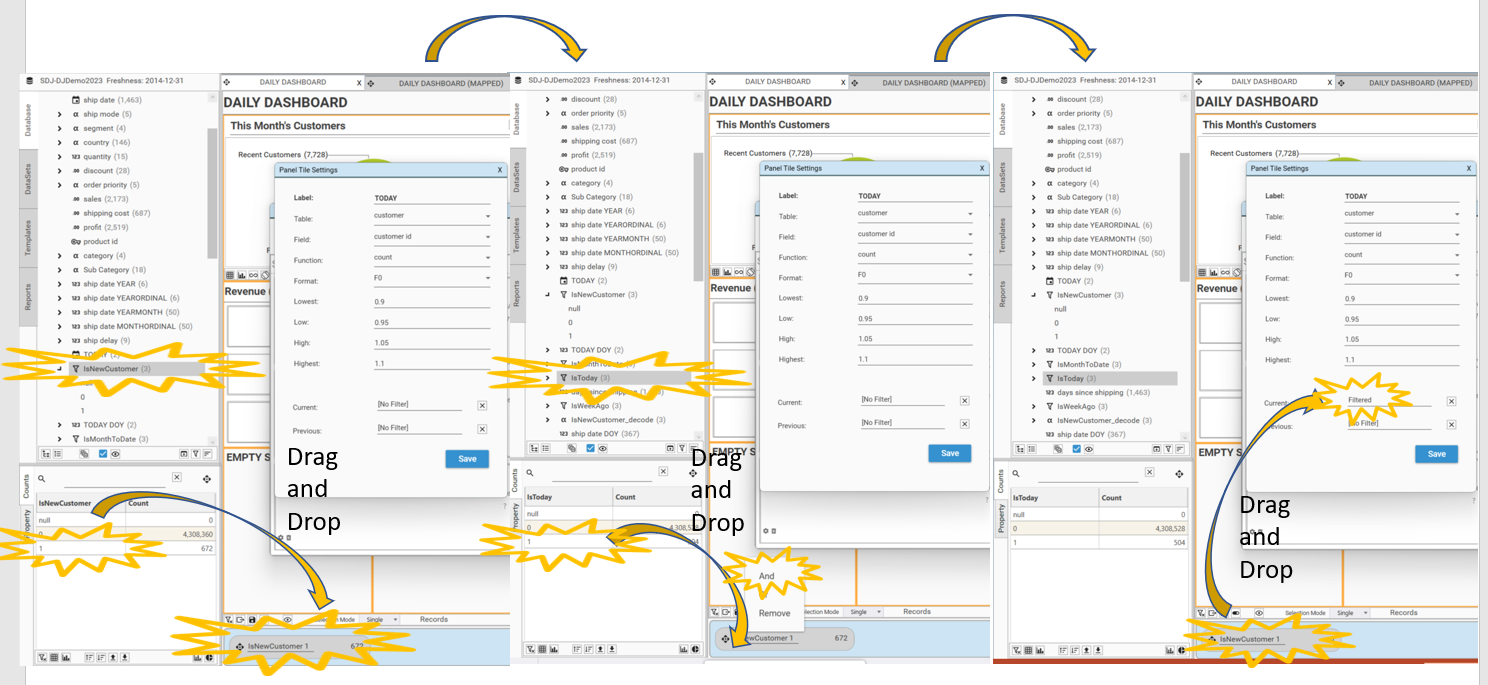
Create a new filter using the Hotbar:
Drag and Drop IsNewCustomer 1 into the Hotbar
Drag and Drop IsToday 1 on top of IsNewCustomer 1 in the Hotbar
Drag and Drop this new filter from the Hotbar into the Current box
Select Save
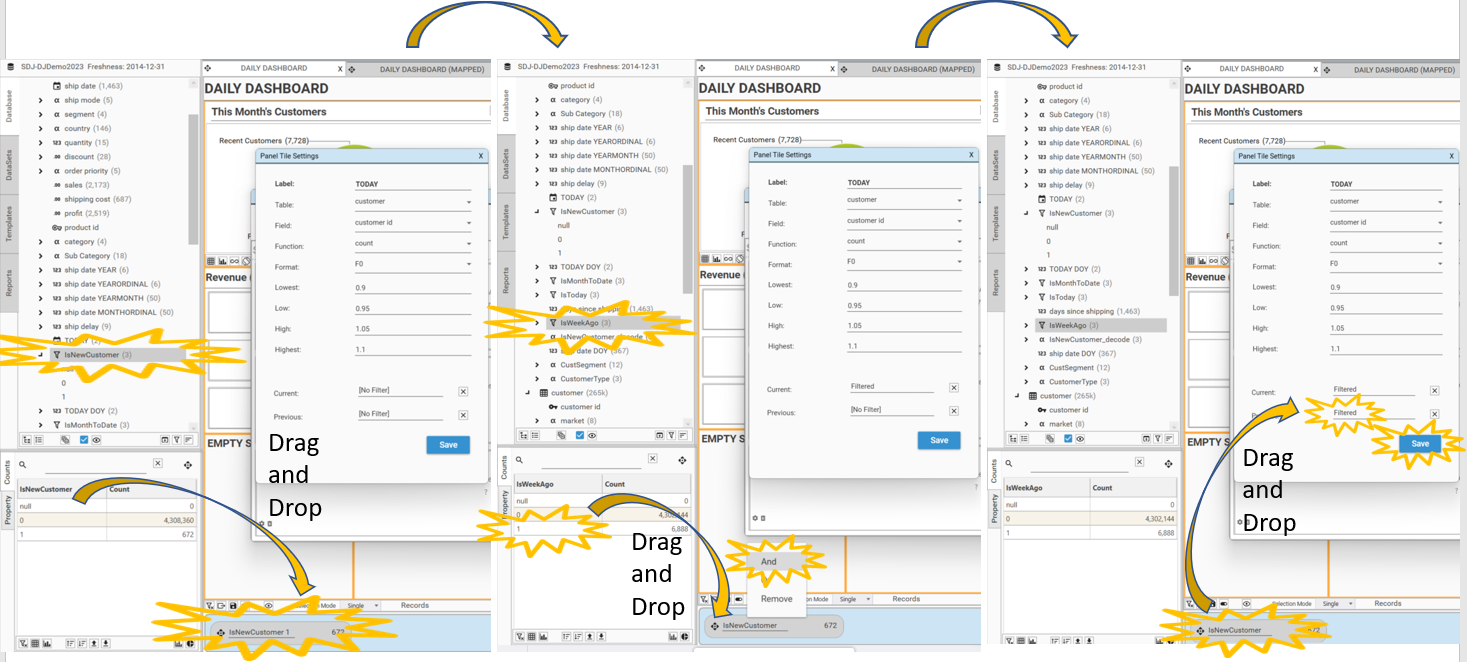
Create another new filter using the Hotbar:
Drag and Drop IsNewCustomer 1 into the Hotbar
Drag and Drop IsWeekAgo 1 on top of IsNewCustomer 1 in the Hotbar
Drag and Drop this new filter from the Hotbar into the Previous box
Select Save
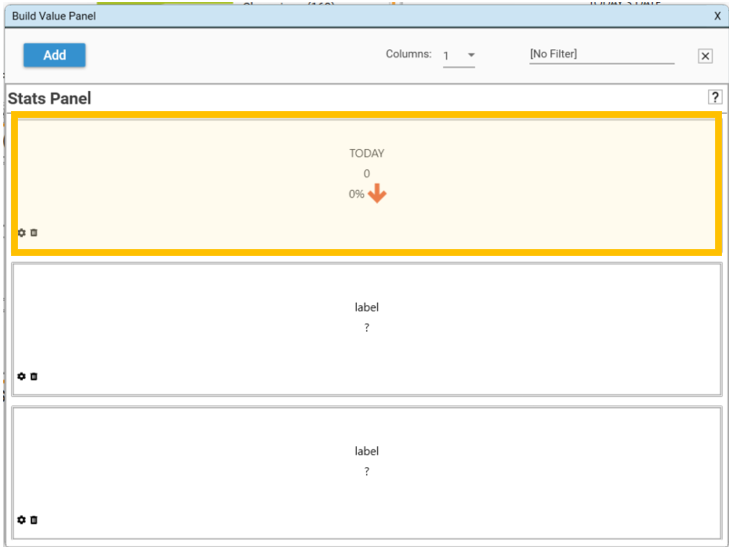
The TODAY panel will appear. This shows the number of new customers today: 0.
Month To Date
Right-click in the middle panel and select Modify. The Panel Tile Settings Dialog will appear.
To calculate New Customer Orders for Month To Date:
Drag and Drop customer.customer id into the Field box
Change the Label to Month To Date
Change the Function to count
Change the Format to F0 (this is how many decimal places so this will be an integer)

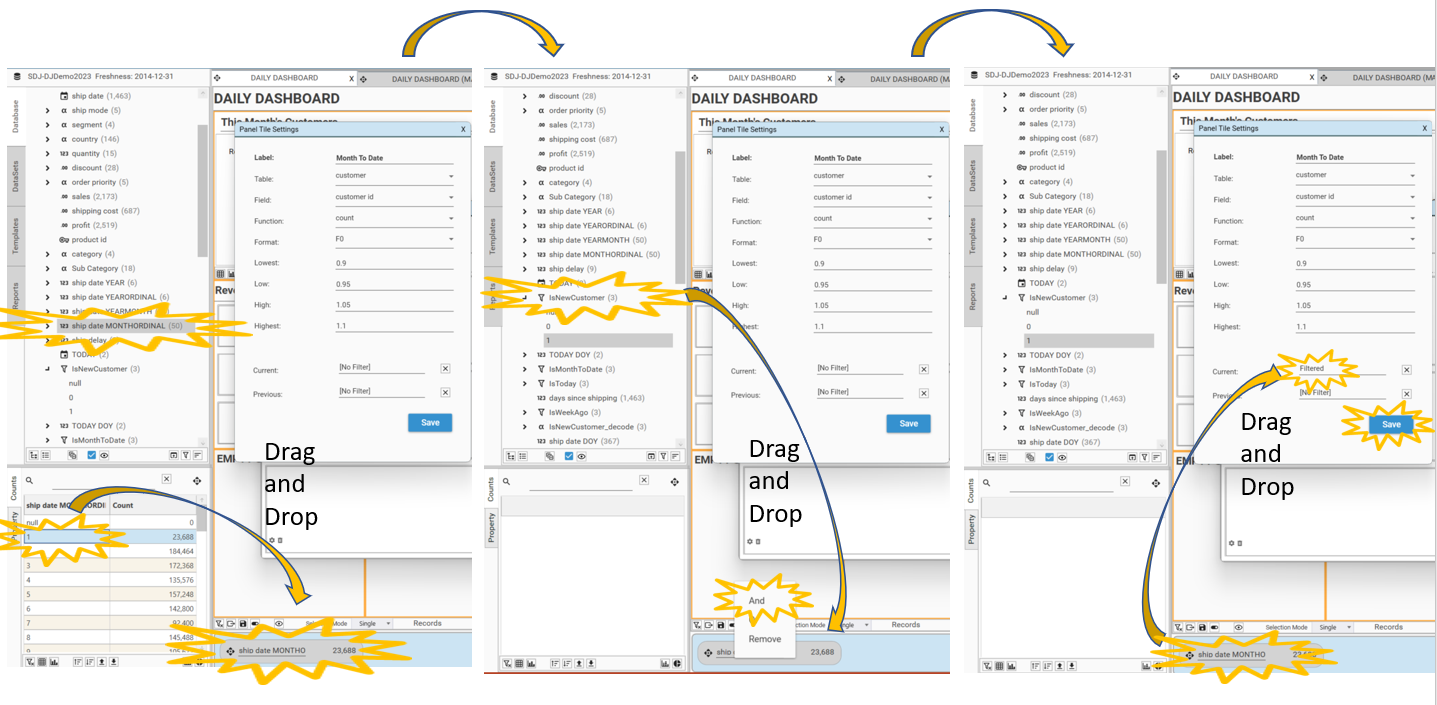
Create a new filter using the Hotbar. (This time there is nothing to compare with so leave the Previous box blank)
Drag and Drop ship date MONTHORDINAL 1 into the Hotbar
Drag and Drop IsNewCustomer 1 on top of ship date MONTHORDINAL 1 in the Hotbar
Drag and Drop this new filter from the Hotbar into the Current box
Select Save
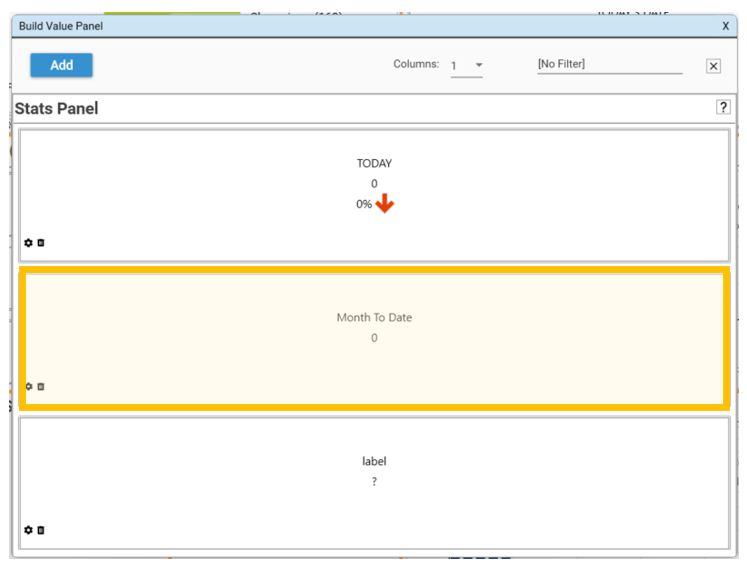
The Month To Date panel will appear. This shows the number of new customers for this Month To Date: 0.
Year To Date
Right-click in the last panel and select Modify. The Panel Tile Settings Dialog will appear.
To calculate New Customer Orders for Year To Date:
Drag and Drop customer.customer id into the Field box
Change the Label to Year To Date
Change the Function to count
Change the Format to F0 (this is how many decimal places so this will be an integer)

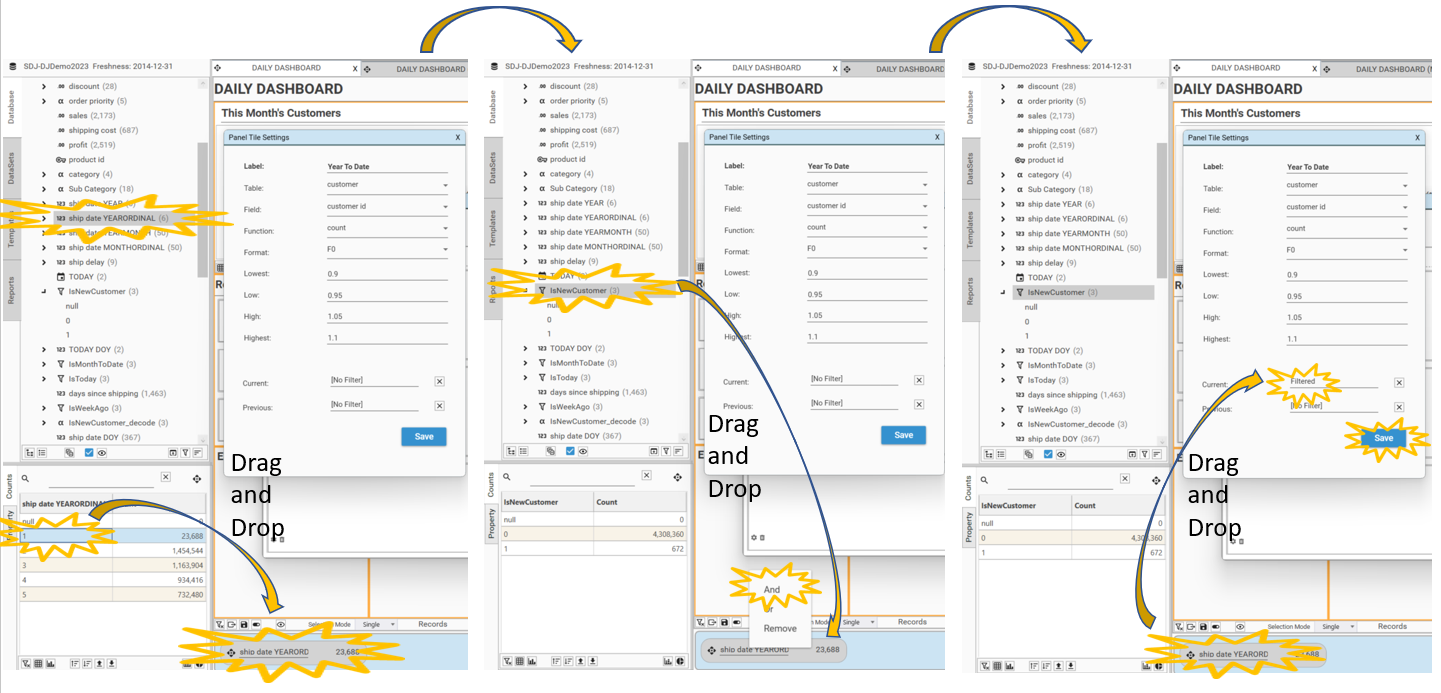
Create a new filter using the Hotbar. (This time there is nothing to compare with so leave the Previous box blank)
Drag and Drop ship date YEARORDINAL 1 into the Hotbar
Drag and Drop IsNewCustomer on top of ship date YEARORDINAL 1 in the Hotbar
Drag and Drop this new filter from the Hotbar into the Current box
Select Save
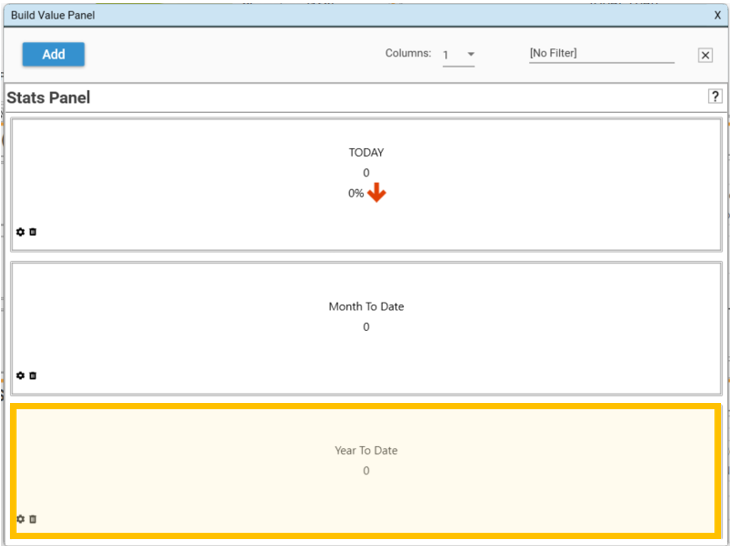
The Year To Date panel will appear. This shows the number of new customers for Year To Date: 0.
Why are Month To Date and Year To Date the same?
in this dataset, Month To Date and Year To Date are the same. This is because the value of “TODAY” for the demo dataset is Jan 7th 2015. This means the day of the month and the day of the year are the same. There are no customers who satisfy the “new customer” criteria so far this year.
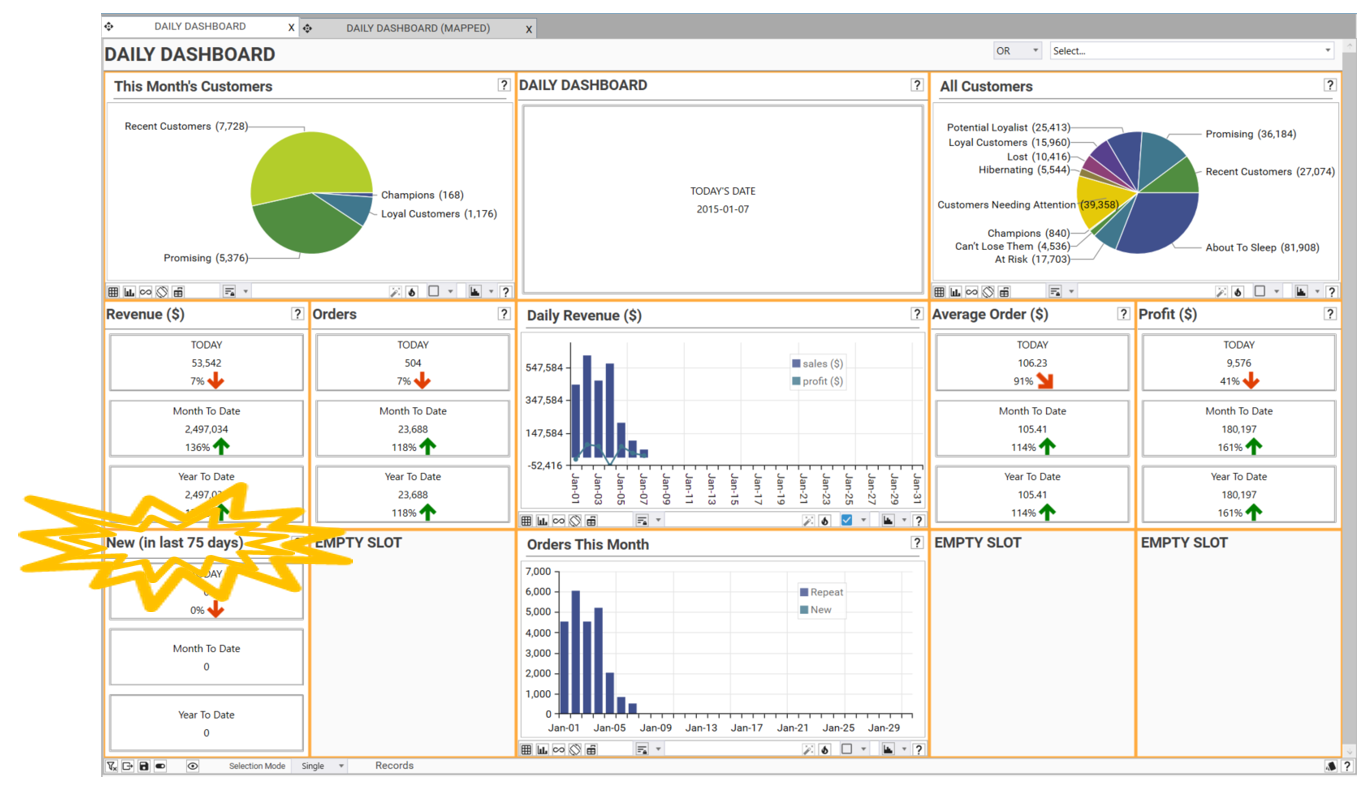
Drag and Drop the Stats Panel into the bottom-left slot on DAILY DASHBOARD:
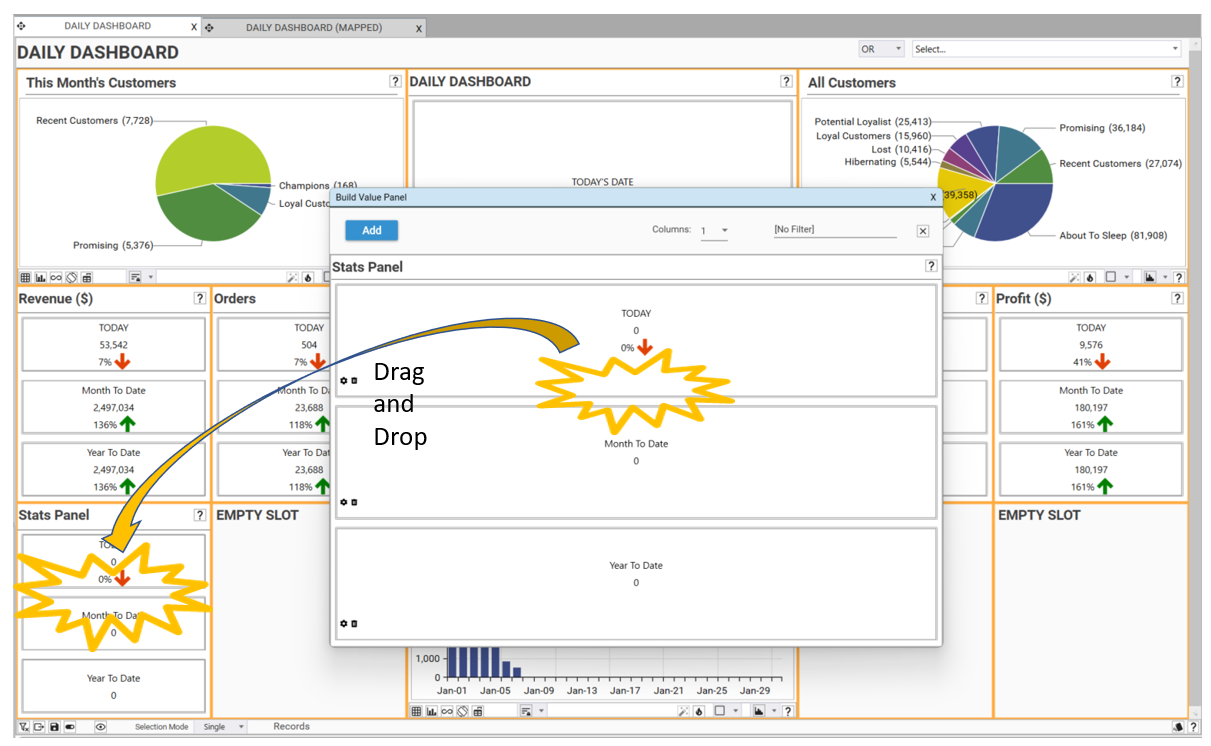
Rename the slot by double-clicking on the slot header, and typing New Customer Orders.
Repeat Customers
The Repeat Customers Panel Form is created using a copy of the New Customer Orders Panel Form. The difference is that the filter will select for Repeat customers instead of New customers.
Video Tutorial
Open Copy of New Customer Orders
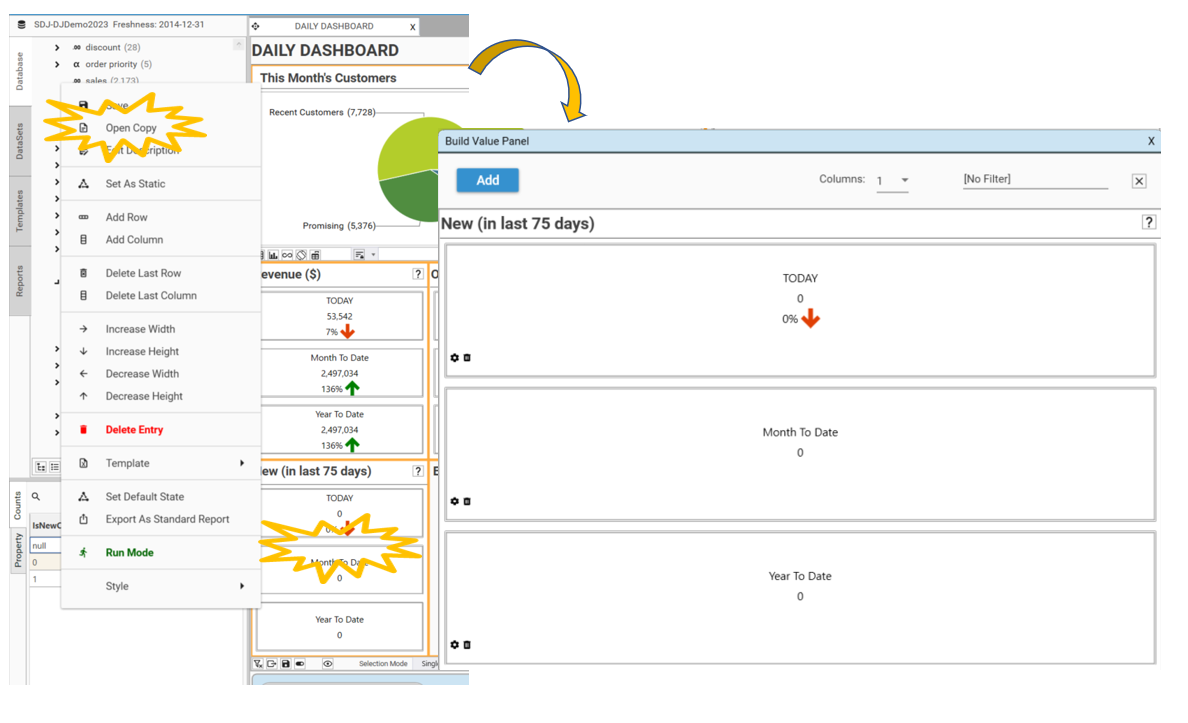
To save time, edit the existing panel form instead of creating a new one. To do this right-click on New Customer Orders and go to Open Copy. This will open the Build Value Panel dialog for New Customer Orders .
TODAY
Right-click in the TODAY panel and select Modify. The Panel Tile Settings Dialog will appear.
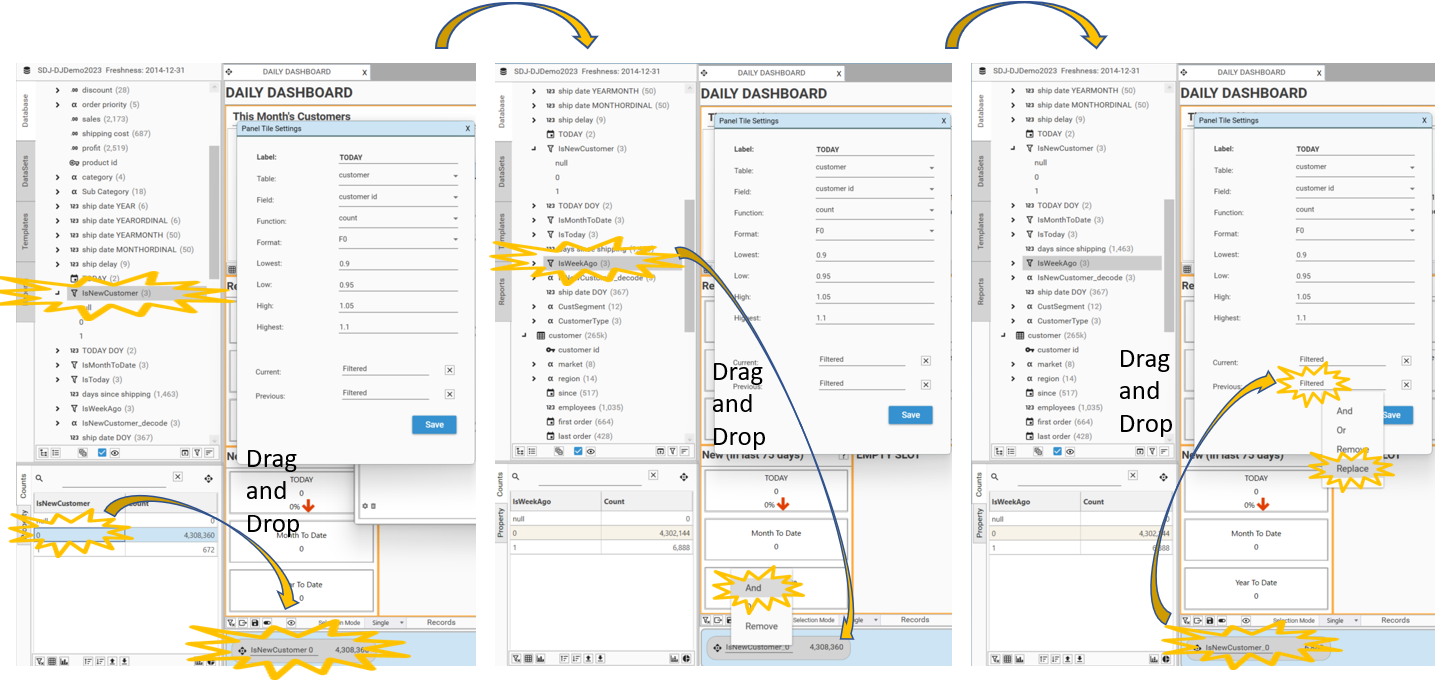
To calculate Repeat Customers for TODAY, create a new filter using the Hotbar:
Drag and Drop IsNewCustomer 0 into the Hotbar
Drag and Drop IsToday on top of IsNewCustomer 0 in the Hotbar
Drag and Drop this new filter from the Hotbar into the Current box and select Replace
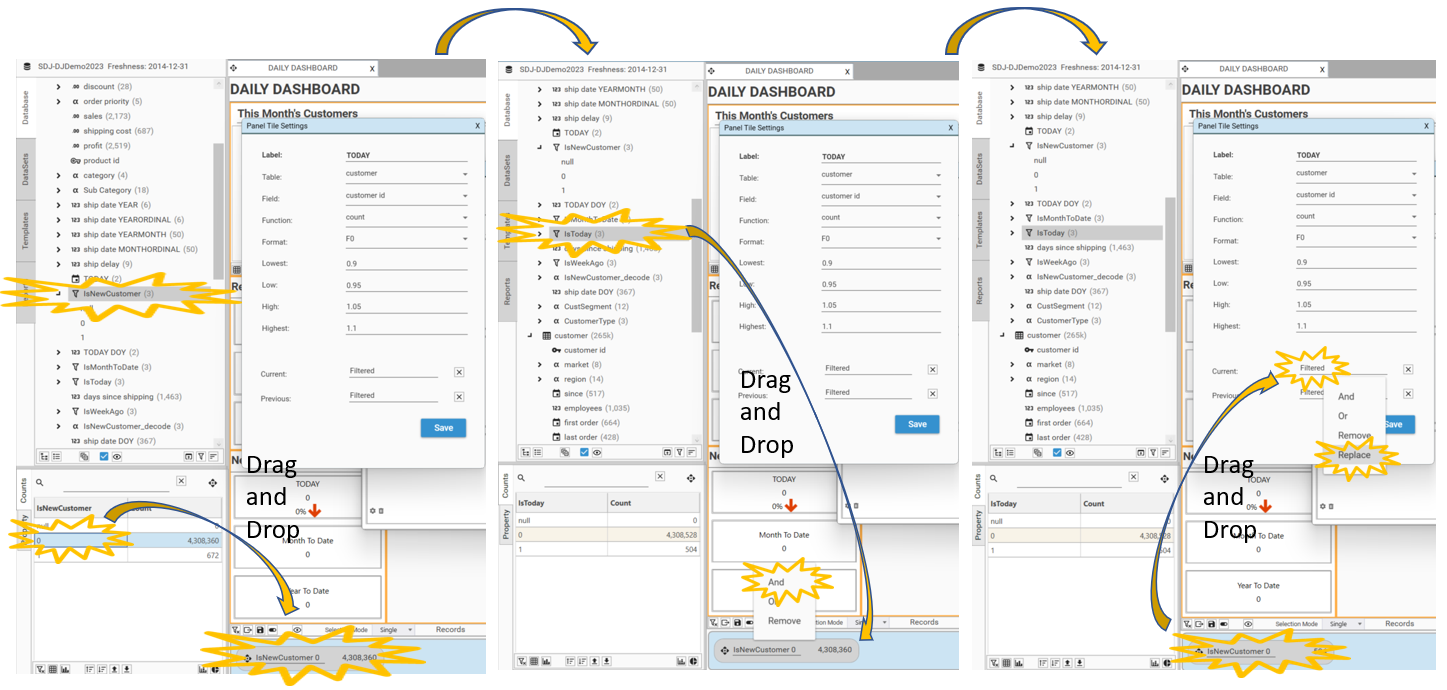
Create another new filter using the Hotbar:
Drag and Drop IsNewCustomer 0 into the Hotbar
Drag and Drop IsWeekAgo on top of IsNewCustomer 0 in the Hotbar
Drag and Drop this new filter from the Hotbar into the Previous box and select Replace
Select Save
Month To Date
Right-click in the Month To Date panel and select Modify. The Panel Tile Settings Dialog will appear.
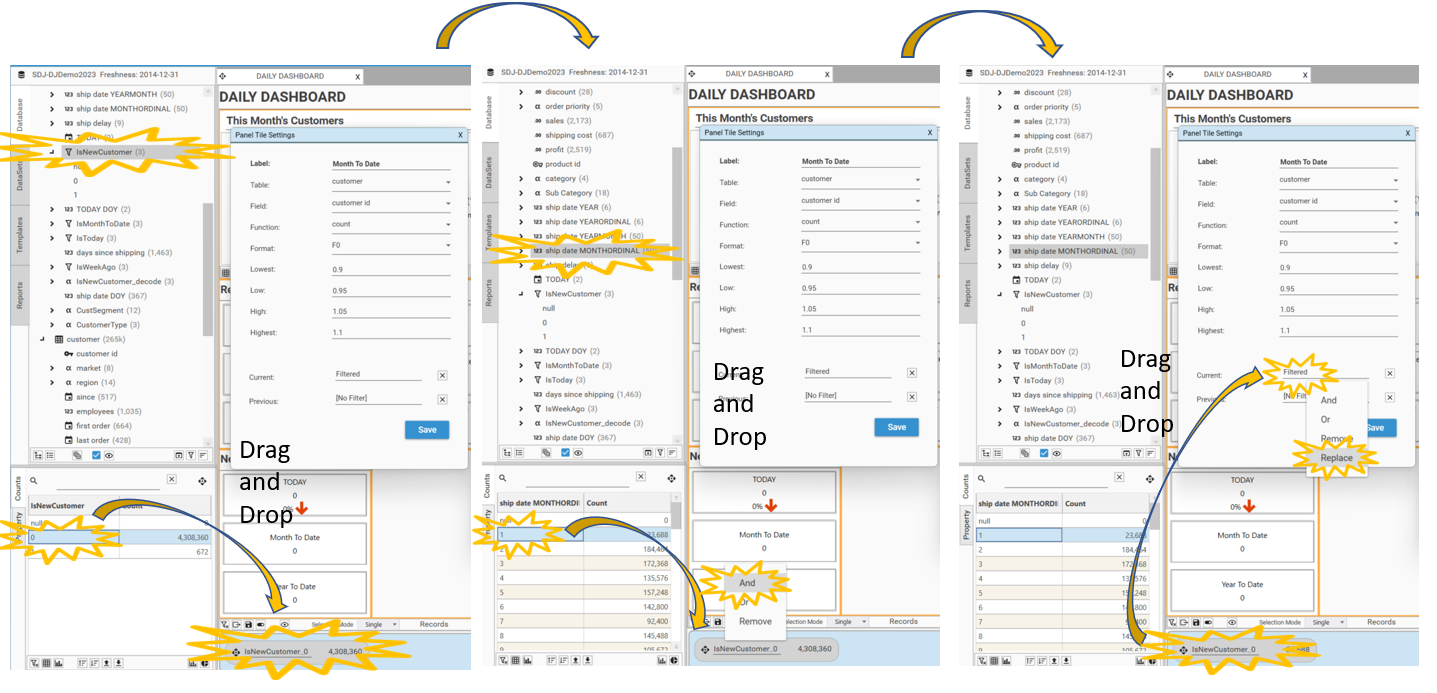
To calculate Repeat Customers for Month To Date:
Drag and Drop IsNewCustomer 0 into the Hotbar
Drag and Drop MonthOrdinal 1 on top of IsNewCustomer 0 in the Hotbar
Drag and Drop this new filter from the Hotbar into the Current box and select Replace
Select Save
Year To Date
Right-click in the Year To Date panel and select Modify. The Panel Tile Settings Dialog will appear.
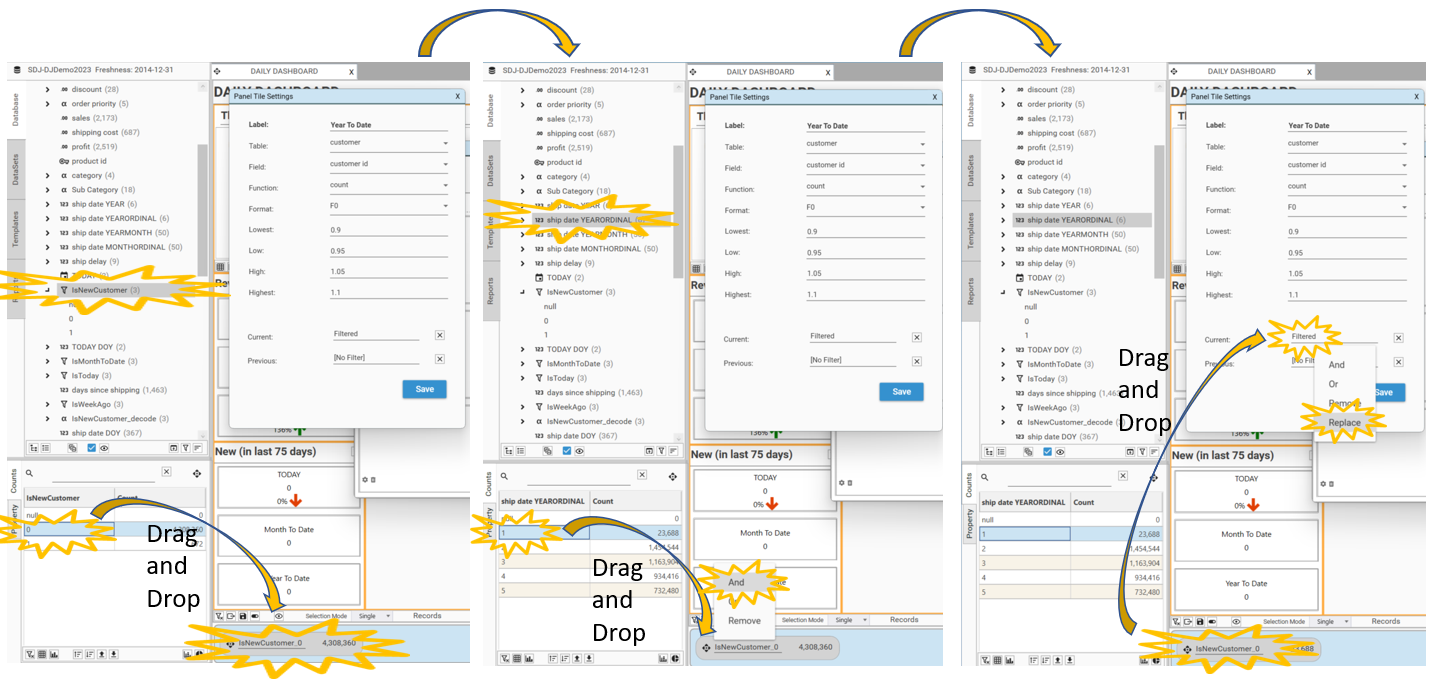
To calculate Repeat Customers for Year To Date:
Drag and Drop IsNewCustomer 0 into the Hotbar
Drag and Drop YearOrdinal 1 on top of IsNewCustomer 0 in the Hotbar
Drag and Drop this new filter from the Hotbar into the Current box and select Replace
Select Save
Add to Dashboard
Drag and Drop the Stats Panel into the bottom right slot in DAILY DASHBOARD.
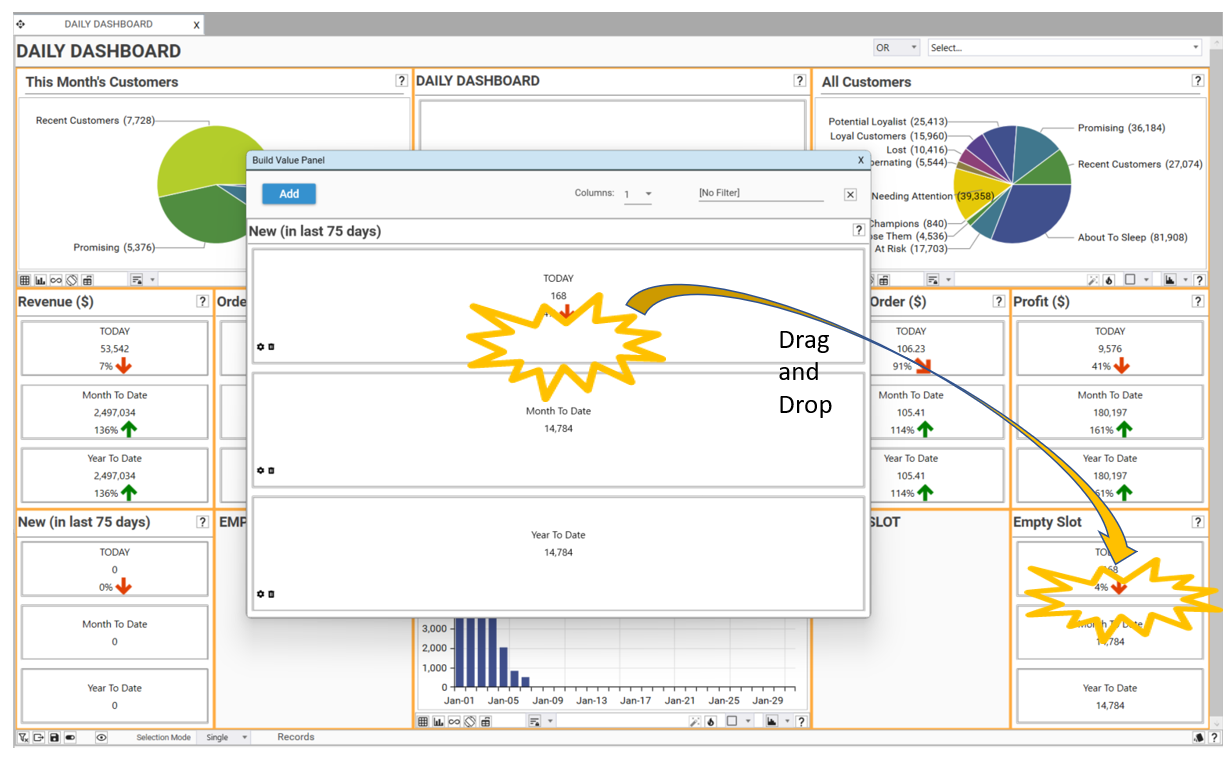
Rename the slot by double-clicking on the slot header and typing Repeat Customers.
Save Dashboard
It is important to save the changes made to the Dashboard. The dashboard template can be saved by clicking the save icon on the toolbar. The Save Report dialog will appear. Keep the name of the report as DAILY DASHBOARD and select OK. Select Overwrite Report and the report will update.
