A key feature of DataJet is the ability to rapidly profile data on very large datasets without needing to create SQL queries. This gives Instant insight into the data without the need for complex engineering.
Profiles are used for:
- summarizing
- visualizing
- counting, frequency, grouping, aggregating, cross-tabulating
All profiles count and summarize individual records in order to understand the distribution of the data: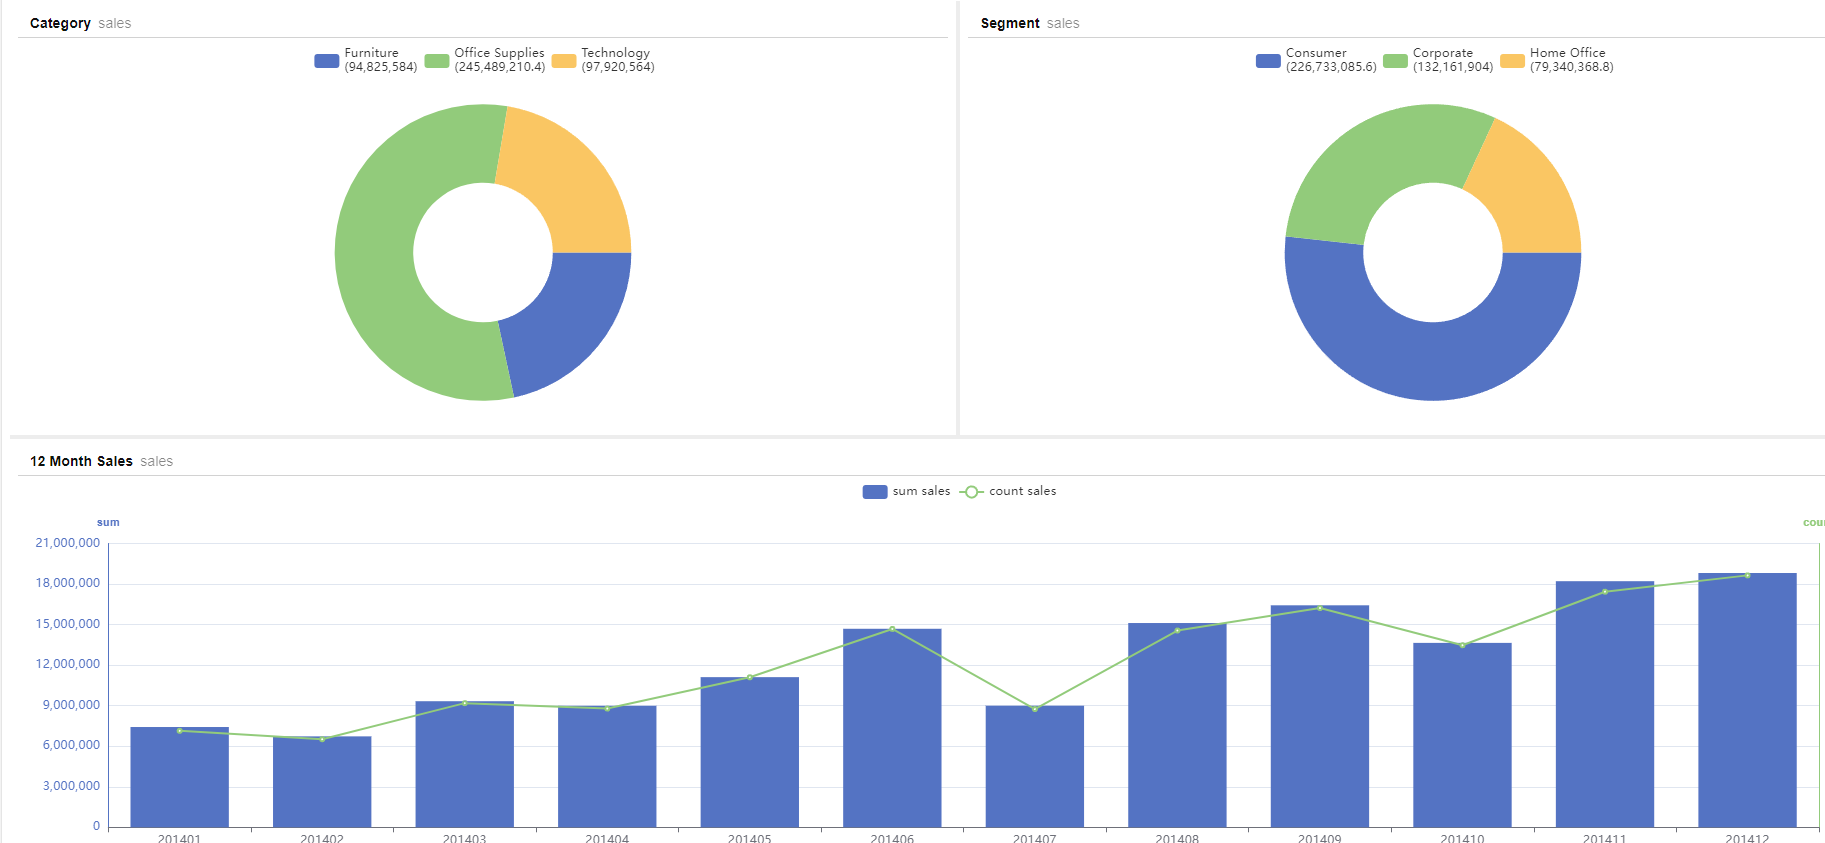
As well as simple instant profiles, sophisticated calculations can be configured to group and display multiple measures. It is also possible to visualize relative under or over-representation of unique values in different datasets, and to create calculated columns from profile results. Profile result sets can be output to file, saved as new tables, used as input for models and added to dashboards and standardized reports. Underlying data can be selected from grids and graphs and used to create datasets for further analysis.
Profiles can be rapidly duplicated with new dimensions or filters by dropping field templates onto an individual profile report. Variables can be used to automate the production of all profile types in script, and many different chart types and layout options are available.
All categorical data is suitable for profiling - continuous data can be engineered so that it is suitable for profiling.
Types of Profile
The following profile reports are available:
| Profile Type | Example | Used For |
|---|---|---|
| Profile | 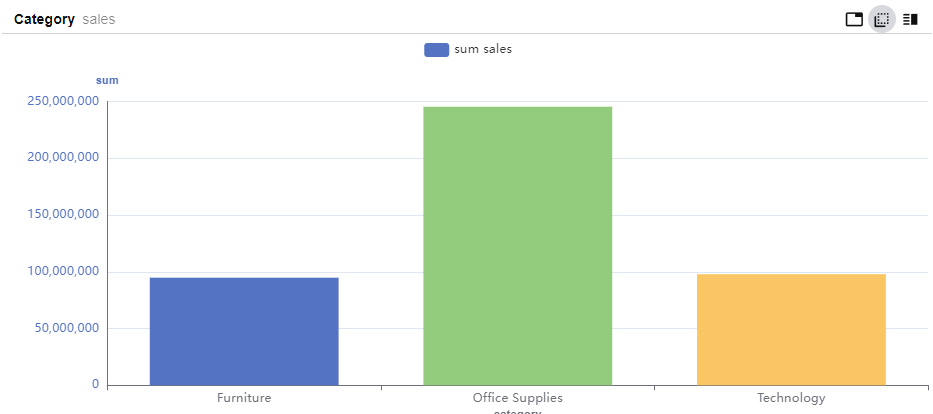 | Use for instant counts and summaries. Accessed by Database Tree right-click or from Analytics | Profile
|
| Index Profile | 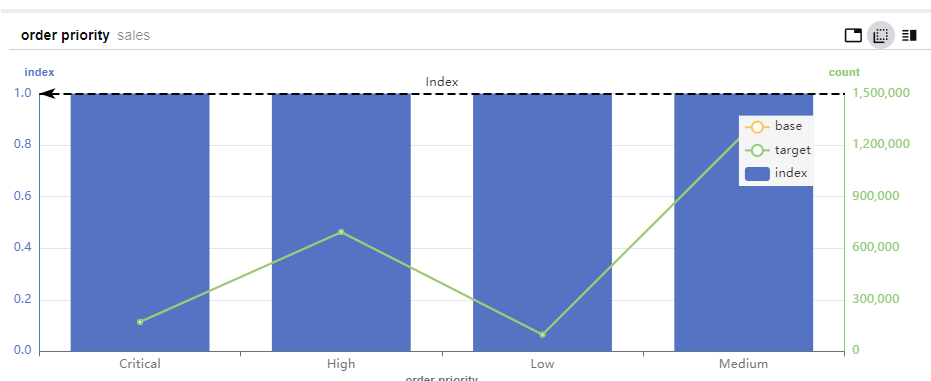 | Used to determine under and over-representation of values in datasets. Accessed by Database Tree right-click or from Analytics | Index Profile
|
| Multi-Function Profile | 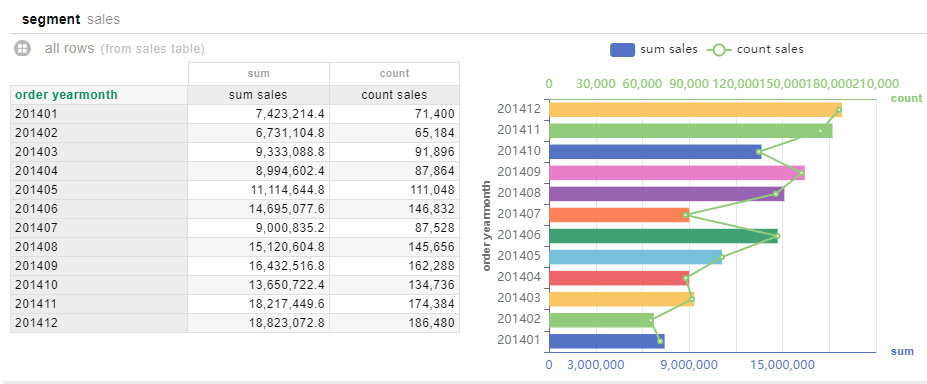 | Used for summaries and visualisations where multiple measures and/or further manipulation of results is required post-processing
|
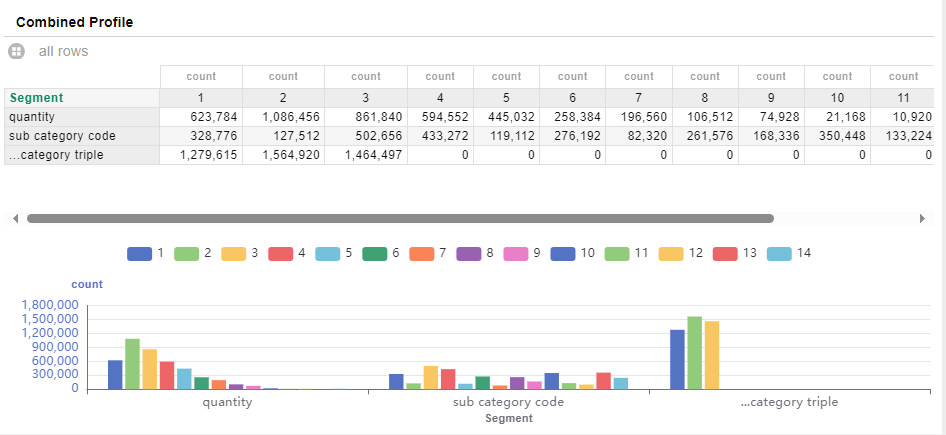 | Used to join one or more simple profiles sharing common categorical values into a single result set. Allows data from different tables to be seen in the same visualisation
| |
| Field Profile | 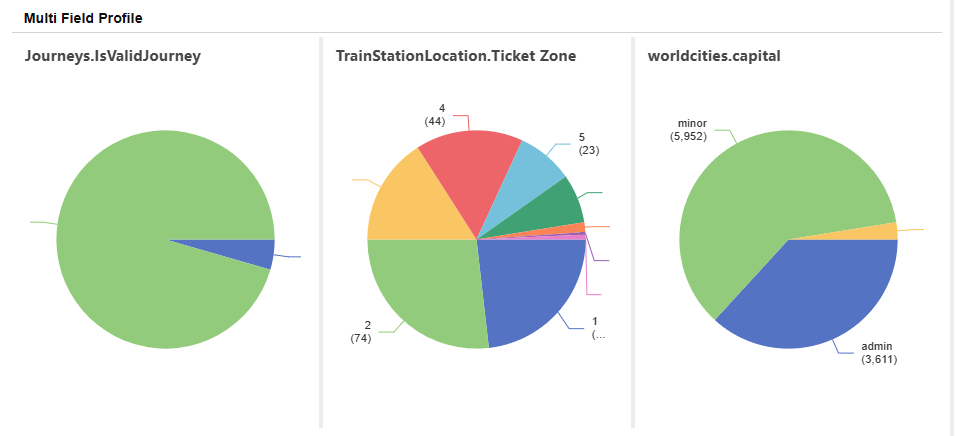 | Create individual profiles for one or more fields, showing the count of records for each discrete value in each field. |
| Query Matrix | 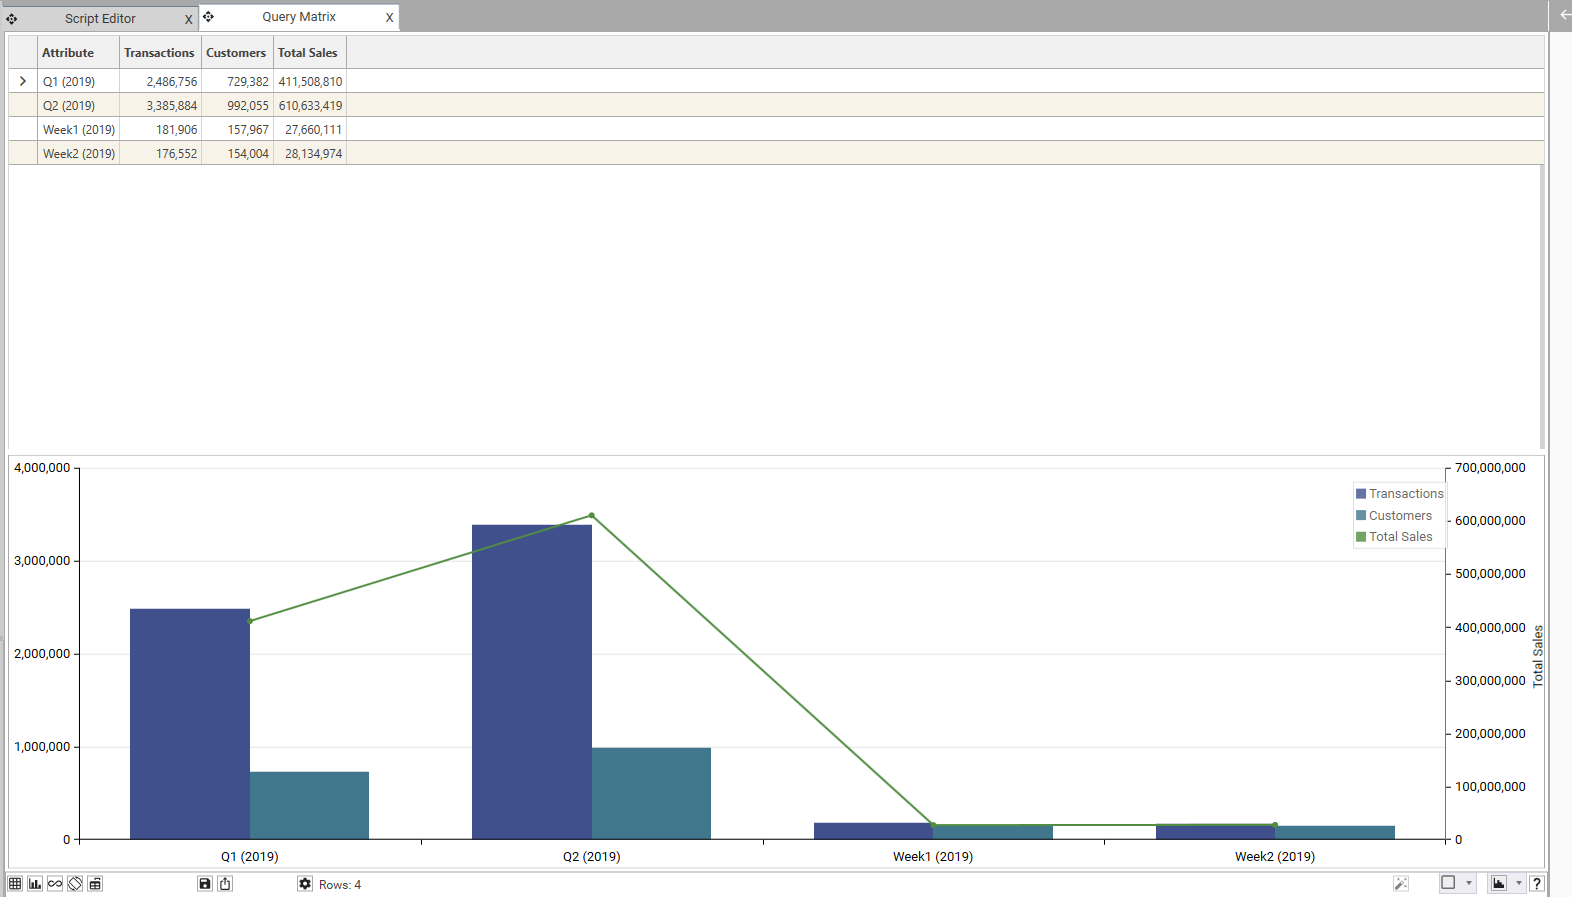 | Analyze non-exclusive or disconnected segments in the same report. Used to group segments not directly linked in the Data Model. |
(For details of other report types, see Introduction to Reporting)
For details of how to access profile reports via Project Explorer shortcuts, see Shortcuts
Tips for Working with Profiles
- Dashboards
- Shortcuts
- Duplicate
- Mass-Profile
- Auto-Dashboard