Post Function: [log]
Returns the natural logarithm of the specified measure.
log=Loge.Measure
If measure = 97,825, what power must e (2.7182818) be raised to in order to get 97,825?
log(97,825) = 11.49
or
e11.49=97,825
Purpose
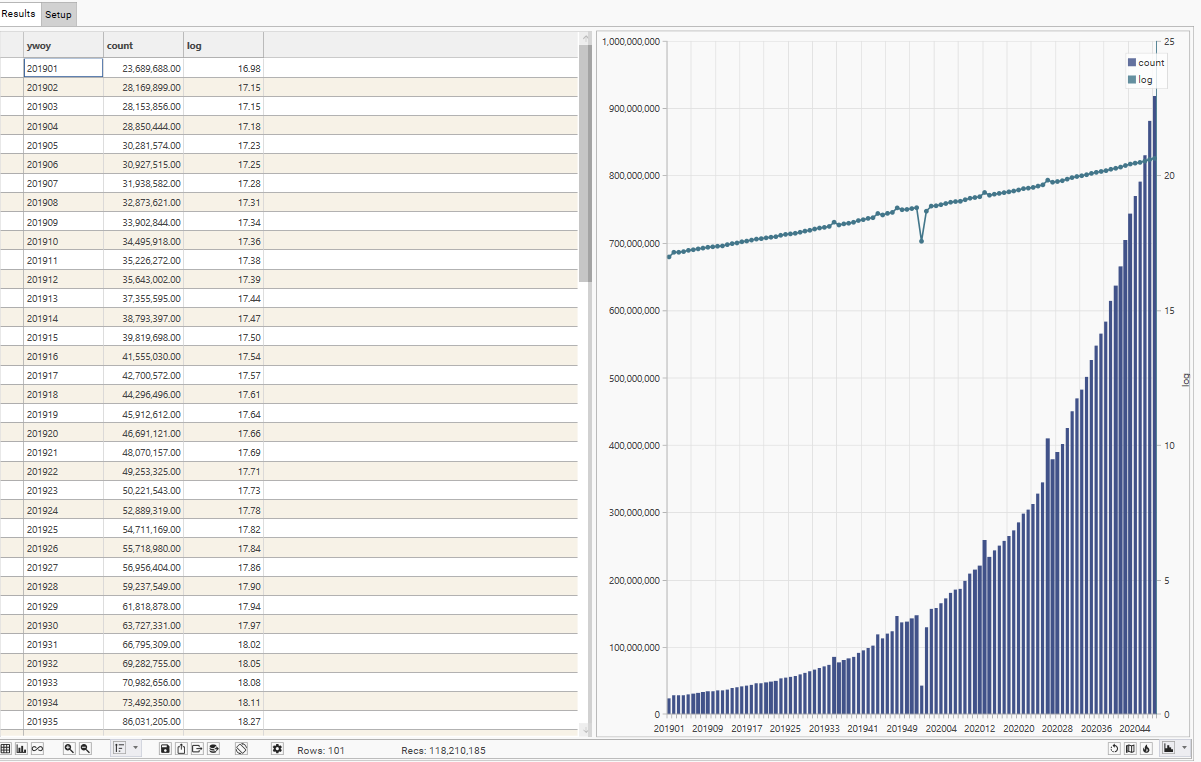
- Add a logarithmic scale to a chart
- Manage the display of heavily skewed data
Calculation
log= ln(RowX)
RowX = value for current row
ln= loge
e = 2.7182818
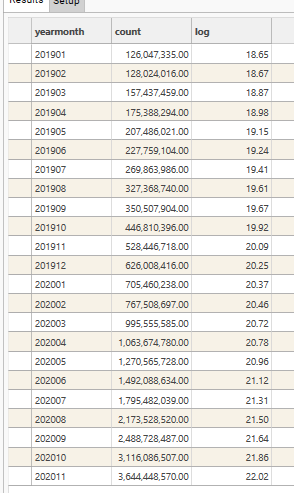
Sample Result
Parameters
Component | Description |
Dimensions | Discrete field(s). All fields must come from the same table. |
Name | Name to be displayed as Column Header in result grid |
Measure | The field to be used in the post-function calculation. Must be numeric if Function is anything other than COUNT. Must come from same table as DIMENSIONS. Supports Discrete or Continuous DataTypes. |
Function | COUNT / SUM / AVG / MIN / MAX / STDEV |
Post | log |
Value | Optional. Filter to apply when evaluating FUNCTION. Only records in the Filter Recordset will be included in the Function and Post-Function calculations. Must come from same table as DIMENSION/MEASURE or be linked to the Dimension table. |
Axis | 0 / 1. Y-Axis to use when plotting graph. Default = 0 Log functions are usually plotted on a secondary axis if they are plotted with other data. |
Plot | Y / N. Specifies whether measure’s output column should be plotted on graph. Default = Y |
Resolve | Optional. Resolve level for the measure. If blank, Resolve = Dimension Table |
Series Type | Default / Bar / Stacked Bar / Line / Spline / RangeLow / RangeHigh / CSLow / CSHigh / CSOpen / CSClose Determines the graph style for the measure. |
Popup | Default / None / Extended |
Prefix | $ / £ / E / % |
Usage Notes
{UsageNotesHere}
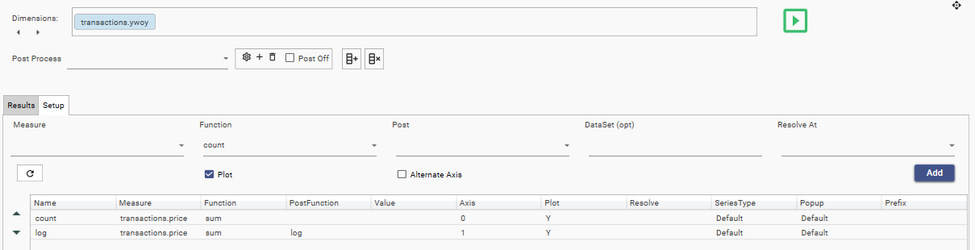
Example
NOTE: Measure 1 is included purely for illustration. It is not necessary to include this measure for the calculation to work.
Dimension: | [transactions].[ywoy] | ||
Measure 1 |
|
| |
Measure 2 |
|
| |
| |||
| |||