Calculation Options
Profile calculations can be precisely controlled by configuring statistical functions, resolution levels, result type and what kind of record is being counted.
.PNG)
Function
Statistical functions can be applied to numeric dimensions or measures:
| Count | Returns the count of the set of records. This is the default calculation type and is the only function applicable to non-numeric measures. |
| Sum | Sums the measures for the set of records |
| Min | Returns the minimum measure value for the set of records |
| Max | Returns the maximum measure value for the set of records |
| Avg | Returns the measure sum/count for the set of records |
| StDev | Returns the dispersion of data relative to the Avg for the set of records |
Show
Determines the result type to show. The default is VALUE. Not all options are valid for all profile types.
These settings are analogous to Value Field Settings | Show values as… in an excel pivot table.
Value:
Returns the function result for the records in the cell.
Total Total will be the sum of the cells.
.PNG)
Total %:
Each cell number represents the count for the set of records for the cell as a percentage of the total records in the dataset.
Displays values so that if all values were in a single column the column would add up to 100.
Total Total will be 100
.PNG)
Row %:
Only valid when at least 2 dimensions are present and a PIVOT is applied.
Displays each cell in a row as a percentage of the total records in the row.
Row total will be 100.
.PNG)
Column %:
Only valid when at least 2 dimensions are present and a PIVOT is applied.
Displays each cell in a column as a percentage of the total records in the column.
Column total will be 100
.PNG)
Resolve At
Determines the records that will be counted.
Unless explicitly set otherwise, by default, the resolution level is the table containing the first dimension in the dimension list.
Valid resolution levels are those which are on the ONE side of a ONE <- MANY join.
Consider the following relationship, where there is ONE CUSTOMER record for MANY TRANSACTION records:.PNG)
CUSTOMER <- TRANSACTION
If the dimension comes from the TRANSACTION table, the profile can be calculated at the CUSTOMER level by setting Resolution Level to CUSTOMER.
If the dimension comes from the CUSTOMER table, the profile cannot be calculated at the TRANSACTION level.
Count Distinct
Normally what is counted in a profile are the number of records in a table. However sometimes it is necessary to count the frequency with which distinct values appear – i.e. the number of distinct values in the set of records.
To count the number of distinct values, select the field to be counted in Count Distinct – if ProductName is selected, then the counts returned will be the number of distinct product names – i.e., each distinct product name is counted only once. There might be 100 records in the set, but those 100 records may refer to only 3 products. In that case, Count Distinct [ProductName] would return 3.
Note: Excel pivot tables use Helper Columns or the Data Model to calculate count distinct.
Post
Post refers to "Post Function". The Post drop-down is only available when a measure has been provided.
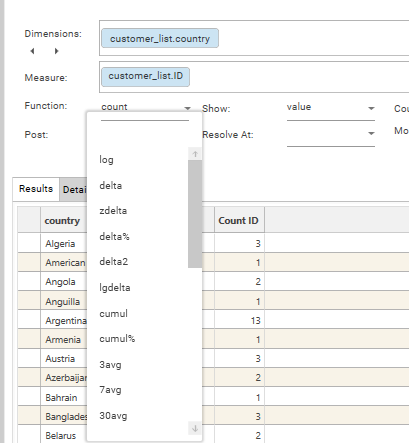
Post functions are applied to the results of the profile after it has been calculated. For full details of all the different post functions, see Post Functions - Overview
Post functions are only available when a measure has been applied. They allow for transformations of results, such as formatting of numbers, cumulating results etc.
More complex calculations can be added to profiles within the multi-function profile report, which has support for column math, date transformations and various other advanced post-processing.