Returns the difference in 7 row average between current row and previous row as a percentage of the sum of all 7 row averages
Purpose
Use this function to:
- Calculate changes in rolling 7 day averages as a percentage of overall change
Calculation
- Calculates the average for the previous seven rows [7avg(x-1)]
- Calculates average for current row and previous 6 rows [7avg(x)]
- Calculates difference between the 2 averages [delta7avg]
- Calculates sum of all 7 row averages in result set [sum7avg]
- Divides delta7avg by Sum7avg [delta7avg%]
delta7avg% = delta7avg(x) - sumDelta7avg
sumDelta7avg = sum( delta7avg[N]:delta1avg[0] )
delta7avg(x) = 7avg(x) - 7avg(x-1)
7avg(x) = sum([X]:[X-6]) / 7
7avg(x-1) = sum([X-1]:[X-7]) / 7
sum([X]:[X-6])= sum of current row and previous 6 rows
sum([X-1]:[X-7])= Sum of previous 7 rows
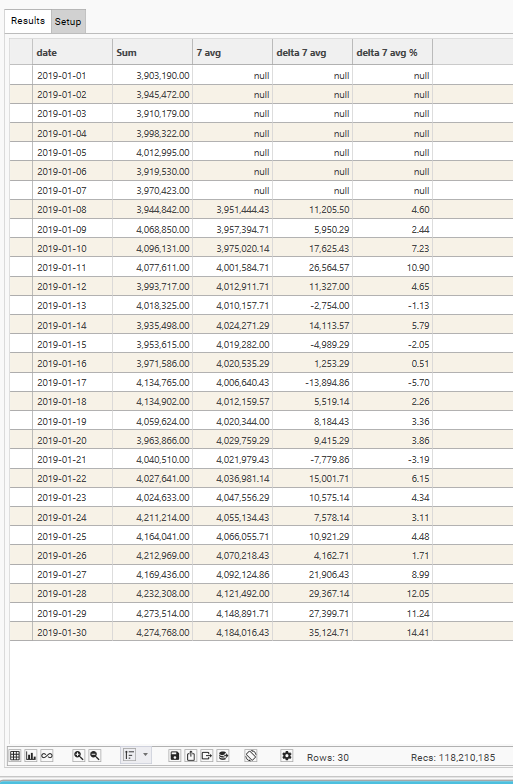
Sample Result
Parameters
| Parameter | Description |
|---|---|
| Dimensions | Discrete field(s). All fields must come from the same table. |
| Name | Name to be displayed as Column Header in result grid |
| Measure | The field to be used in the post-function calculation.
|
| Function | COUNT / SUM / AVG / MIN / MAX / STDEV |
| Post | delta7avg% |
| Value | Optional. Filter to apply when evaluating FUNCTION. Only records in the Filter Recordset will be included in the Function and Post-Function calculations. Must come from same table as DIMENSION/MEASURE or be linked to the Dimension table. |
| Axis | 0 / 1. Y-Axis to use when plotting graph. Default = 0 |
| Plot | Y / N. Specifies whether measure’s output column should be plotted on graph. Default = Y |
| Resolve | Optional. Resolve level for the measure. If blank, Resolve = Dimension Table |
| Series Type | Default / Bar / Stacked Bar / Line / Spline / RangeLow / RangeHigh / CSLow / CSHigh / CSOpen / CSClose Determines the graph style for the measure. |
| Popup | Default / None / Extended |
| Prefix | $ / £ / E / % |
Usage Notes
Delta7avg% depends on the order in which the rows are brought back from the engine (sort order Ascending / Descending, Label / Value)
Delta7avg% depends on the number of rows brought back from the engine (options: row count)
See 7avg, 7avg% and delta7avg for more details on rolling averages.
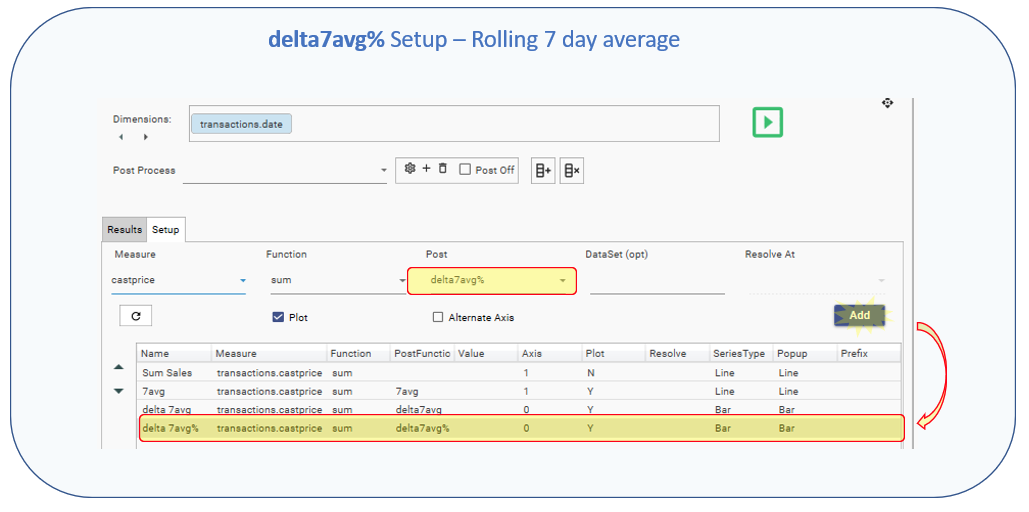
Example
- Example use: Daily change in rolling 7 day average as a percentage of total changes in rolling 7 day average
NOTE: Measures 1, 2 and 3 are included purely for illustration. It is not necessary to include these measures for the calculation to work.
Dimension: [transactions].[date]
Measure 1
- Name: = Sum
- Measure: = transactions.castprice
- Function: =sum
- Post: =
- Value: =
- Axis: =0
- Plot:=Y
- Resolve:=
- Series Type:=Default
- Popup:=Default
- Prefix:=
Measure 2
- Name: = Sum
- Measure: = transactions.castprice
- Function: =sum
- Post: =7avg
- Value: =
- Axis: =0
- Plot:=Y
- Resolve:=
- Series Type:=Default
- Popup:=Default
- Prefix:=
Measure 3
- Name: = Sum
- Measure: = transactions.castprice
- Function: =sum
- Post: =delta7avg
- Value: =
- Axis: =0
- Plot:=Y
- Resolve:=
- Series Type:=Default
- Popup:=Default
- Prefix:=
Measure 4
- Name: = Sum
- Measure: = transactions.castprice
- Function: =sum
- Post: =delta7avg%
- Value: =
- Axis: =0
- Plot:=Y
- Resolve:=
- Series Type:=Default
- Popup:=Default
- Prefix:=
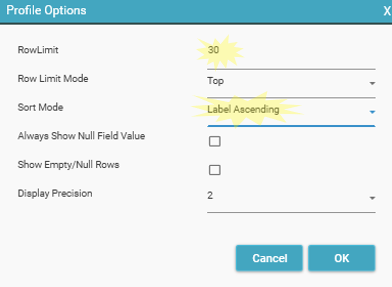
Options: Row Count = 30
Sort Order: [Ascending Label]