PostFunction: [delta%]
Returns the change between rows as a percentage of the total change between the first and last rows in the result-table.
- Calculates the difference between current row and previous row (deltaX)
- Calculates the total change between the last row in the data set and the first row in the data set (TotalChange)
- Divides the difference for current row by the total change (deltaX / TotalChange)
Purpose
- See change as a percentage of overall change from first row to last row
- Calculate percentage change contribution for each reporting per
Calculation
Delta% = Delta(X) / TotalChange

Row(N) = "value for last row in resultset"
Row(0) = "value for first row in resultset"
Row(X) = "value for current row"
Row(X-1) = "value for previous row"
Delta(X) = Row(X) - Row(X-1)
TotalChange = Row(N) - Row(0)
Sample Result
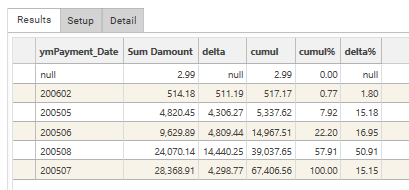
Parameters
| Input | Description |
|---|---|
Dimensions | Discrete field(s). All fields must come from the same table. |
Name | Name to be displayed as Column Header in result grid |
Measure | The field to be used in the post-function calculation. Must be numeric if Function is anything other than COUNT. Must come from same table as DIMENSIONS. Supports Discrete or Continuous DataTypes. |
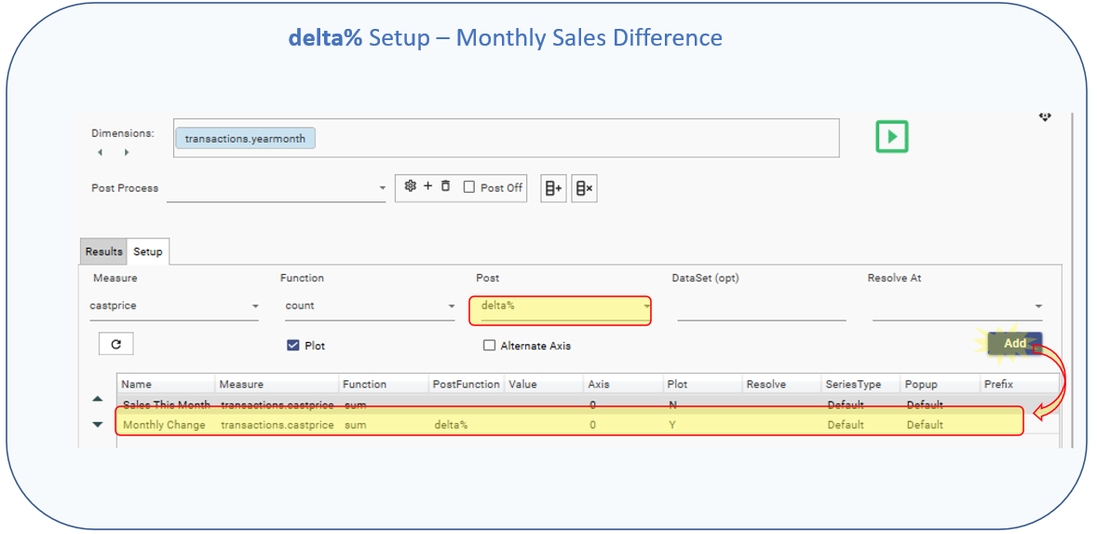
Function | COUNT / SUM / AVG / MIN / MAX / STDEV |
Post | delta |
Value | Optional. Filter to apply when evaluating FUNCTION. Only records in the Filter Recordset will be included in the Function and Post-Function calculations. Must come from same table as DIMENSION/MEASURE or be linked to the Dimension table. |
Axis | 0 / 1. Y-Axis to use when plotting graph. Default = 0 |
Plot | Y / N. Specifies whether measure’s output column should be plotted on graph. Default = Y |
Resolve | Optional. Resolve level for the measure. If blank, Resolve = Dimension Table |
Series Type | Default / Bar / Stacked Bar / Line / Spline / RangeLow / RangeHigh / CSLow / CSHigh / CSOpen / CSClose Determines the graph style for the measure. |
Popup | Default / None / Extended |
Prefix | $ / £ / E / % |
Usage Notes
- Calculates the difference between current row and previous row (deltaX)
- Calculates the total change between the last row in the data set and the first row in the data set (TotalChange)
- Divides the difference for current row by the total change (deltaX / TotalChange)
Example
Calculate monthly sales growth as a percentage of total change over the period.
| Dimension(s): | [Transactions].[YearMonth] | |
Measure 1 |
|
|
Measure 2 |
|
|
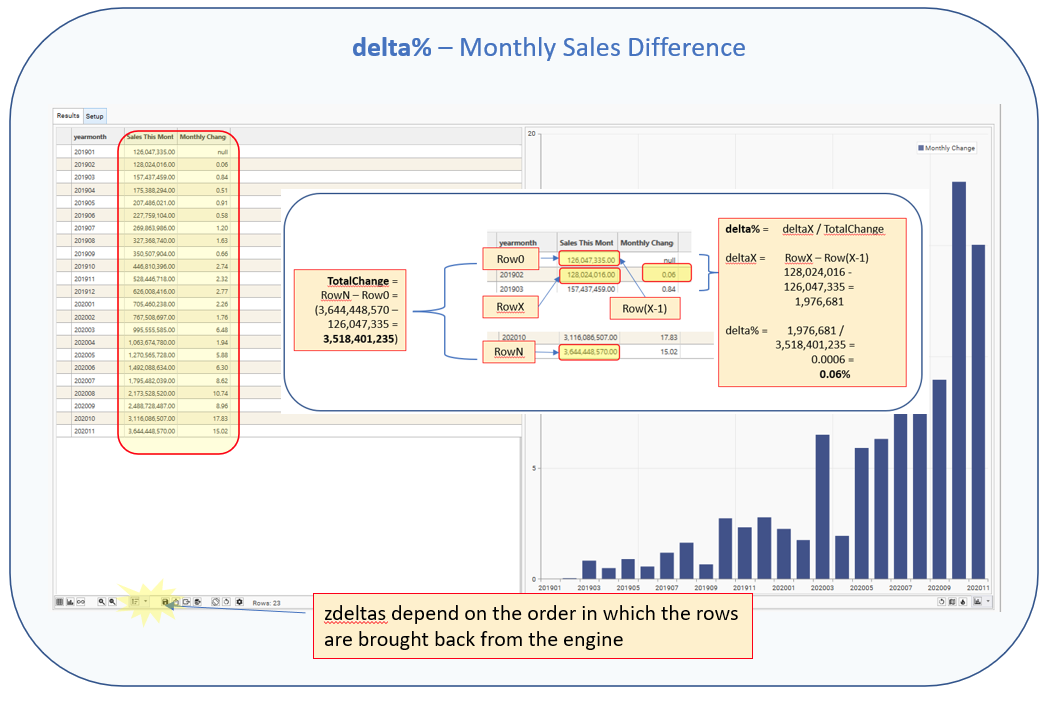
Here we can see that the period [200009 to 200010] had 17.83% of the total growth over the period.