Dashboard
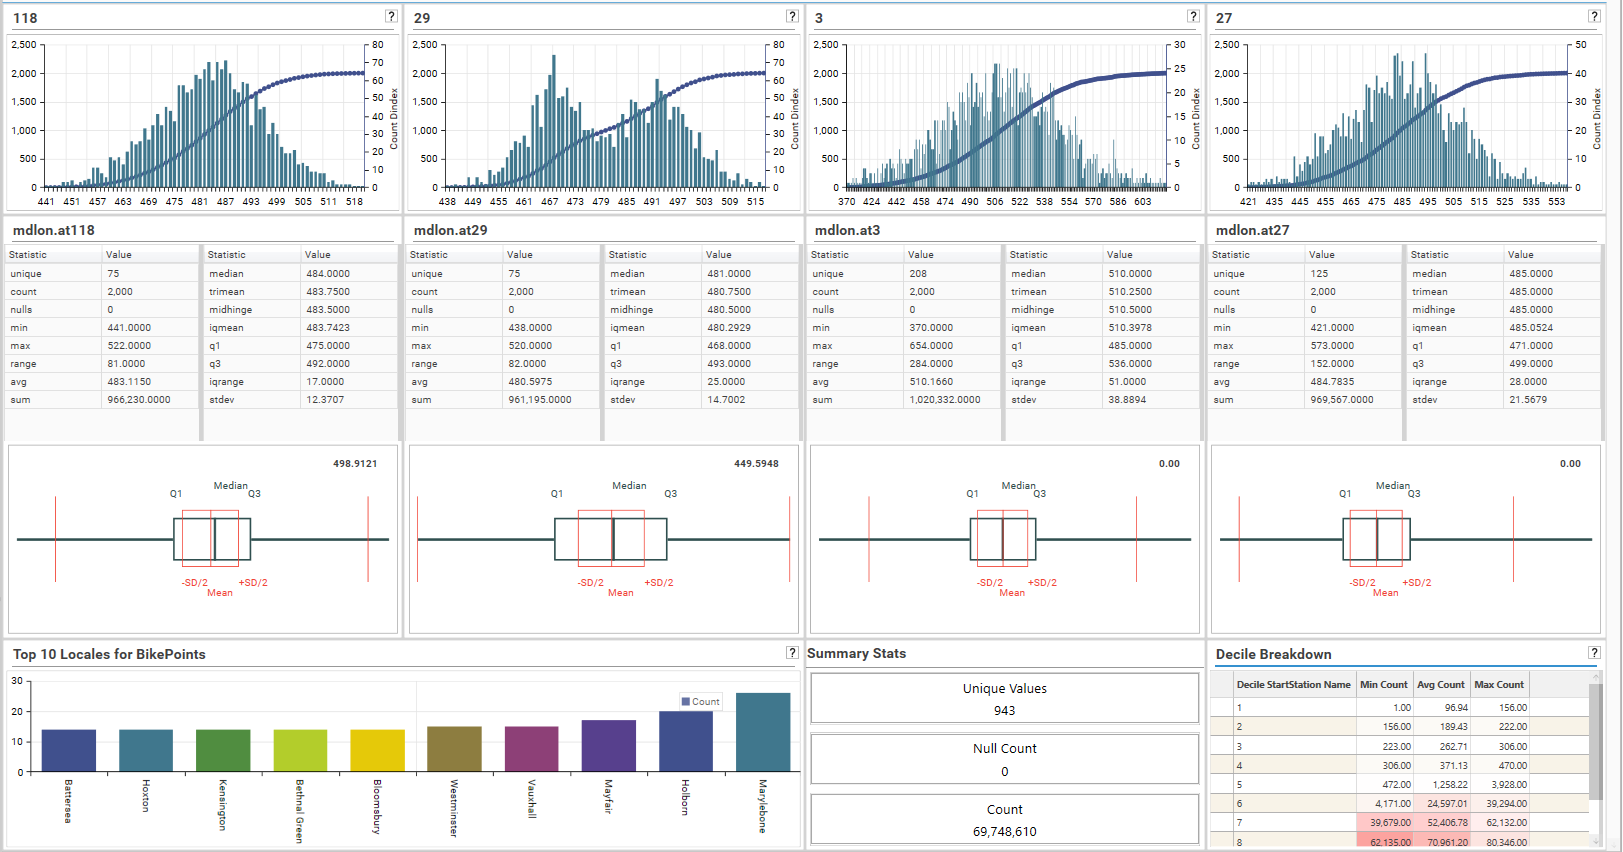
Dashboards are used to collect, present, publish and distribute sets of analytical components as Reports
From the main menu, select Analytics - Dashboard and choose a starting grid size.
- Medium Grid has 4 slots
- Small Grid has 16 slots
- Tiny Grid has 25 slots
Once created, slots can be expanded vertically and horizontally - so the most important factor in choosing a grid size is how small an individual slot can be.
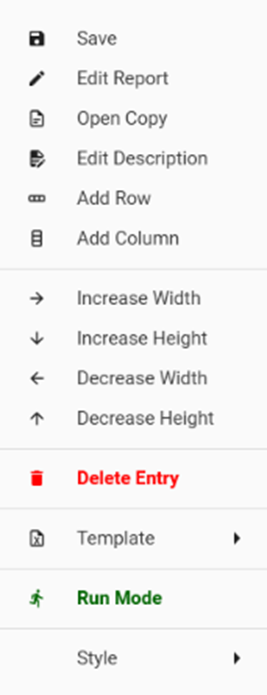
The dashboard grid will open in design more. In design mode each slot will have an orange border:
![]()
Switch between design and run mode with the tool bar Toggle button:
In design mode, Right-click a slot to open the design mode context menu.
Select Save or Click the Save button to save the dashboard, enter a name, description and any tags required.
Once saved, the dashboard will appear in the Report Tab of Solution Explorer.
Slots
Drop analytical components into slots by dragging either from the Report Tab or an already open screen.
Via the context menu, increase or decrease the width and height of a slot; or remove it with Delete Entry.
Use Add Row or Add Column to entire rows and columns of slots; Each new slot will be of the same dimension as the initial dashboard size selection.
Added columns will for a resize of the dashboard space. There is a maximum of 4 columns.
Adding rows forms a scrollable dashboard, it does not change the slot size.
View in Browser
To preview the dashboard in a browser, hit the Preview button on the micro toolbar.
Run Time Menu
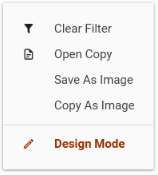
Any DataSet dropped onto the dashboard can be cleared by clicking the Clear Filter button or by selecting Clear Filter from the run time context menu.
Select Open Copy to open a copy if the selected component report in a new tab.
An image of the dashboard can be Saved to file or Copied to the clipboard for pasting into another application/email etc.
Exporting
The data models behind the dashboard entries can be exported to Excel by clicking the Export button.