Overview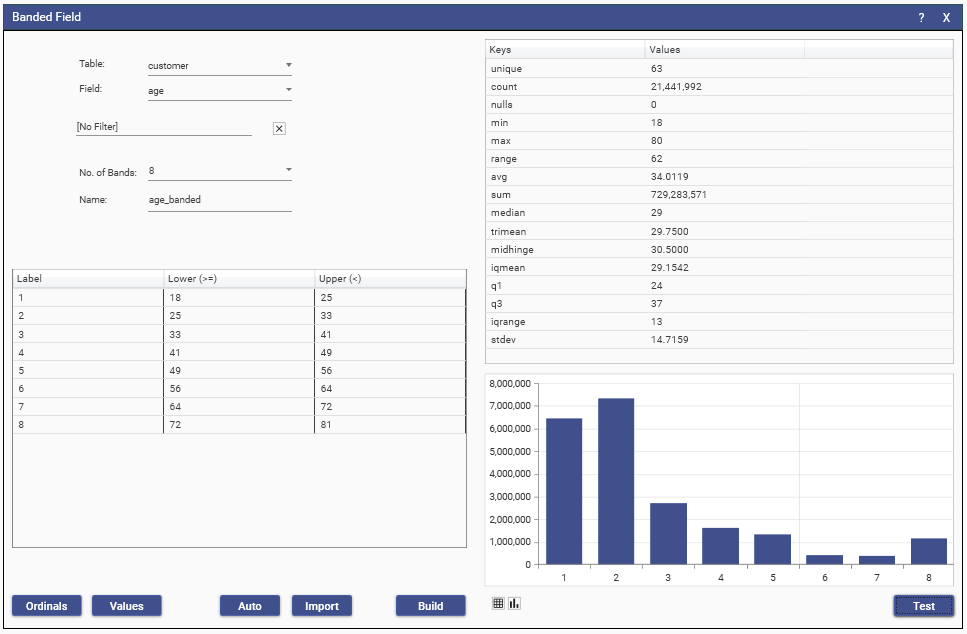
When a numeric field is continuous or has too many unique values to be usefully analysed visually we can create a new banded field.
Banded fields are created form a set of value ranges and a label that is associated with each range.
Creating
Select a table and then the field to be banded.
By default all records for that field will be associated with a band, but apply a filter to build the band from only a sub set of the table.
All records that are either not in the filter (if there is one) or do not fall into any of the bands will be assigned a null value.
Select the number of bands to create from the combo, if none of the drop-down values suit then simply type the number of bands.
The field can be split into between 2 and 128 bands.
For each band in the grid, enter a label, a lower inclusive value and an upper exclusive value for that band.
If the ranges overlap, a record will be assigned to the first band it fits into.
The Auto button will create evenly spaced ranges for you, and the Ordinal and Values button will create different formats of label from these ranges.
Test the definition and display as grid or graph using the icon tools.
To create the banded field, name it and hit the Build button.
Tip:
Where possible, a statistically summary of the field is display - this can help determine how to configure the bands.
Definitions can be imported from a 3 column delimited file (label, lower, upper)
They can also be pasted from 3 columns copied from Excel
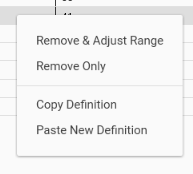
To delete or merge rows use the grids right-click context menu