Overview
The Analyze Segments report calculates overlaps and indexes for segments and datasets with the signal data, and is used to identify characteristics of interest for audience building as well as further investigation and modelling.
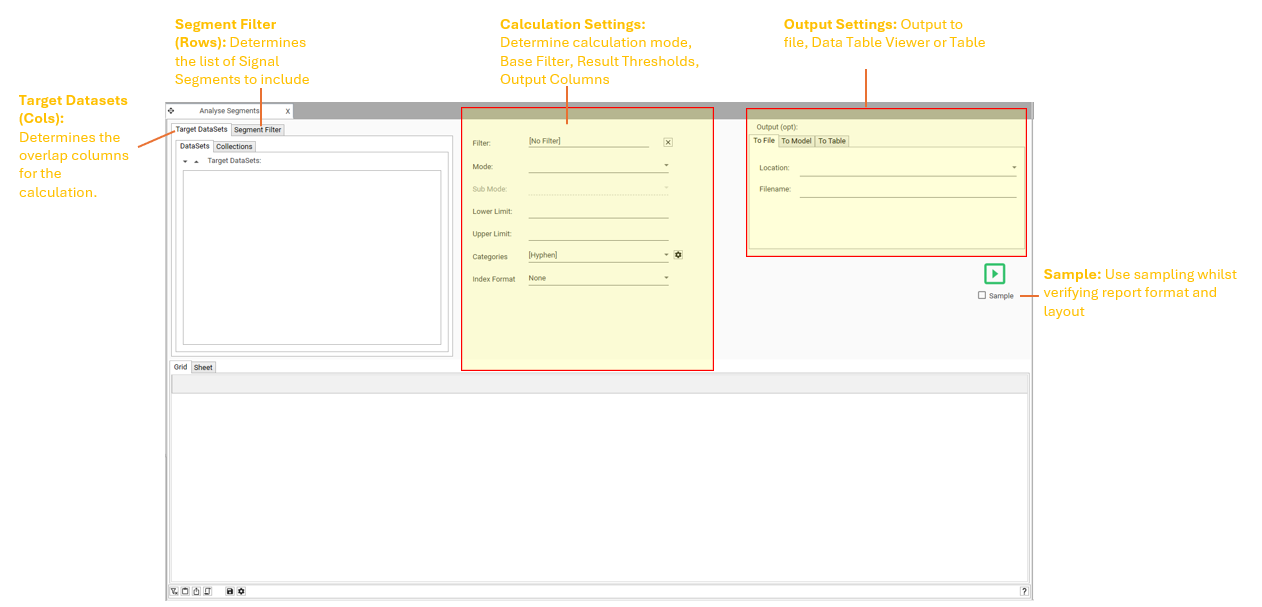
Access the report from Analytics | Analyze Segments:
Required Inputs
For the Analyze Segment report to run, the following inputs are required:
- Target Dataset(s)
- A set of Segment IDs
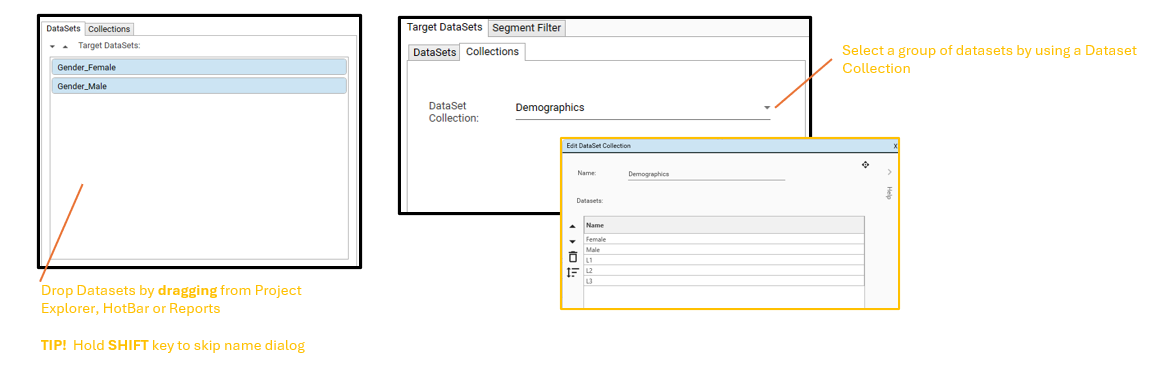
Target Dataset
- One or more Target Datasets- these can be provided as individual datasets, or as part of a collection.
- NOTE: Target Datasets represent the primary groups being analysed. Typically these are:
- Profiling fields: Data attributes (e.g., demographics, behaviours) used to characterize populations, such as Age/Generation, Gender, Income, Occupation etc
- Population(s) of interest: Specific groups, such as Recent Purchasers, selected for comparison.
- Target Datasets must be ON or LINKED TO the PRIMARY CONTACT TABLE (this is the table that contains the unique Signal IDs. Example names of the PCT are Entities, DATA_EYE etc)
- See Target Dataset Selection for an overview of working with Target Datasets
- The report will calculate overlaps such as, "How many records in each Segment are ALSO in Target Dataset 1".
- NOTE: Target Datasets represent the primary groups being analysed. Typically these are:
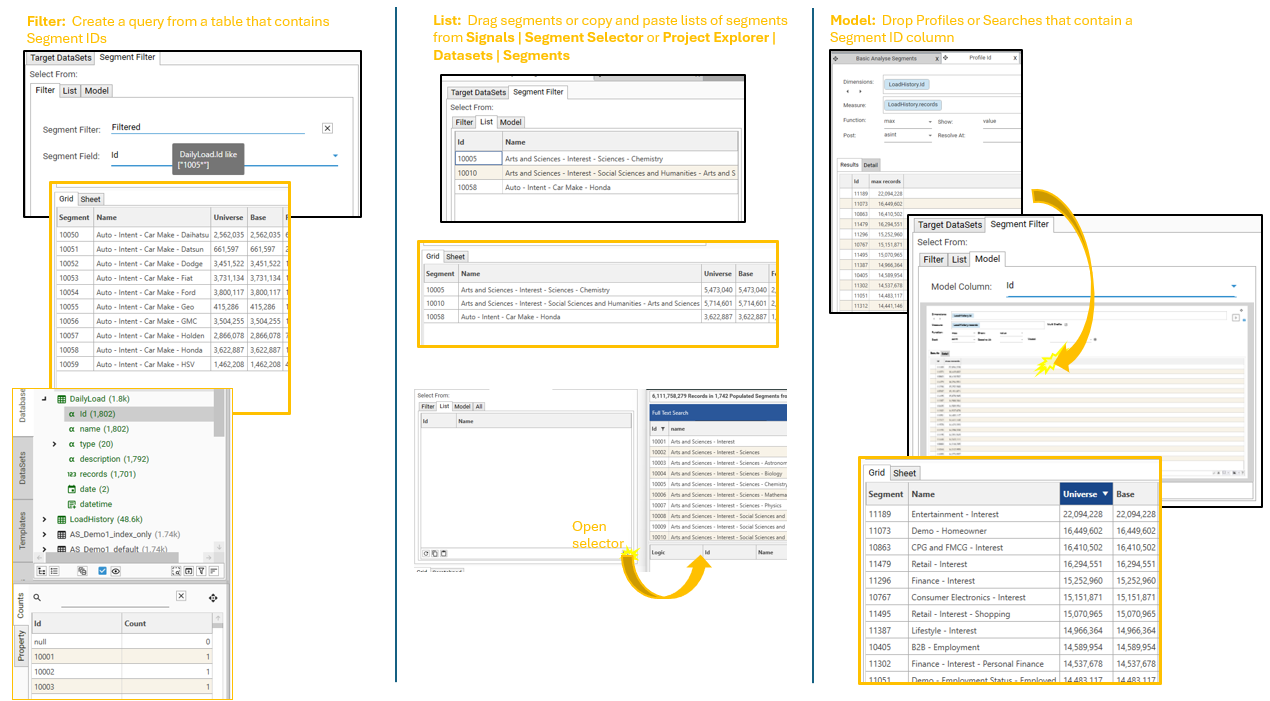
Segment IDs
- At least 1 Segment ID must be provided for Analyze Segments to run. One output row will be generated for every segment that is analysed.
- Segment IDs can be selected in the following ways:
- Filter: A query that produces a column containing Segment IDs that match the Segment IDs in the Signal database.
- List: A fixed list of Segment IDs, generated from one of the following:
- Project Explorer | Datasets | Segments
- Signals | Segment Selector
- Analyze Segments | Segment Filter | Open Segment Selector
- Model: Dynamic segment lists can be generated using the following:
- Profile: Create a profile of Segment ID from a table that contains a Segment ID column (e.g., the Load History table).
- Advanced Search:
Calculation Settings
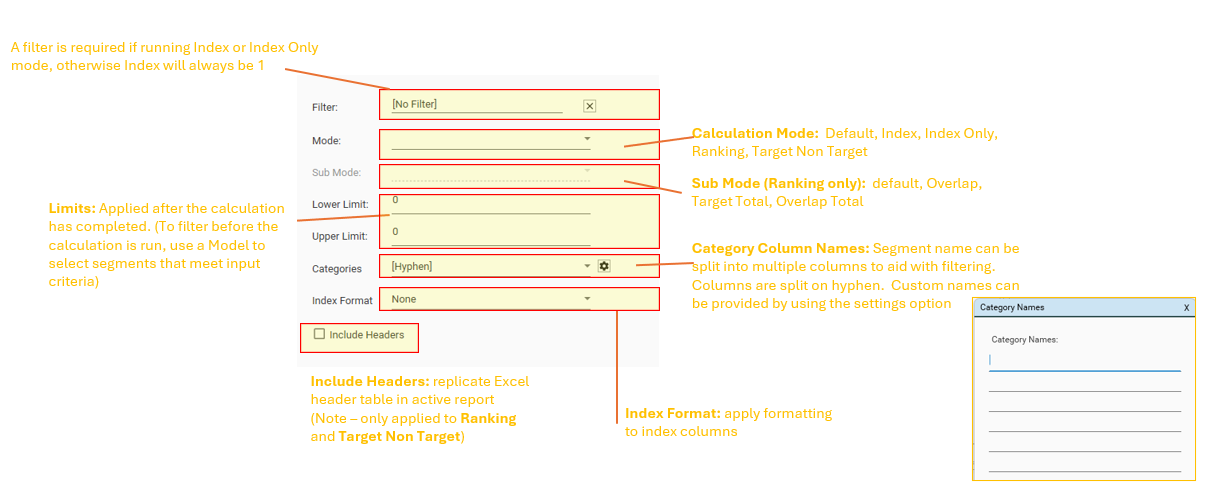
Calculation Modes
The following calculation modes are available:
- Default / Blank (Count): Returns a target and overlap column for each provided target dataset
- Index: Returns a target, overlap and index column for each provided target dataset
- Index Only: Returns an index column for each provided target dataset
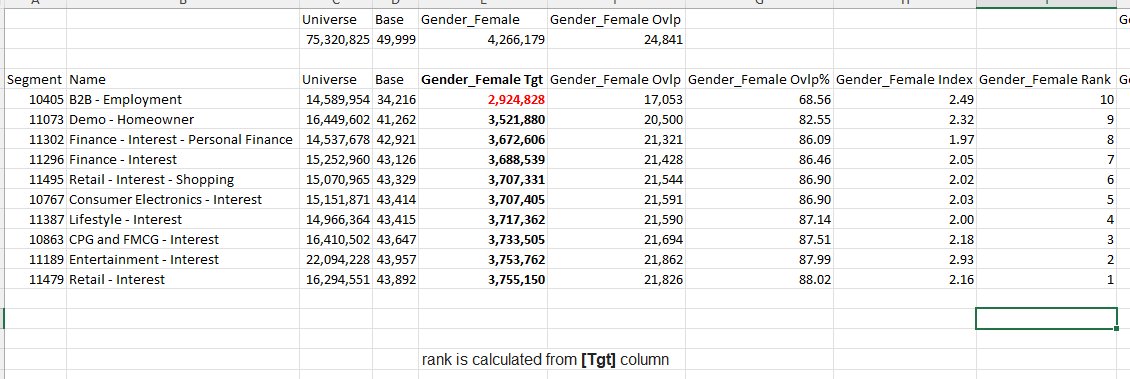
- Ranking: Ranking has the following modes:
- default - rank is calculated from [Tgt] column
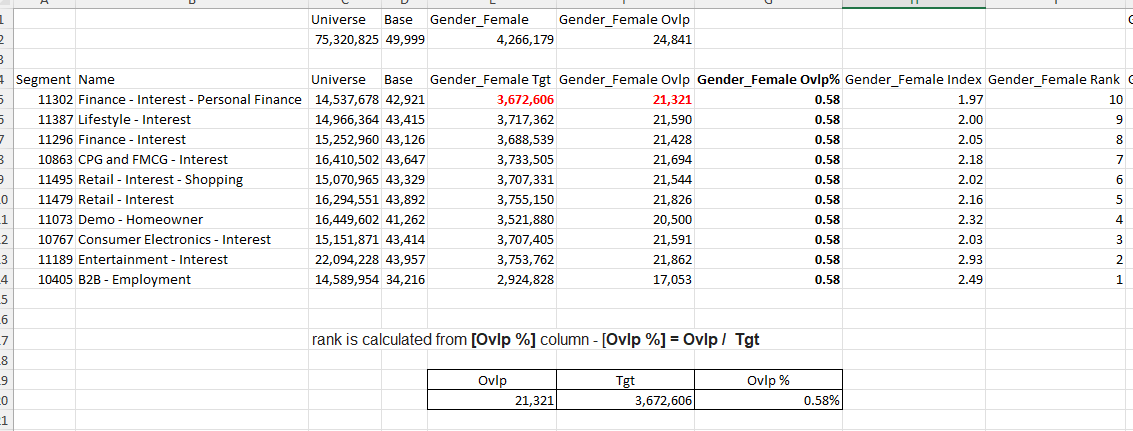
- Overlap - rank is calculated from [Ovlp %] column - [Ovlp %] = Ovlp / Tgt
- Target Total - rank is calculated on [Ovlp %] column - [Ovlp %] = target / target total
- Overlap Total - rank is calculated on [Ovlp %] column - [Ovlp %] = overlap / overlap total
- Target Non Target
Ranking Modes
Ranking: sub-mode = default/none
Ranking: sub-mode = overlap
Ranking: sub-mode = target total

Ranking: sub-mode = overlap total

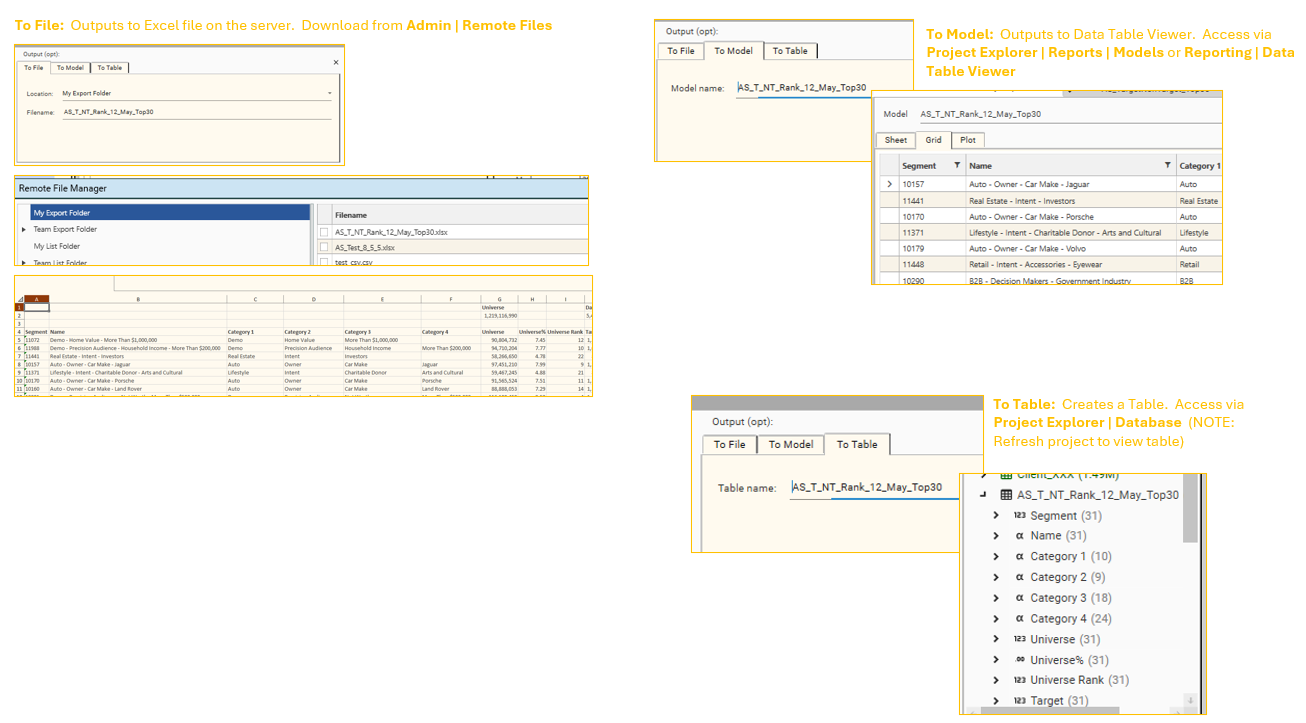
Output
Output to:
- File - an excel file will be created on the server
- Model - a data table model will be added to the system and can be accessed via Project Explorer | Reports | Models
- Table - a table will be created and can be accessed via Project Explorer | Database
Use the "Export to Excel" button on the micro-toolbar to export the results to Excel
See AnalyseSegments for details of output columns and calculation details
Interacting with Results
It is possible to interact with the output of the Analyze Segments report in the following ways:
- Extract Datasets - select cells from the grid tab and drag to Hotbar
- Use the scratchpad tab to perform ad-hoc calculations and apply formatting
- Output current display to Excel
- Send the JSON for the current report to script
Saving Reports
Analyze Segment reports can be saved and reopened. When the report is reopened it will be in Sample Mode by default.