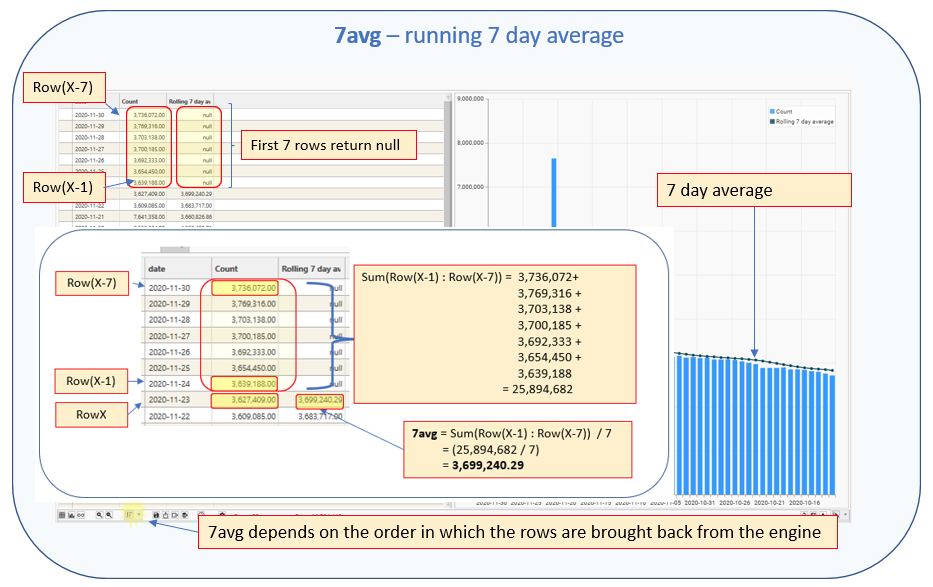
Returns the mean of the previous seven rows
Takes the previous 7 rows, adds them up, and divides by 7.
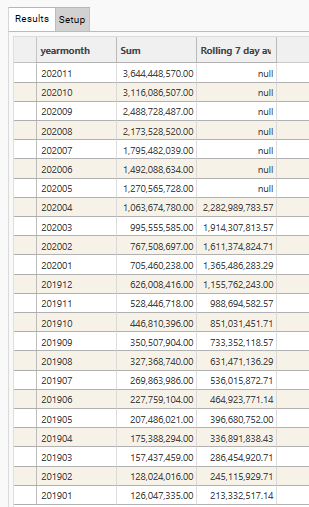
The first 7 rows will return NULL
Purpose
Use this function to:
- Calculate moving 7 day average
- Smooth out peaks and troughs in data series
Calculation
7avg = Sum([x-1]:[x-7]) / 7

Row(X-1) = previous row

Row(X-7) = seventh previous row

sum([X-1]:[X-7]) = sum of previous 7 rows in result set
Sample Result
Parameters
| Parameter | Description |
|---|---|
| Dimensions | Discrete field(s). All fields must come from the same table. |
| Name | Name to be displayed as Column Header in result grid |
| Measure | The field to be used in the post-function calculation.
|
| Function | COUNT / SUM / AVG / MIN / MAX / STDEV |
| Post | 7avg |
| Value | Optional. Filter to apply when evaluating FUNCTION. Only records in the Filter Recordset will be included in the Function and Post-Function calculations. Must come from same table as DIMENSION/MEASURE or be linked to the Dimension table. |
| Axis | 0 / 1. Y-Axis to use when plotting graph. Default = 0 |
| Plot | Y / N. Specifies whether measure’s output column should be plotted on graph. Default = Y |
| Resolve | Optional. Resolve level for the measure. If blank, Resolve = Dimension Table |
| Series Type | Default / Bar / Stacked Bar / Line / Spline / RangeLow / RangeHigh / CSLow / CSHigh / CSOpen / CSClose Determines the graph style for the measure. |
| Popup | Default / None / Extended |
| Prefix | $ / £ / E / % |
Usage Notes
Use 7day to smooth out a data series and help identify long-term trends.
See Post Processing - MovingAverage for more rolling average options.
Example
- Example use: Running 7 day average for sales
- e.g Running 7 day average Total of sales. Adds the last 7 days sales figures and divides by 7 to get the mean.
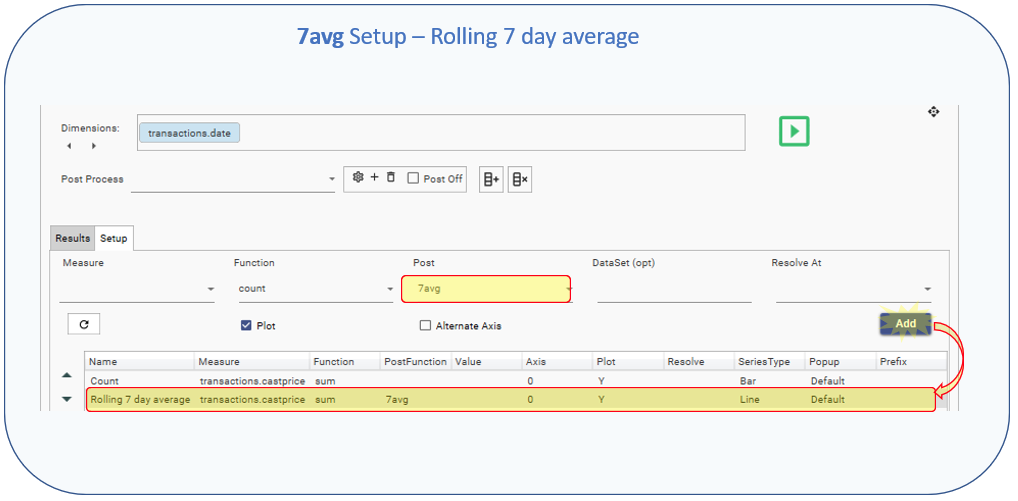
NOTE: Measure 1 is included purely for illustration. It is not necessary to include this measure for the calculation to work.
Dimension: [transactions].[date]
Measure 1
- Name: = Sum
- Measure: = transactions.castprice
- Function: = Sum
- Post: =
- Value: =
- Axis: =0
- Plot:=Y
- Resolve:=
- Series Type:=Bar
- Popup:=Default
- Prefix:=
Measure 2
- Name: = Rolling 7 day average
- Measure: = transactions.castprice
- Function: = Sum
- Post: = 7avg
- Value: =
- Axis: =0
- Plot:=Y
- Resolve:=
- Series Type:=Line
- Popup:=Default
- Prefix:=