Returns the Z-score for the current row and result set
Purpose
Use this function to:
- Measure the distance of the observation from the average
- Calculate the standardized distance from the mean
Calculation
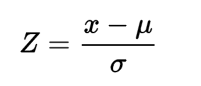
z = standard score
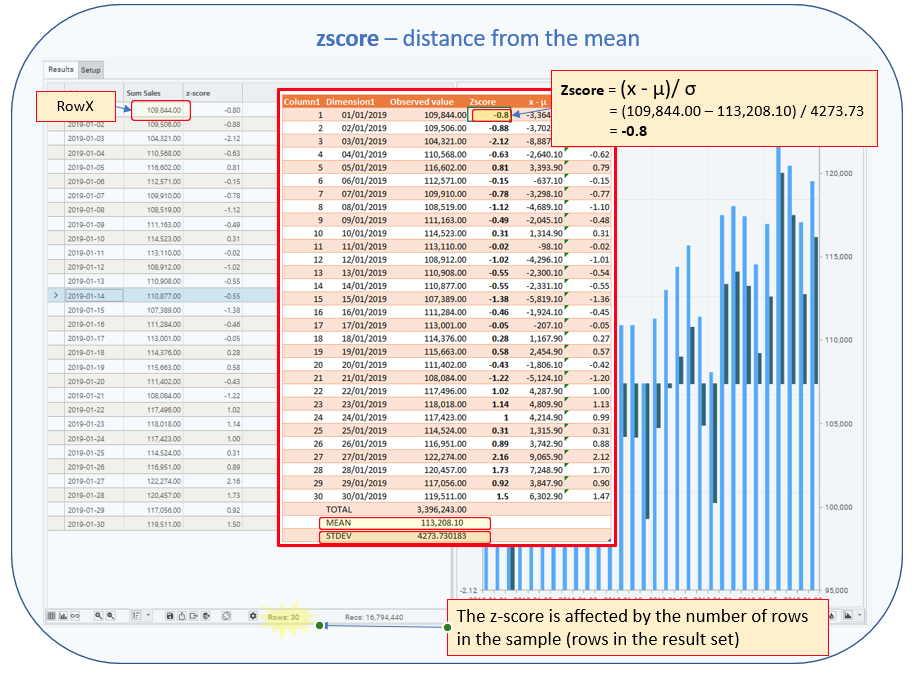
x = observed value (RowX)
μ = mean of population
σ = standard deviation of the population
where
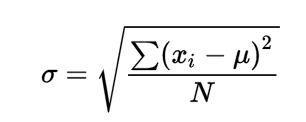
μ = Sum(RowN:Row0) / N
N = number of rows in result set
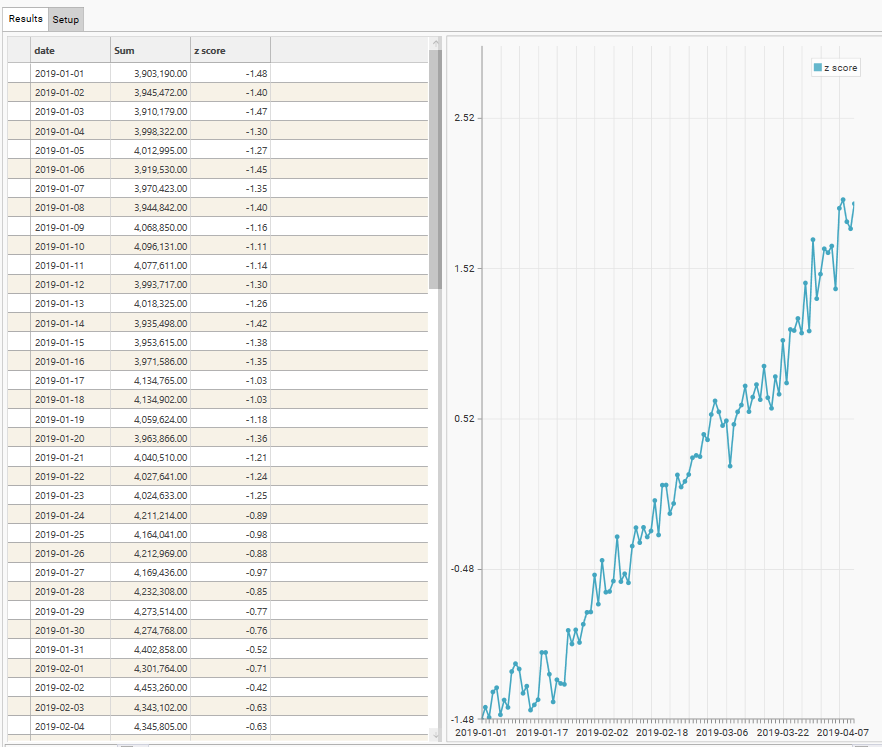
Sample Result
Parameters
| Parameter | Description |
|---|---|
| Dimensions | Discrete field(s). All fields must come from the same table. |
| Name | Name to be displayed as Column Header in result grid |
| Measure | The field to be used in the post-function calculation.
|
| Function | COUNT / SUM / AVG / MIN / MAX / STDEV |
| Post | zscore |
| Value | Optional. Filter to apply when evaluating FUNCTION. Only records in the Filter Recordset will be included in the Function and Post-Function calculations. Must come from same table as DIMENSION/MEASURE or be linked to the Dimension table. |
| Axis | 0 / 1. Y-Axis to use when plotting graph. Default = 0 |
| Plot | Y / N. Specifies whether measure’s output column should be plotted on graph. Default = Y |
| Resolve | Optional. Resolve level for the measure. If blank, Resolve = Dimension Table |
| Series Type | Default / Bar / Stacked Bar / Line / Spline / RangeLow / RangeHigh / CSLow / CSHigh / CSOpen / CSClose Determines the graph style for the measure. |
| Popup | Default / None / Extended |
| Prefix | $ / £ / E / % |
Usage Notes
A Z-score is a numerical measurement that describes a value's relationship to the mean of a group of values. Z-score is measured in terms of standard deviations from the mean. If a Z-score is 0, it indicates that the data point's score is identical to the mean score. A Z-score of 1.0 would indicate a value that is one standard deviation from the mean. Z-scores may be positive or negative, with a positive value indicating the score is above the mean and a negative score indicating it is below the mean.
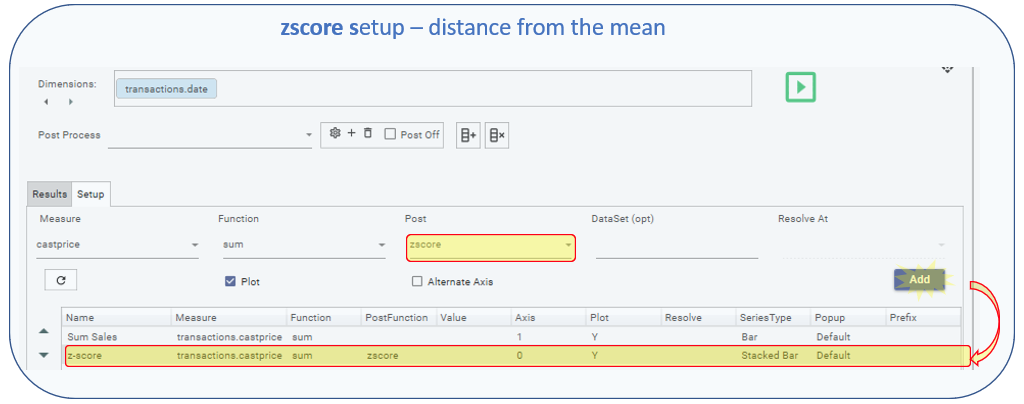
Example
- Example use: calculating the standardized distance from the mean
NOTE: Measure 1 is included purely for illustration. It is not necessary to include this measure for the calculation to work.
Dimension:[transactions].[date]
Measure 1
- Name: = sum sales
- Measure: = transactions.castprice
- Function: = sum
- Post: =
- Value: =
- Axis: =0
- Plot:=Y
- Resolve:=
- Series Type:=Default
- Popup:=Default
- Prefix:=
Measure 2
- Name: = z score
- Measure: = transactions.castprice
- Function: = sum
- Post: = zscore
- Value: =
- Axis: =0
- Plot:=Y
- Resolve:=
- Series Type:=Default
- Popup:=Default
- Prefix:=
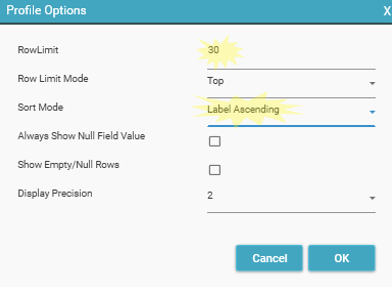
Options
- Row Count = 30
- Sort Order: [Ascending Label]