The Integrated Model Processor (for both R and Python) takes as input a Profile Result Grid. Profiles can be calculated on dimensions of up to 1 million discrete rows (although it is recommended to keep the number lower than this - ideally no more than 100,000 discrete values).
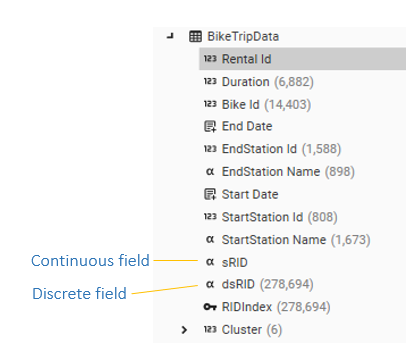
Discrete indexes are not built for fields with more than X discrete values - on large tables this may mean that a field that needs to be used as a profile dimension is stored as a continuous field and so cannot be added to the Multi-Function Profile report. A field is discrete if it has a number after it in the Database Tree:
An attempt to add a continuous field as a dimension will generate the following message:
"Continuous fields cannot be profiled."
There are several ways of working around this to prepare data for processing in R or Python.
- Export Table Data to file and load the file into native R/Python environment as required (Note: this is not using the integrated model processing, but may be the desired approach)
- Create a sample of the large table and work with the smaller sample table
- Create a discrete dimension field on the original table
Export Table Data to file
Preparing and then exporting data tables in DataJet is quick and easy to do, regardless of data-size, so this may be the most efficient way of working with existing R or Python models. To export data do the following:
- Open the table in data-view:
- Database Tree | Table Object | Right-Click | DataView.
- Drag table object into DataSet Hotbar, then Right-Click | Open Copy
- Drag the table object into the workspace and open as a new tab
- Drag the table or individual fields onto the table grid to add columns to the template. To edit the template, right-click on the table grid and choose Edit Template
- Filter data by dropping DataSets onto the grid. Common actions are:
- Remove nulls from a column
- Remove outliers (i.e., negative field values, values above or below a certain limit)
- Remove fields of a specific value
- Apply a random sample
- When the data is ready, select the Export Data option from the Data View micro-toolbar. This will create a delimited file. Depending on the number of records it may also be possible to export to a spreadsheet.
Once the data has been exported, it can be imported into a python or R environment as necessary
Create a sample table
Creating a sample table from a larger table is easy to do. First prepare the data using one of the following methods:
- Open the table in data-view:
- Database Tree | Table Object | Right-Click | DataView.
- Drag table object into DataSet Hotbar, then Right-Click | Open Copy
- Drag the table object into the workspace and open as a new tab
- Drag the table or individual fields onto the table grid to add columns to the template. To edit the template, right-click on the table grid and choose Edit Template
- Filter data until it has less than a million rows (100,000 is a good number for a sample table) by dropping DataSets onto the grid or using the right-click menu. Common actions are:
- Remove nulls from a column
- Remove outliers (i.e., negative field values, values above or below a certain limit)
- Remove fields of a specific value
- Apply a random sample
- When the data is ready, select the Export To Table option from the Data View micro-toolbar. This will create a new table that can then be used by the integrated model processor.
Create a Discrete Dimension Field
These steps allow a profile results grid to be created for a continuous record ID on a very large table:
- Create a dataset that samples the data
- Create a discrete index field
- If there is no unique record ID field on the table, create one using Engineering | IntegerSequenceKey
- Engineering | String | CTOD to create a filtered copy of the record ID field:
- A = unique record ID field
- Filter = sample dataset
- Name = SampleRecordID
- Prepare Source Data - a profile results grid
- open Multi-Function profile report
- Add new field as dimension
- Add modelling data as measures
- Calculate to obtain raw result grid
- Modify as necessary to prepare data for the model. Common actions are:
- Remove nulls from a column
- Remove outliers (i.e., negative field values, values above or below a certain limit)
- Remove fields of a specific value
- Apply a random sample
- Run model
- Select integrated model in the Model drop down of the Multi-Function profile report
- Set up model parameters
- Calculate report
To work in the model processor directly:
- Open Model Processor (Engineering | Programmed Field | Model Processor | R or Python
- Select the desired model from either the user or system library and choose <- Use to move it processing panel
- Drag the tab or report containing the prepared raw data and drop it into the Model Processor Source Panel
- Set up parameters
- Test Model output
- Make changes to model as necessary
- Save changes to model by pushing to library