Calculates a moving average across a configurable number of rows
Purpose
Use this function to:
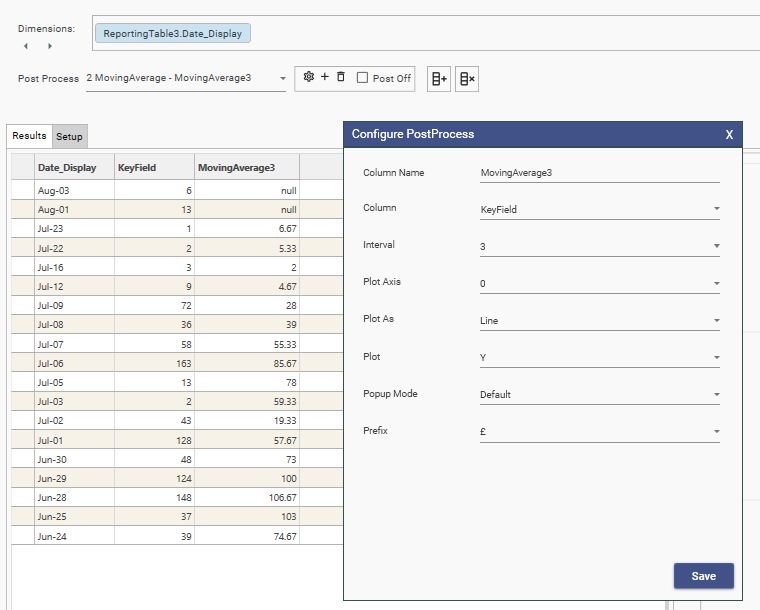
- Calculate rolling averages for various intervals
Parameters
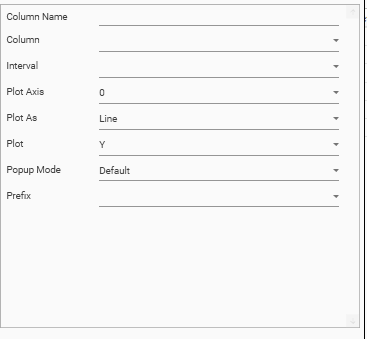
| Parameter | Description |
|---|---|
| Column Name | The name of the output column |
| Column | The source column to use when calculating the MovingAverage |
| Interval | The number of rows to include in the average.
|
| Plot Axis | 0 / 1. Y-Axis to use when plotting graph. Default = 0 |
| Plot As | Bar / Stacked Bar / Line / Spline / RangeLow / RangeHigh / CSLow / CSHigh / CSOpen / CSClose Determines the graph style for the output column. |
| Plot | Y / N. Specifies whether measure’s output column should be plotted on graph. Default = Y |
| Popup Mode | Default / None / Extended |
| Prefix | £ / $ / E / % |
Examples
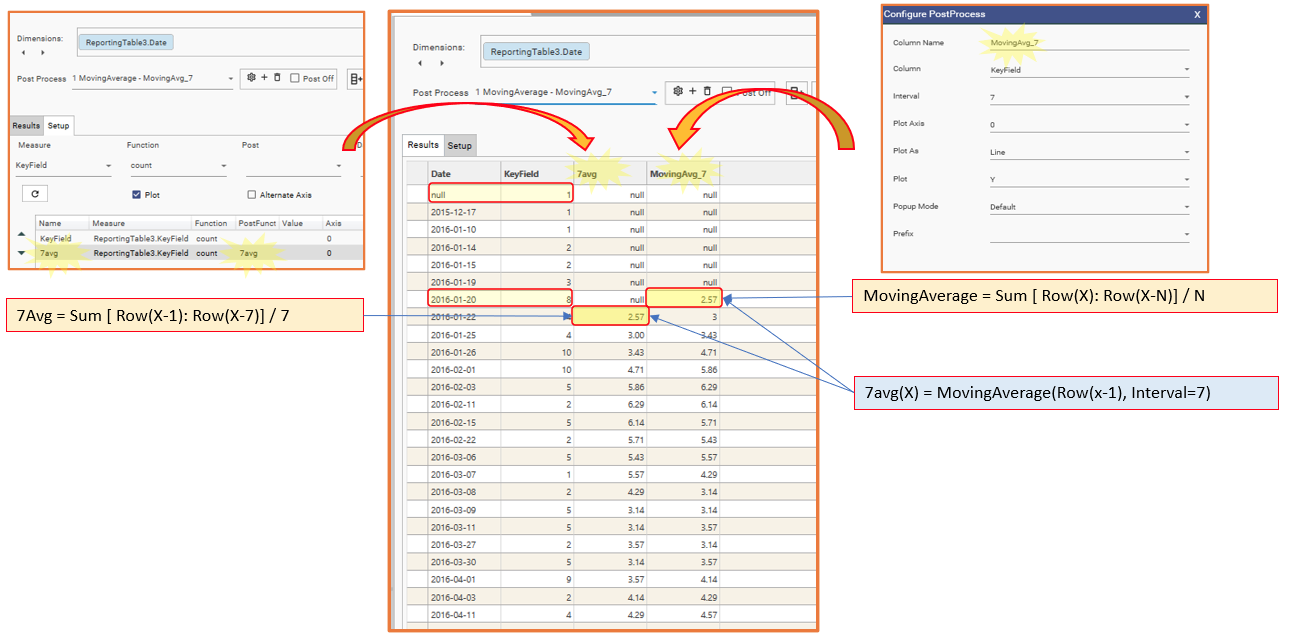
MovingAverage is a more flexible version of Post Function 7avg. Whereas 7avg always calculates intervals of 7, MovingAverage can be used to calculate other intervals.